
Purpose
Brachytherapy (BT) involves providing extremely high radiation doses near a BT source, and its peripheral dose exponentially decreases with increasing distance. Dedicated applicators or catheters are uses to place BT sources within or adjacent to the tumor, which allows delivery of high-dose radiation, with a steep dose gradient surrounding its therapeutic volume. Contemporary BT has demonstrated effective clinical outcomes across multiple treatment sites, notably in the prostate [1-6] and gynecologic cancers [7-11].
With respect to BT quality, sub-optimal applicator placement or improper positioning of interstitial needles are considerable issues. Similarly, inadequate dose distribution optimization with treatment planning system (TPS) can compromise the overall quality of delivered dose. Several methodologies of dose optimizations have been clinically introduced into the commercially used BT TPS, Oncentra® Brachy (Elekta, Stockholm, Sweden). The dose point optimization technique was originally developed for iodine-125 (125I) low-dose-rate BT used in prostate cancer. In this method, approximately several hundred interest points are placed on the target surface, and dwell times are calculated to achieve the prescribed dose. The geometrical optimization method, while it is also a point-based optimization approach, differs in that it does not require manual placement of reference points; instead, virtual points corresponding to source positions are automatically generated, ensuring a uniform dose distribution along the catheter. Manually adjusting dwell times or employing graphical optimization (directly modifying dose distribution by dragging the isodose line with a mouse) is frequently employed for fine-tuning of dose distribution during final stages of the procedure. Inverse planning (IP) techniques, similar to intensity-modulated radiotherapy (IMRT) planning, have also been introduced into BT. Currently, there are two optimizer types available in Oncentra® Brachy: the IP simulated annealing (IPSA) optimizer [12, 13] and hybrid inverse treatment planning optimization (HIPO) [14]; both originally developed for BT in prostate cancer. The IPSA optimizer uses a simulated annealing algorithm to optimize the source positions and dwell times. The given dose constraints for the target and organs at risk (OARs) optimize the three-dimensional dose distribution based on anatomical optimization. HIPO is a hybrid optimizer, which uses a simulated annealing algorithm and a limited memory Broyden-Fletcher-Goldfarb-Shanno (L-BFGS) deterministic algorithm. The heterogeneity in optimized dwell time distributions is improved compared with a previous IPSA algorithm [15, 16]. Furthermore, HIPO permits a selective optimization of specific applicators while maintaining pre-determined dwell times in others, allowing users to define the objects of optimization. In other TPS, the SagiPlan (Eckert & Ziegler BEBIG GmbH, Germany) and Eclipse Brachy-Vision software (Varian Medical System Inc., Palo Alto, CA, USA), the IP is also clinically available [17, 18].
Numerous studies have examined the dosimetric characteristics and effectiveness of IP by using the IPSA optimizer and HIPO [15, 16, 19-24], focusing on DVH parameters or dwell time analysis. There has been a lack of discussion regarding the consistency in conventional intracavitary and interstitial (IC/IS) BT dose distribution. Particularly when introducing new optimization into clinical practice, it is important to maintain consistency with conventional dose distributions using IC/IS BT applicators. Several studies [25, 26] have proposed adding dummy structures to preserve the pear-shaped dose distribution during optimization.
In this study, we proposed a semi-automatic HIPO approach for gynecological brachytherapy, which preserves the pear-shaped dose distribution without the necessity of dummy structures. Also, we assessed the influence of HIPO’s optional settings, allowing fixation of specific applicators while optimizing the remaining catheters. In addition, we quantified the dosimetric impact of omitting the fixation constraint and aimed to demonstrate dose distributions, which could be deemed clinically unacceptable.
Material and methods
Patient characteristics and radiotherapy
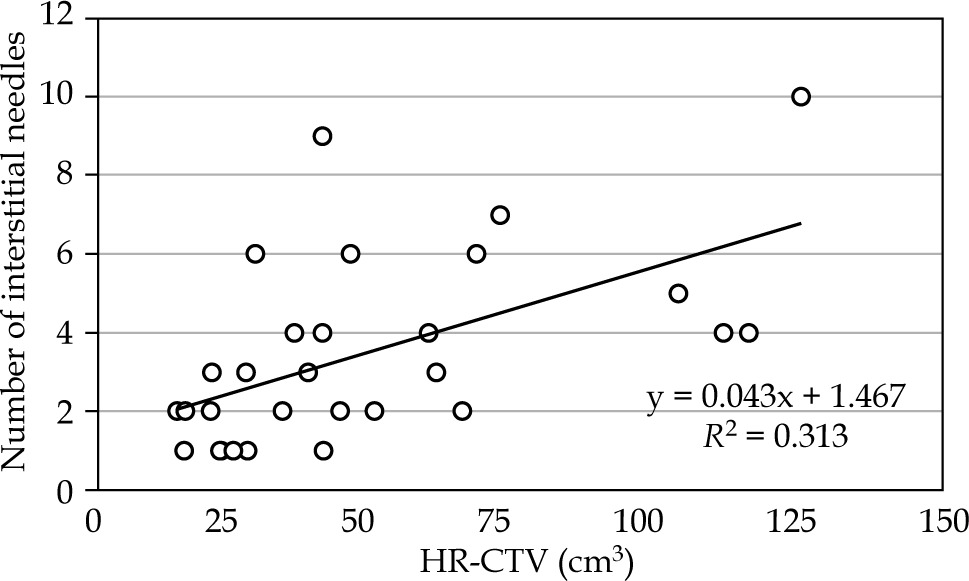
We analyzed 29 consecutive patients with gynecological cancers, who underwent a combination of IC/IS CT-based image-guided adaptive BT (IGABT) between 2019 and 2022 at the National Cancer Center Hospital in Japan. For treatment delivery, we utilized a Nucletron remote afterloading system (MicroSelectron mHDR-v2r, Nucletron, Elekta Company, Stockholm, Sweden) and Nucletron Oncentra® Brachy (version 4.5.3). The patient characteristics and treatment details are summarized in Table 1. The guiding principle was to insert IS needles transperineally into portions of high-risk clinical target volume (HR-CTV) insufficiently covered by the conventional Manchester distribution. IS needle geometry was determined under real-time ultrasound and CT guidance, with verification of needle position, angle, and depth. To effectively mitigate OARs doses, a spacer, Suvenyl® (Chugai Pharmaceutical Co., Tokyo, Japan) [27-31] was administered in 28 patients. A BT treatment plan were created for each treatment fraction. We analyzed the first-fraction BT treatment plan in 24 cases, and in five cases, we selected treatment plans of other fractions because IC/IS tandem/ovoid was not used for the first-fraction. The HR-CTV, rectum, bladder, bowel, and sigmoid were routinely delineated, and additionally, the uterus body was delineated in this study for the optimization process. Figure 1 depicts the number of IS needles in relation to HR-CTV (cm3) for the 29 cases. A moderate correlation (r = 0.56) was observed, and the median number of needles was 3 (range, 1-10). This study was approved by the Institutional Ethics Review Board at National Cancer Center Hospital (approval number: 2017-091).
Table 1
Patient characteristics (n = 29)
Clinical treatment plan
At out institution, IP optimization, including HIPO and IPSA, has not been clinically introduced for gynecological cancer. In the current clinical practice, treatment plans are prepared according to the following procedures based on the Japanese IC/IS BT guidelines [32]: Step 1. Source activations and dwell time weights for the ovoid and tandem applicators are determined based on the Manchester system (MS), and dose distribution is normalized to point A [33]. Since dwell times are uniform, the dose distribution forms a pear shape, as shown in Figure 2 (labeled “MS”); Step 2. Source activations in IS needles are manually placed by referring to three planes on CT images or three-dimensional graphs displaying HR-CTV and source activations. Typically, source activations are often placed within a 3-5-mm margin surrounding HR-CTV. Next, short dwell times of approximately 1-3 sec (as determined from our previous experiences) are manually assigned to IS needles. Steps 1 and 2 are routinely performed by a medical physicist, followed by step 3 a radiation oncologist, who manually refine dose distribution through graphical and manual optimization, with the goal of meeting dose constraints and prioritizing OARs dose reduction, particularly for the rectum, bladder, bowel, and sigmoid D2cm3 (Table 2). Subsequently, the radiation oncologist attempts to improve dose coverage of HR-CTV, with reference to D90% and V100%. For treatment plan evaluation, we used a Microsoft Excel® spreadsheet to calculate the equivalent dose in 2 Gy fractions (EQD2) for BT, and to sum all calculated EQD2 values at all fractions for external beam radiotherapy (EBRT) and BT to meet dose constraints.
Inverse planning
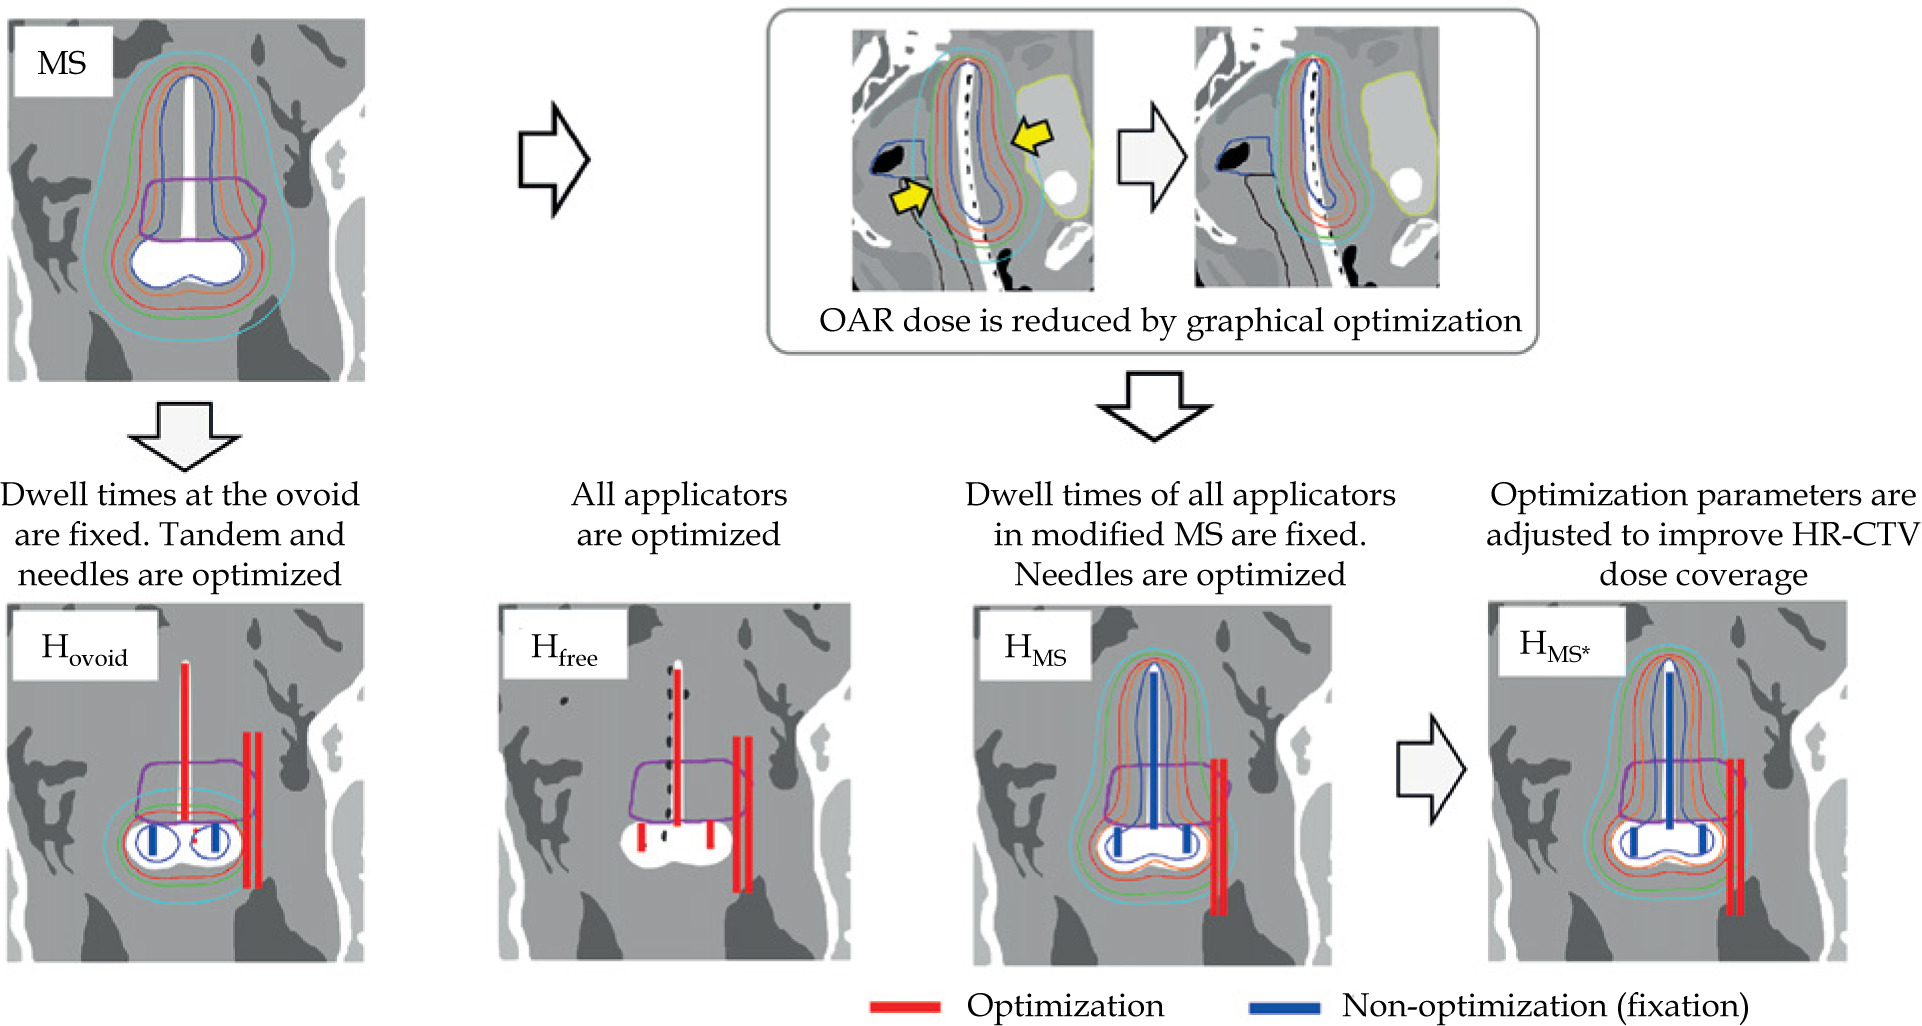
Four types of treatment plans utilizing HIPO were prepared from copies of clinical treatment plan (CP). Figure 2 illustrates the workflow of preparing these four treatment plans, and Table 3 summarizes the four treatment plans, including Hovoid, Hfree, HMS, and HMS*. Applicator reconstruction and delineations were not edited from the CP, and only source activations or dwell times were determined using the following four methods: 1. Hovoid: Ovoid applicator dwell times were the same as those in the MS, and ovoid dwell times were fixed using a HIPO function during optimization. Consequently, only tandem and IS needle dwell times were optimized based on the defined optimization parameters (Table 4); 2. Hfree: All dwell times for all applicators, including IS needles, were optimized without employing the fixation function; 3. HMS: Initially, the MS plan was generated, followed by a reduction of OARs doses (at 2 cm3 volumes or maximum doses) for the rectum, bladder, bowel, and sigmoid to below nearly 4 Gy by graphical optimization, which can be regarded as a reasonable and achievable goal. After creating an OAR-sparing MS dose distribution, i.e., prioritizing the reduction of OAR dose with deterioration of HR-CTV dose coverage, the fixation function was applied to the tandem and ovoid applicators. Subsequently, only dwell times at IS needles were optimized to improve the HR-CTV dose coverage. Optimization parameters were the same as those used for other treatment plans (Table 4); 4. HMS*: Discrepancy between the median dose of HR-CTV D90% in the HMS and that in the CP were qualified. For instance, if the discrepancy is 1 Gy (CP HR-CTV median D90% = 7 Gy vs. HMS HR-CTV median D90% = 6 Gy), the optimization parameter is adjusted from its initial value of 6 Gy to 7 Gy to improve the HR-CTV dose coverage. The revised treatment plan was named HMS*, and designed to assess the potential for improving dose distribution by modifying the optimization parameters. The optimization parameters for OARs are listed in Table 4, while we used the adjusted value given in parentheses, 6.4 Gy for HR-CTV. Ultimately, we evaluated the improvement in HMS* D90% to determine the effect of systematically changing the HR-CTV parameter from 6 Gy to 6.4 Gy. In all HIPO plans, no additional dose distribution adjustments, such as those performed in the CP, were made, and dose distributions obtained directly from the optimization process were used for comparison.
Table 3
Summary of the four treatment plans
Table 4
Optimization parameters in HIPO
| Structure | Usage | Min weight | Min value (Gy) | Max value (Gy) | Max weight | Priority 2 |
|---|---|---|---|---|---|---|
| HR-CTV | PTV | 50 | 6 (6.4 1) | 14 | 0.1 | 5 |
| Uterus body | CTV | 10 | 4.5 | 24 | 0.1 | 6 |
| Rectum | OAR | 4 | 70 | 3 | ||
| Bladder | OAR | 4 | 70 | 2 | ||
| Bowel | OAR | 4 | 70 | 1 | ||
| Sigmoid | OAR | 4 | 70 | 4 | ||
| Normal tissue 3 | 10 | 0.1 |
[i] The same parameters were used for Hovoid, Hfree, HMS, and HMS*; A dwell time gradient restriction (DTGR) = 0.5; OAR – organ at risk, Min – minimum, 1 Only HMS* used 6.4 Gy, 2 Priority: When there is overlap between organs, the parameters are prioritized according to the order specified in priority settings. Because the bowel is assigned a priority value of 1, this OAR is spared rather than HR-CTV if the two structures overlap, 3 Normal tissue: It is considered to be a slab of tissue surrounding PTV and not enclosing any other user-defined structures
Plan evaluation
A single BT plan and a total plan, including EBRT and BT, were evaluated for the MS, Hovoid, Hfree, HMS, and HMS*. A single BT plan was used for almost all first-fraction cases; therefore, it was assumed that all fractions within the BT course corresponded to the analyzed single BT plan when assessing the total plan. DVH parameters for the HR-CTV, rectum, bladder, bowel, and sigmoid were assessed using the clinically used dose constraints (Table 2). As revealed in Table 1, the two EBRT techniques were performed including only the whole pelvis (WP) with IMRT and WP plus central shield (CS). The pre-scribed doses of EBRT for the two techniques were different (Table 1). Traditionally in our hospital, pelvic EBRT with CS has been routinely implemented according to the Japanese Clinical Practice Guidelines [32, 34]. However, with accumulated experience, in employing gel spacers to reduce rectal and bladder doses [27-31], we have progressively expanded the use of pelvic EBRT without CS, primarily because the usage of CS complicates accurate dose summation between EBRT and BT.
In the pelvic EBRT with CS, the dose contribution from CS to the target and OAR was not conventionally accounted for in the calculation of total EQD2. As a result, the total EQD2 for the HR-CTV D90% tended to be lower than that in the WP alone. Therefore, two separate HR-CTV D90% criteria were specified (Table 2). For the WP technique, we referenced the ASTRO guidelines [35] as well as the Groupe Européen de Curiethérapie and European Society for Radiotherapy and Oncology (GEC-ESTRO) GYN working group recommendations [36], while for WP + CS, the Japanese guidelines were followed [32, 37]. It should be noted that these guidelines allow dose escalation or de-escalation based on the tumor size and treatment response; however, the present study considered only two fixed thresholds of ≥ 80 Gy (ASTRO) and ≥ 85 Gy (GEC-ESTRO). For EQD2 calculations, α/β ratio of 10 Gy for the target and 3 Gy for OARs were applied. In addition, as indicated in Table 1, the actual number of fractions varied among patients. In this study, given that the primary objective was to evaluate the quality of HIPO plans, the total EQD2 for all patients was calculated under the assumption of four BT fractions.
In order to assess conventional pear-shaped dose distributions, two indices were proposed: 1. Previous studies have evaluated dose distributions using total reference air-kerma (TRAK) [25, 26]. In this study, we calculated the similarity index Isim,X defined as the ratio of total TRAK in intracavitary applicators used for HIPO plans to that of a MS plan, for 29 patients to assess the consistency of pear-shaped dose distribution using the following equation:
where TRAKX,HIPO is the TRAK for the X applicators in the HIPO plans, and TRAKX,MS is the TRAK for the X applicators in the MS plan. The X applicators included the tandem, ovoid, and a combination of both tandem and ovoid; accordingly, Isim, ovoid, Isim, tandem, and Isim, all were calculated. An Isim, all value approaching 1 was interpreted as indicative of greater similarity to the conventional pear-shaped dose distribution. 2. The symmetry index Isymmetry for the left and right ovoid applicators were evaluated according to the following equation:
The total dwell time for each ovoid was calculated individually, and the two totals from both ovoids were compared. The larger total dwell time was defined as Tmax, and the smaller as Tmin. In the MS and Hovoid, Isymmetry equaled 1, as the dwell times at both ovoids were equal. Supplementary Figure 1 provides examples of the dose distributions deviating from the conventional pear-shaped pattern, with two indices, Isim,X and Isymmetry.
The GEC-ESTRO guidelines recommend that the proportion of dwell times at IS needles should be < 10-20% of the total dwell times [38, 39], as the intracavitary applicator is recognized as the primary contributor to the tumor dose. The index F, representing the percentage of dwell times at IS needles was calculated using the following equation:
where, F is the proportion of the dwell times at IS needles (Tneedle) relative to the total dwell times (Ttotal).
Statistical analysis
DVH parameters, similarity, and symmetry index for HIPO plans were compared with those for the CP using Wilcoxon signed-rank test, assuming the null hypothesis that the two paired samples (HIPO vs. CP) have the same median. Statistical significance was defined as a p-value < 0.05. Correlation strengths was classified based on r-value ranges as follows: 0-0.19: very weak; 0.20-0.39: weak; 0.40-0.59: moderate; 0.60-0.79: strong; and 0.80-1.0: very strong. All statistical analyses were performed with MATLAB 2022b (MathWorks, Natick, MA, USA).
Results
Figure 3 presents the box-plots for the HR-CTV D90% as well as the rectum, bladder, bowel, and sigmoid D2cm3 in a single BT plan. Given that the HR-CTV V100% is a parameter commonly used in clinical practice, it was added to Figure 3. The MS plans exhibited substantial variations in HR-CTV D90% and V100%, with concern remaining for inadequate dose coverage and high OARs doses (particularly for the bladder, bowel, and sigmoid) compared with those in the HIPO and clinical plans. The median dose of HR-CTV D90% for HMS and CP was 6.7 and 7.1 Gy, respectively, corresponding to a discrepancy of approximately 0.4 Gy (p < 0.05). Accordingly, the optimization parameter for HR-CTV D90% was adjusted to 6.4 Gy to generate HMS* (see annotation 1 in Table 4). For the HIPO plans (Hovoid, Hfree, HMS, HMS*), the dose coverage to HR-CTV improved compared with that of the MS. As for OARs, Hfree exhibited the lowest doses. However, some cases revealed dose distributions deemed clinically unacceptable. HMS* could improve the dose coverage to HR-CTV through adjustment of the optimization parameter. Importantly, although the dose coverage to the target improved, no significant increase in OARs doses was observed.
Fig. 3
DVH parameters in a single BT plan for A) HR-CTV D90%, B) V100%, C) the rectum D2cm3, D) the bladder D2cm3, E) the bowel D2cm3, and F) the sigmoid D2cm3
* p < 0.05 (reference = CP)
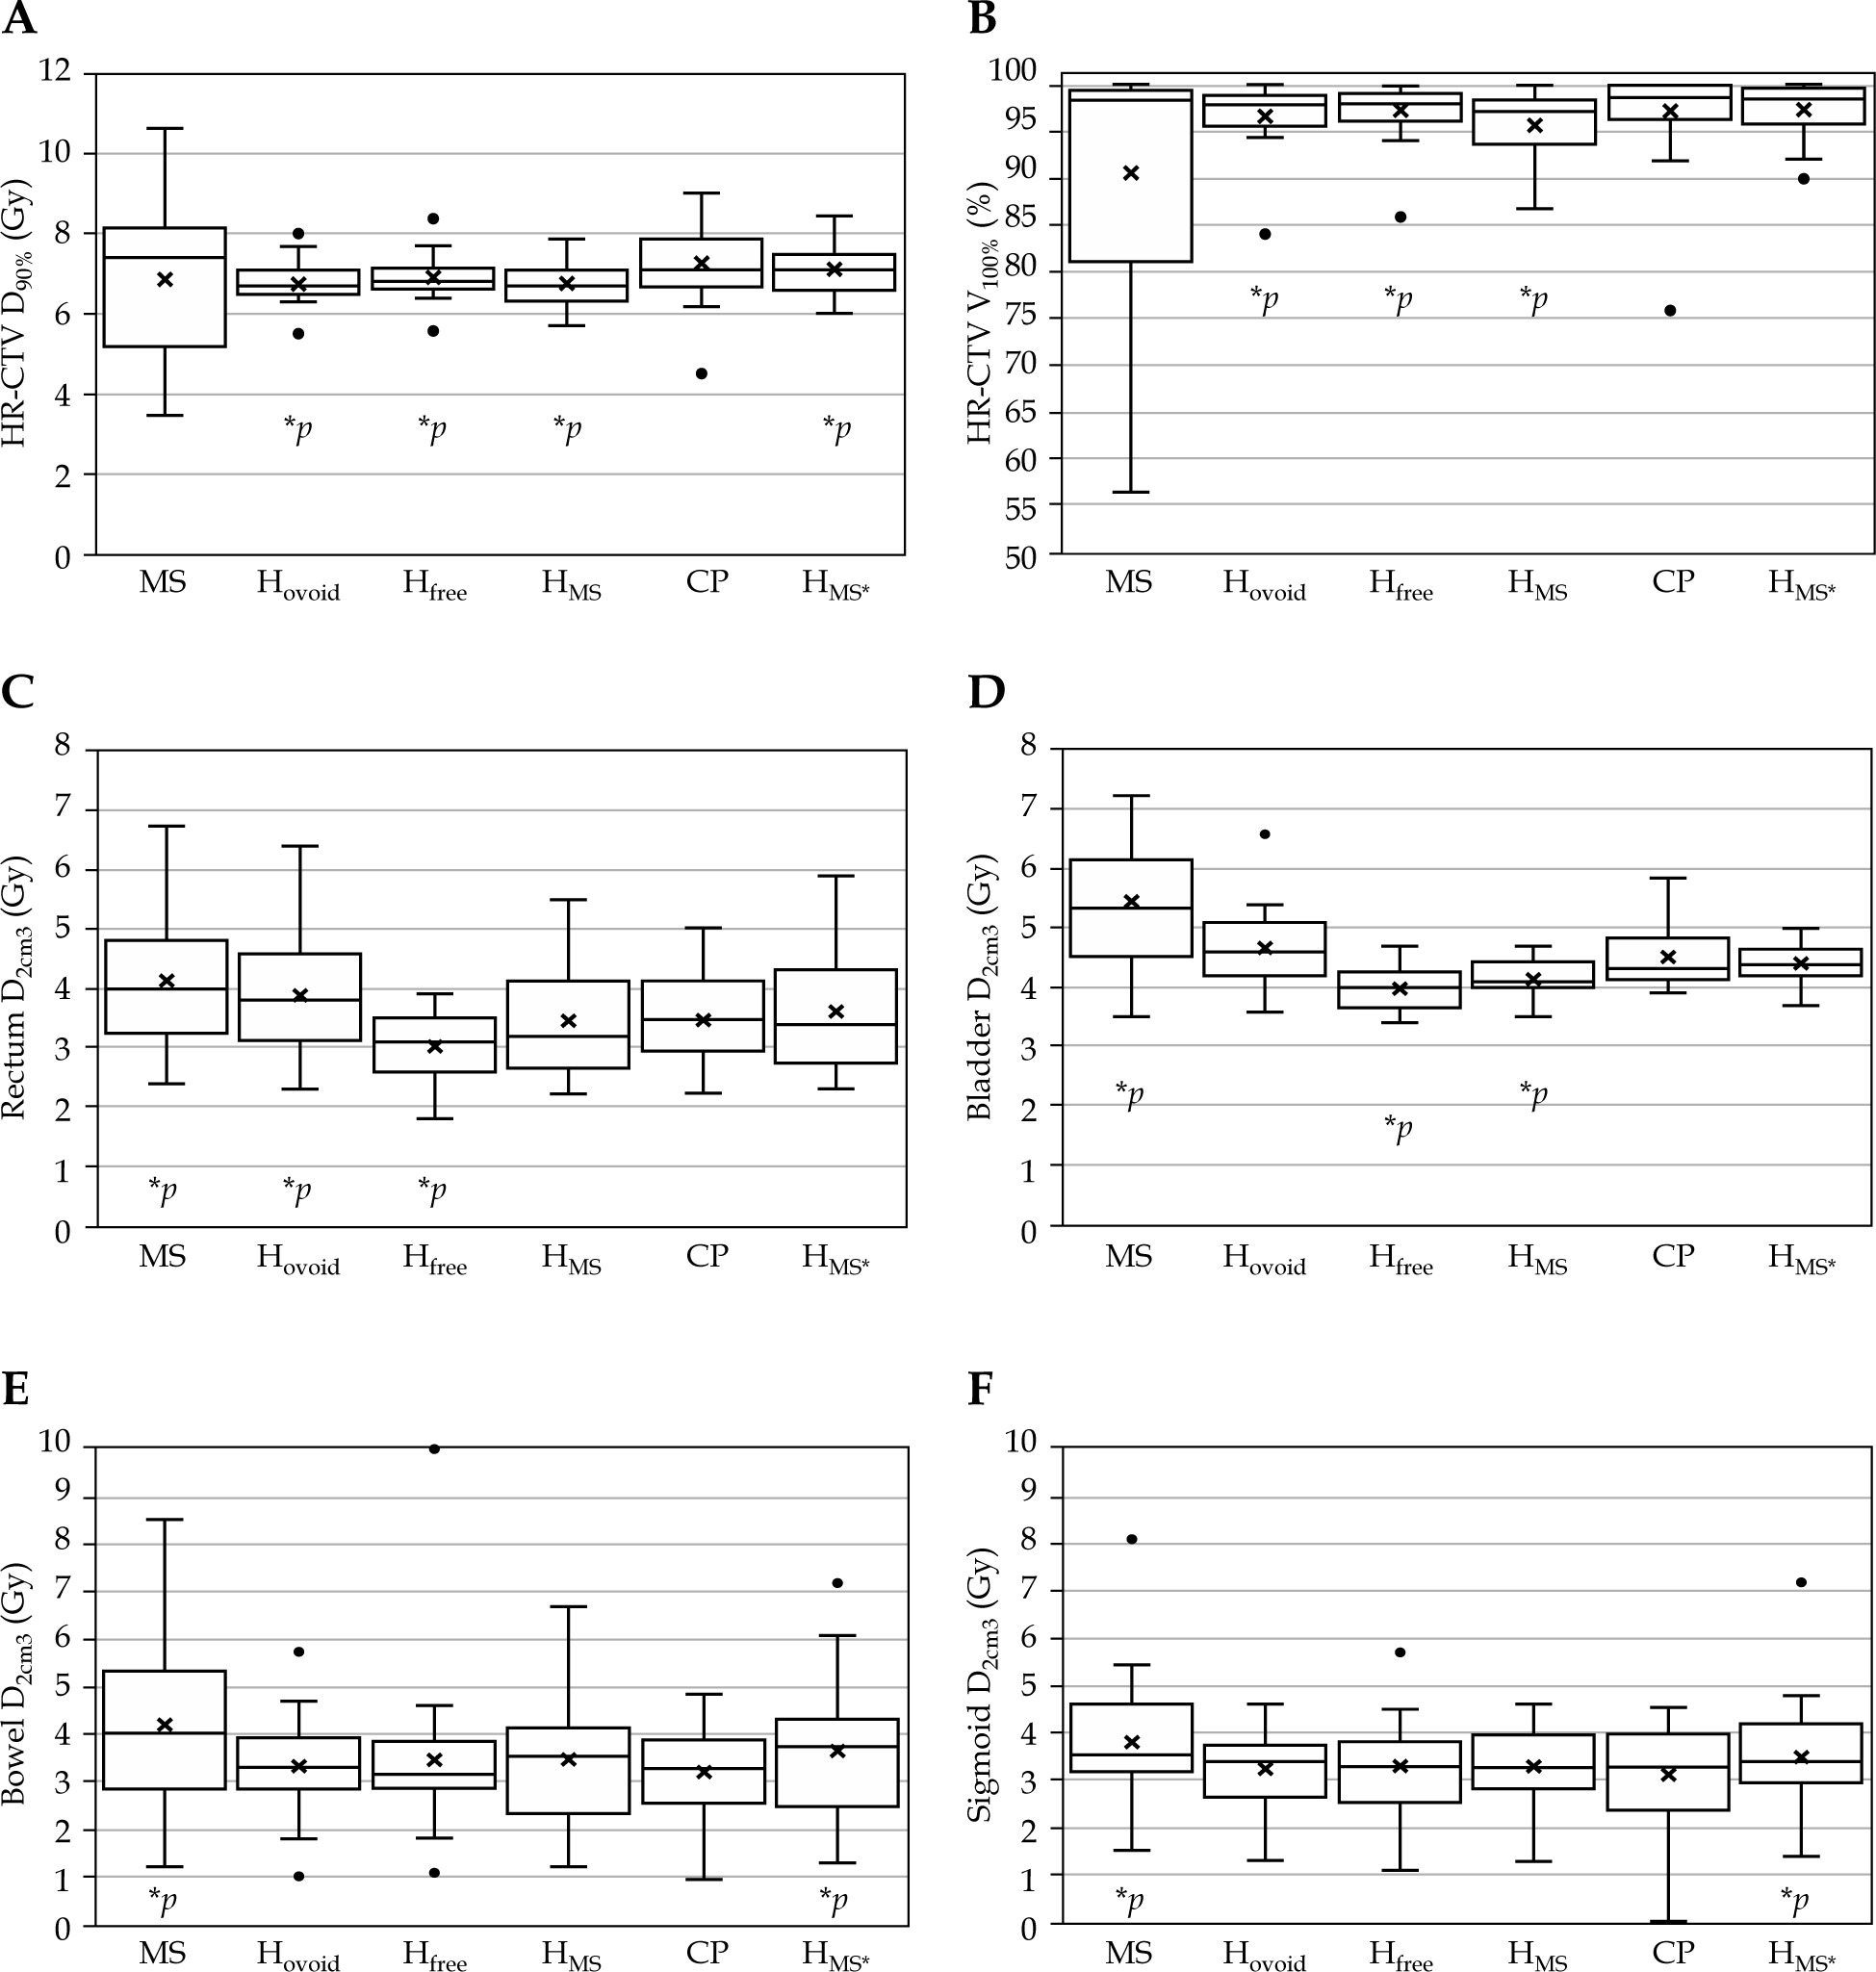
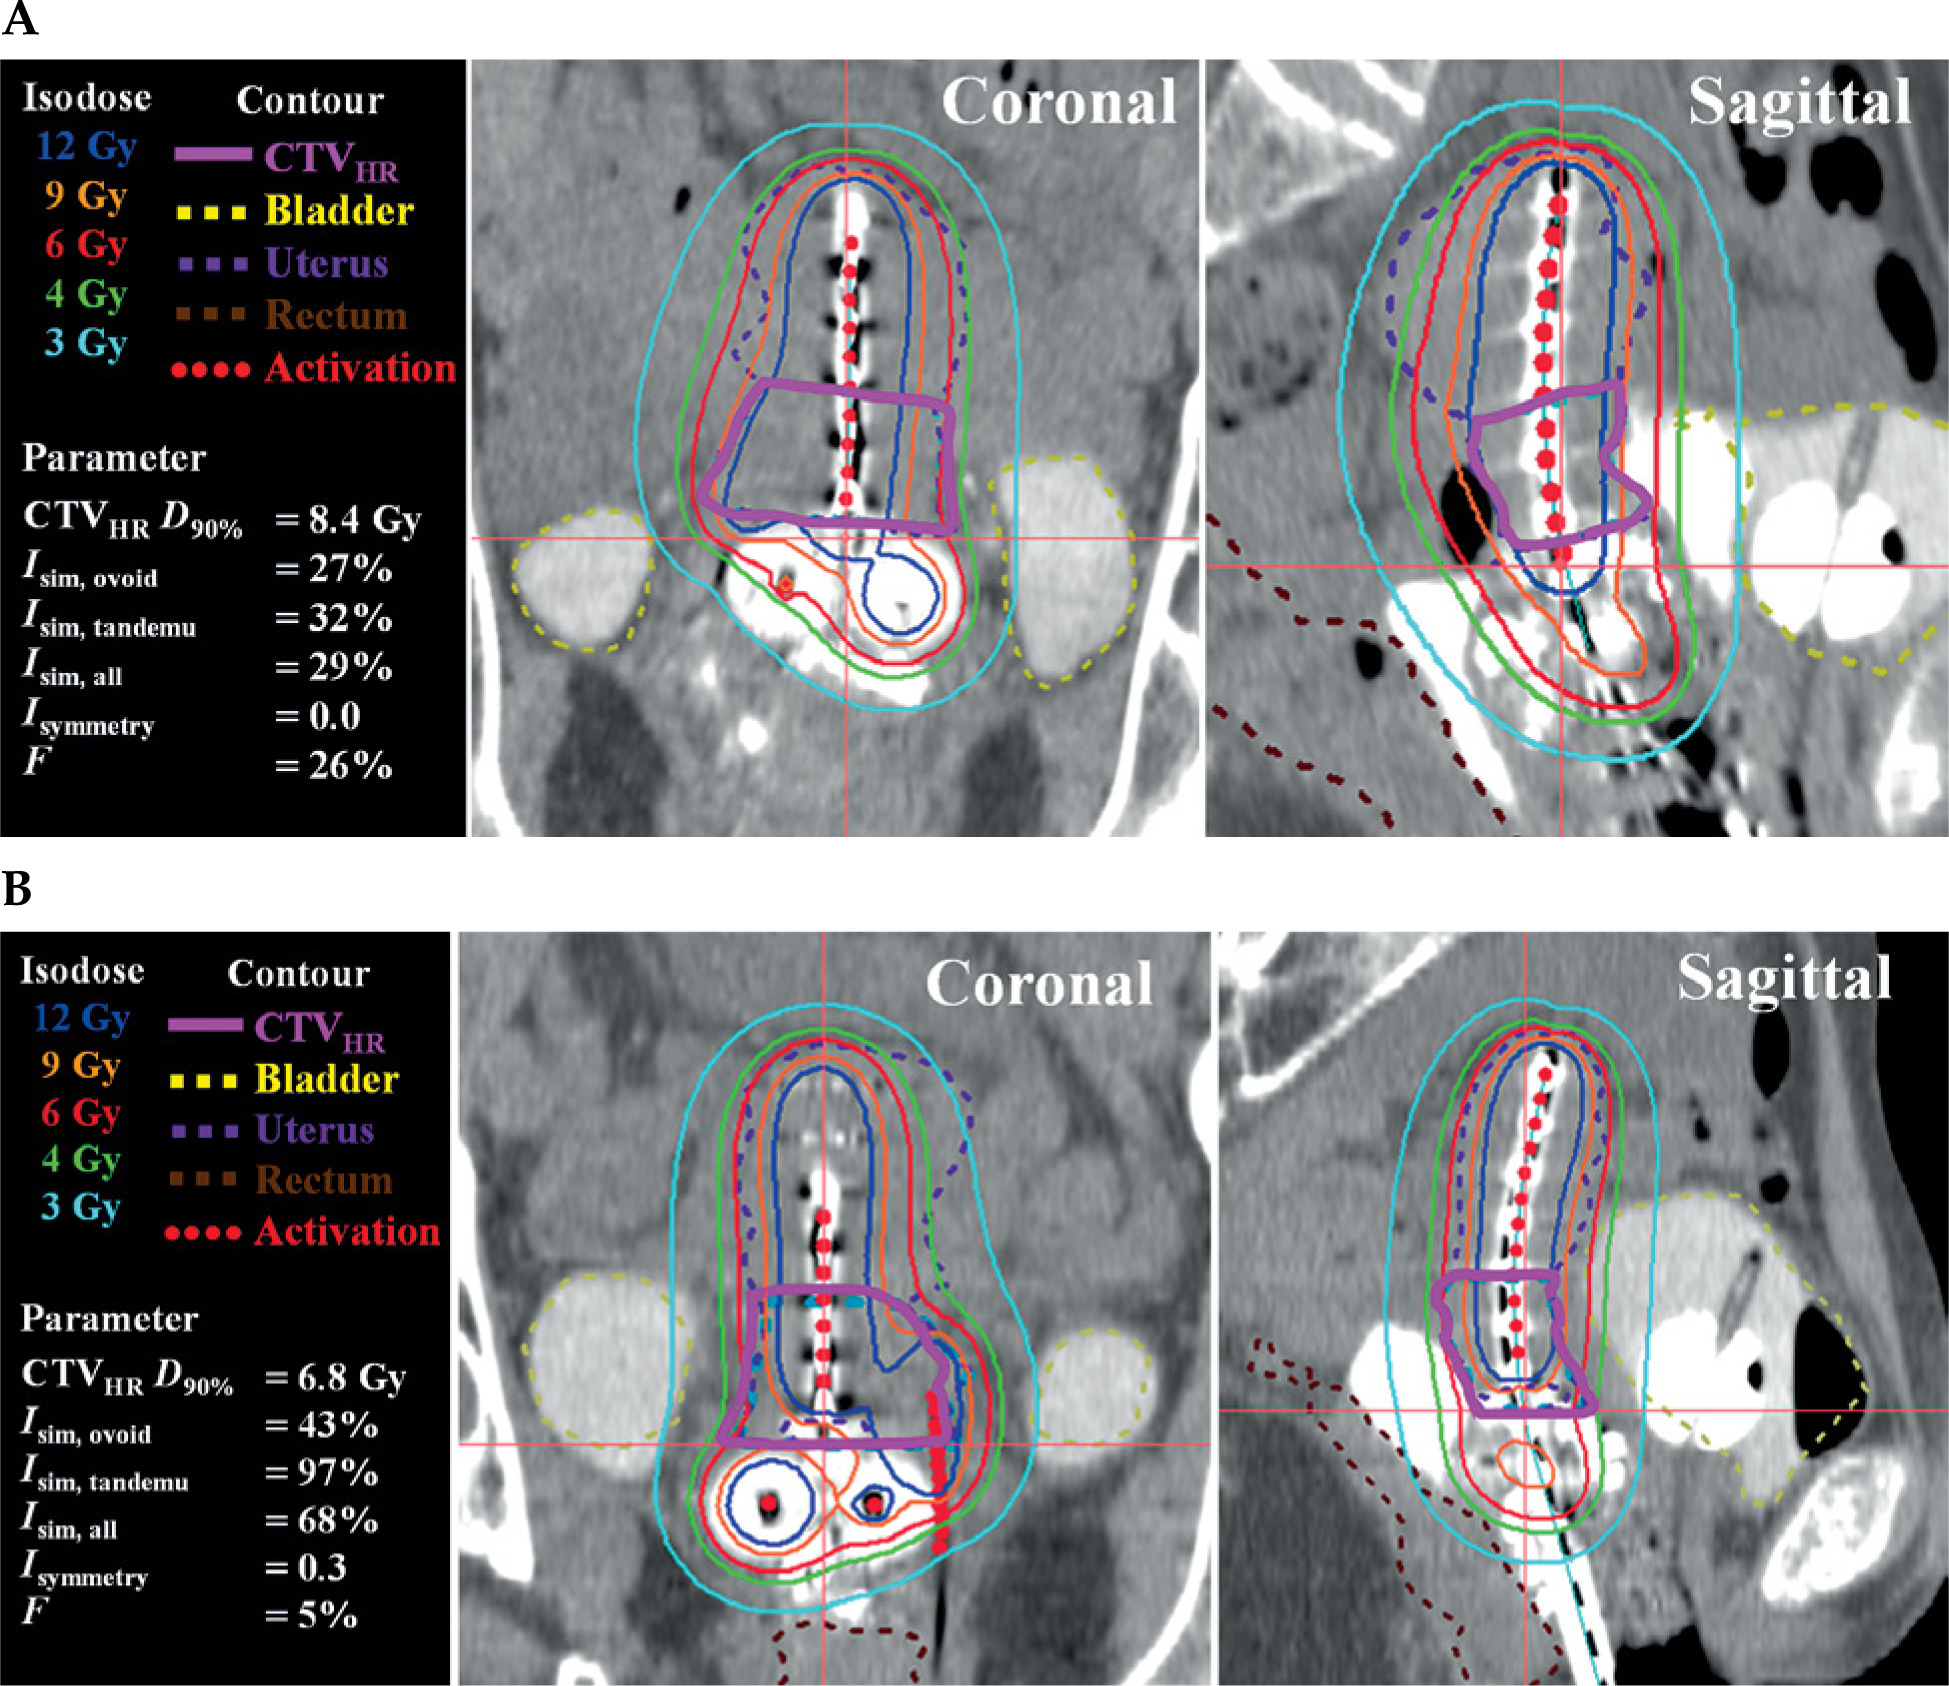
Figure 4 presents EQD2 summation for EBRT and BT box-plots for the target and OARs across different EBRT techniques. Table 5 and Supplementary Figure 2 show the percentage of plans, which satisfied the DVH parameters, as shown in Table 2, across all treatment plans. As anticipated, the MS plans exhibited lower compliance rates for both targets and OARs constraints. In contrast, the HIPO plans demonstrated high compliance rates, exceeding 80% for EQD2 > 80 Gy across all plans. For EQD2 > 85 Gy, the CP indicated the highest compliance rates, followed by the HMS*, which both were designed to improve the dose coverage by adjusting optimization parameters (Table 4). With regards to OARs constraints, the HIPO plans achieved slightly higher compliance rates compared with the CP. In WP + CS cases, it was easier to satisfy both HR-CTV and OARs constraints simultaneously compared with WP plans alone. Figure 5 shows a typical CP and HMS* from one case. The other treatment plans were not presented, as their dose distributions were comparable.
Fig. 4
DVH parameters in the total plan, including EBRT and BT for HR-CTV for A) WP only and B) WP + CS, C, D) the rectum, E, F) the bladder
WP – whole pelvis, CS – central shield, CP – clinical plan, * p < 0.05 (reference = CP)
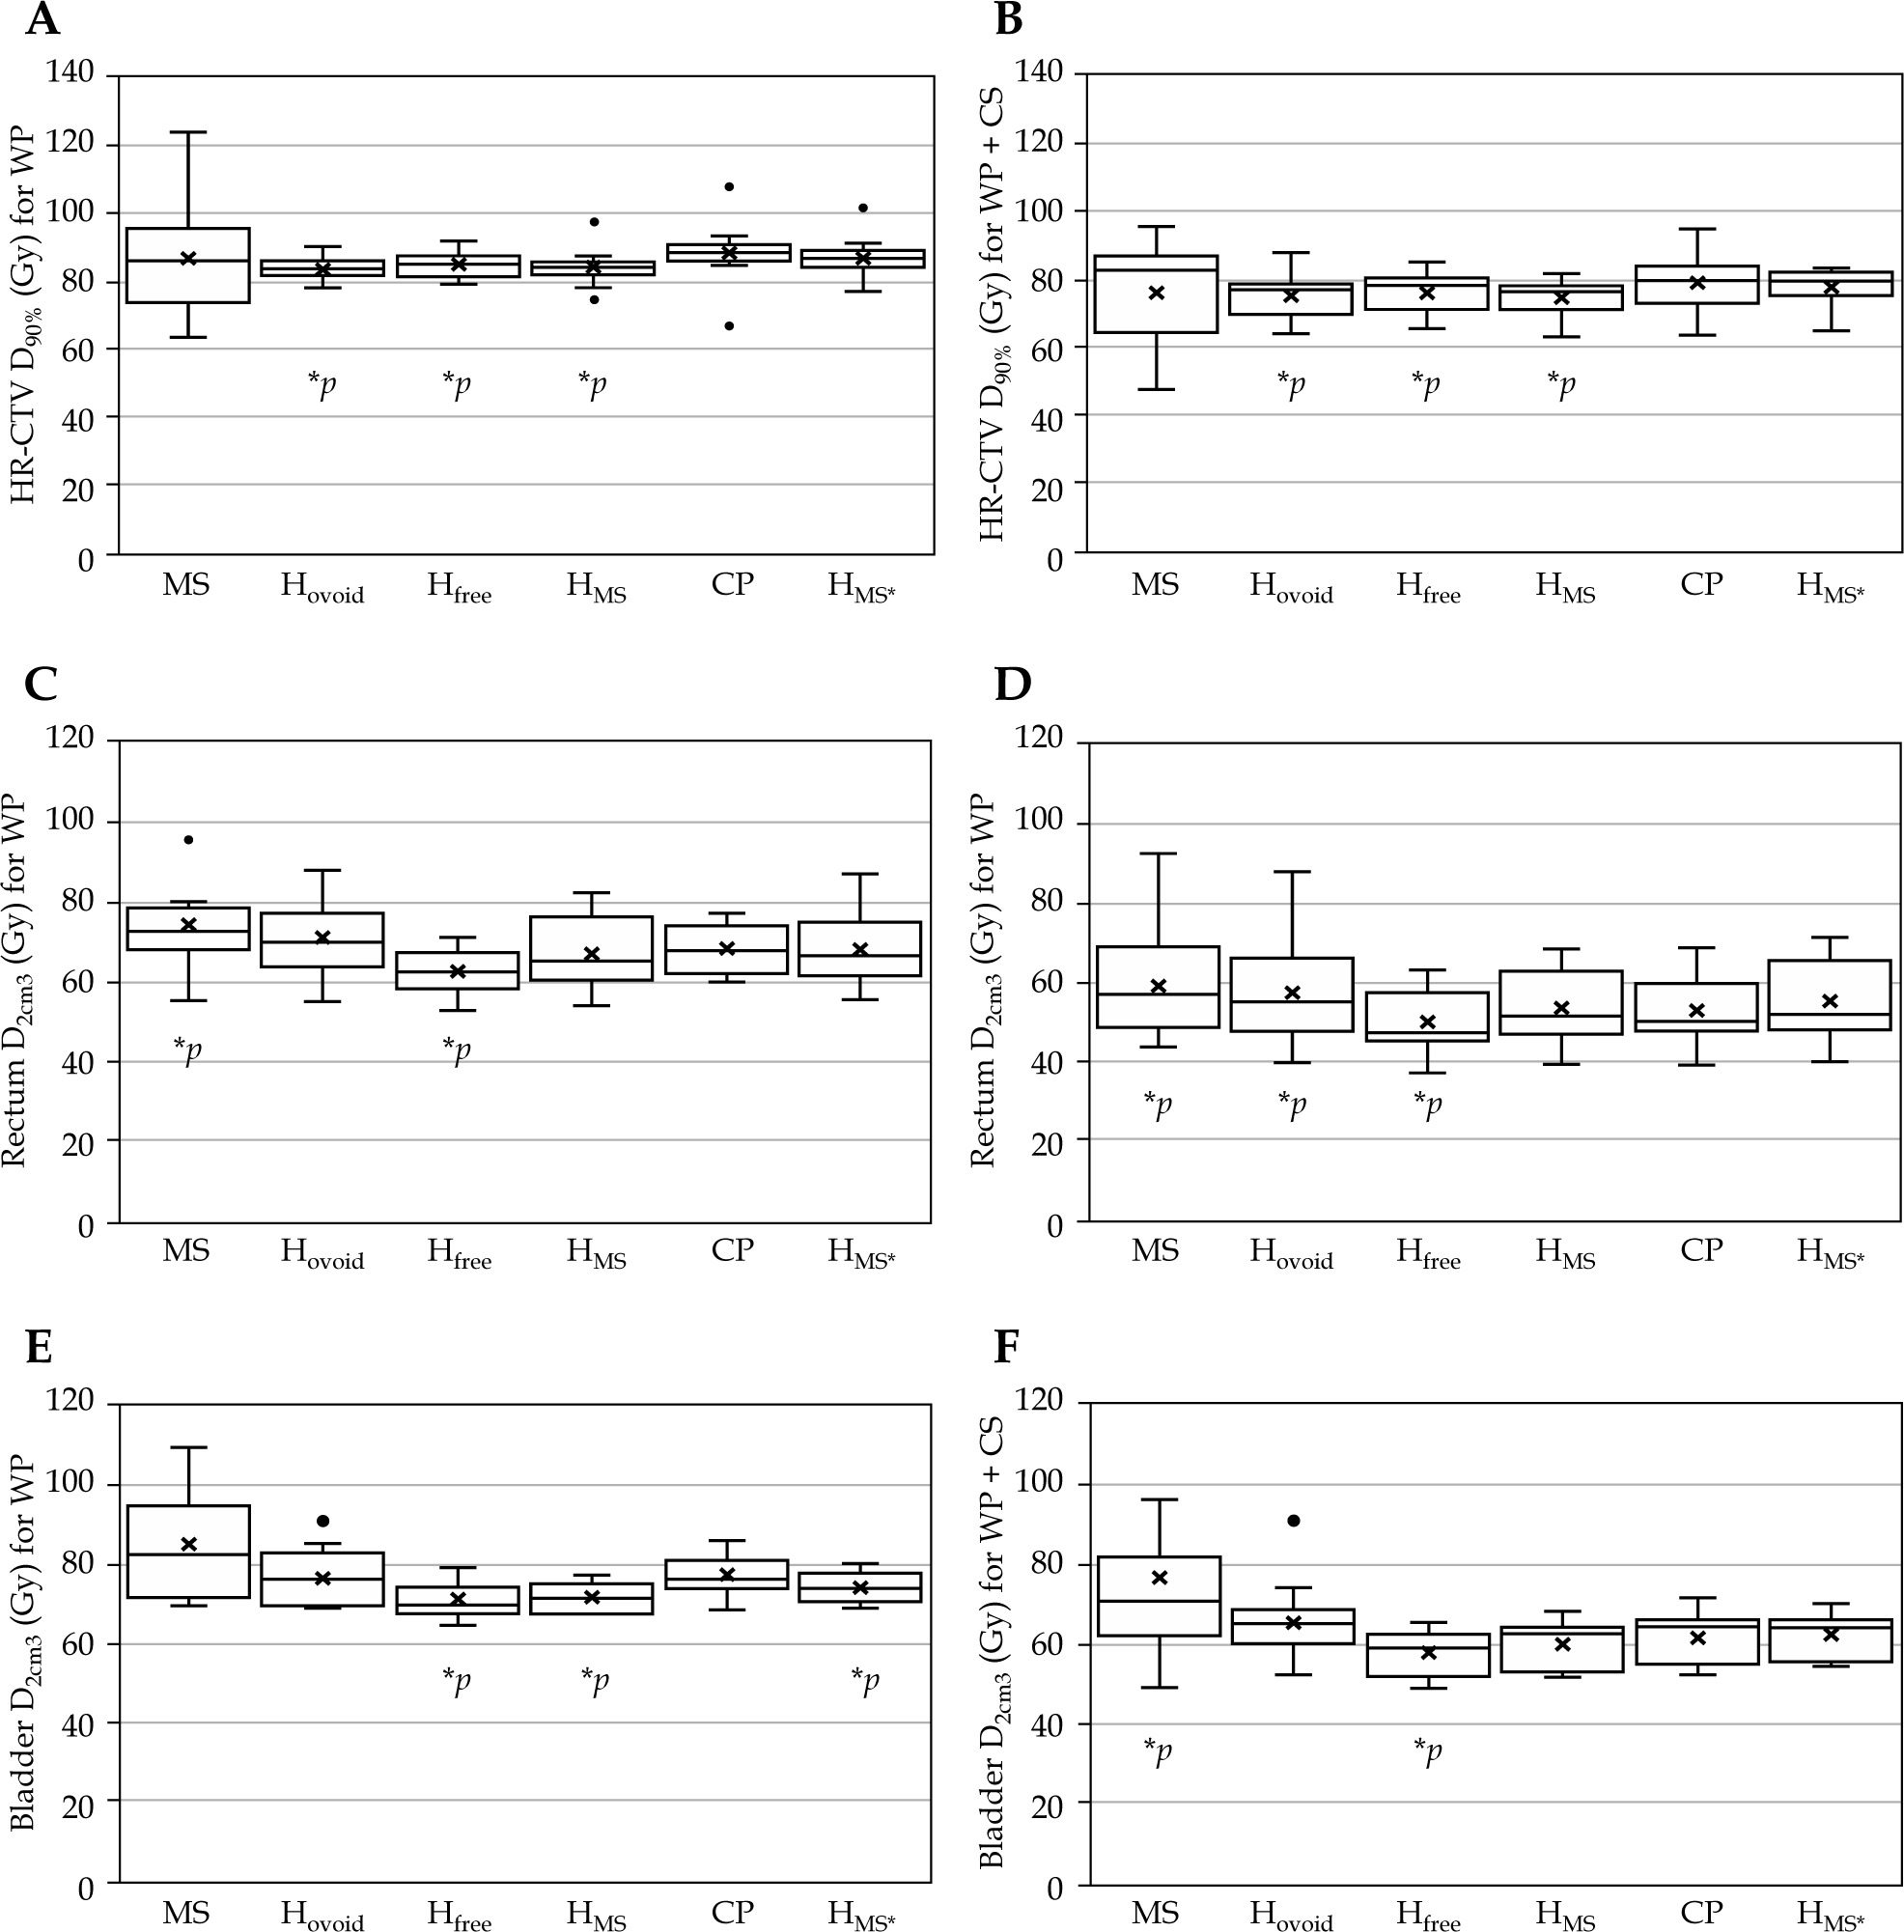
Fig. 4
Cont. DVH parameters in the total plan, including EBRT and BT for HR-CTV for G, H) the bowel, and I, J) the sigmoid
WP – whole pelvis, CS – central shield, CP – clinical plan, * p < 0.05 (reference = CP)
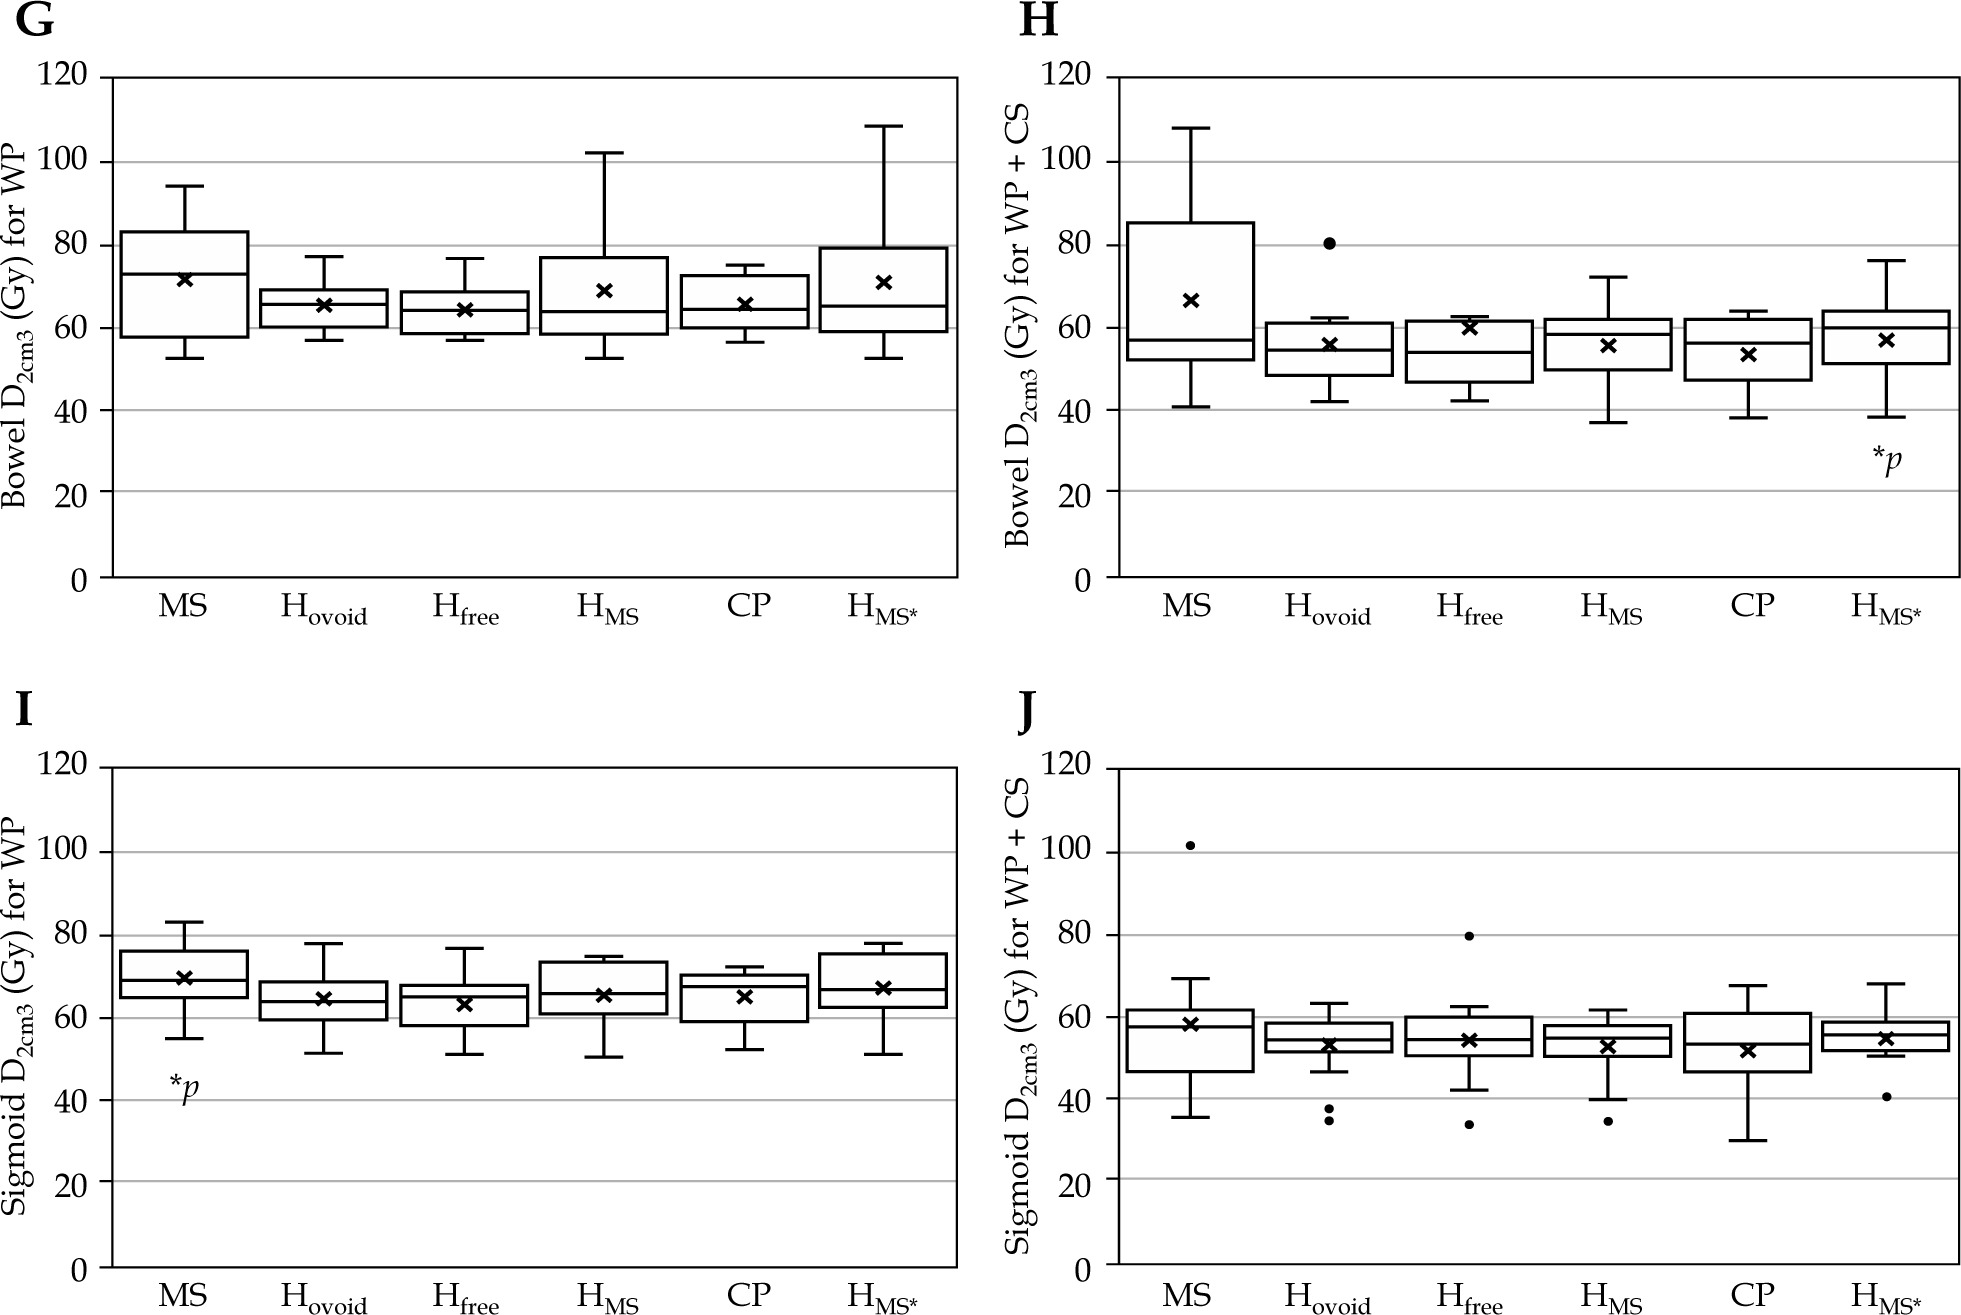
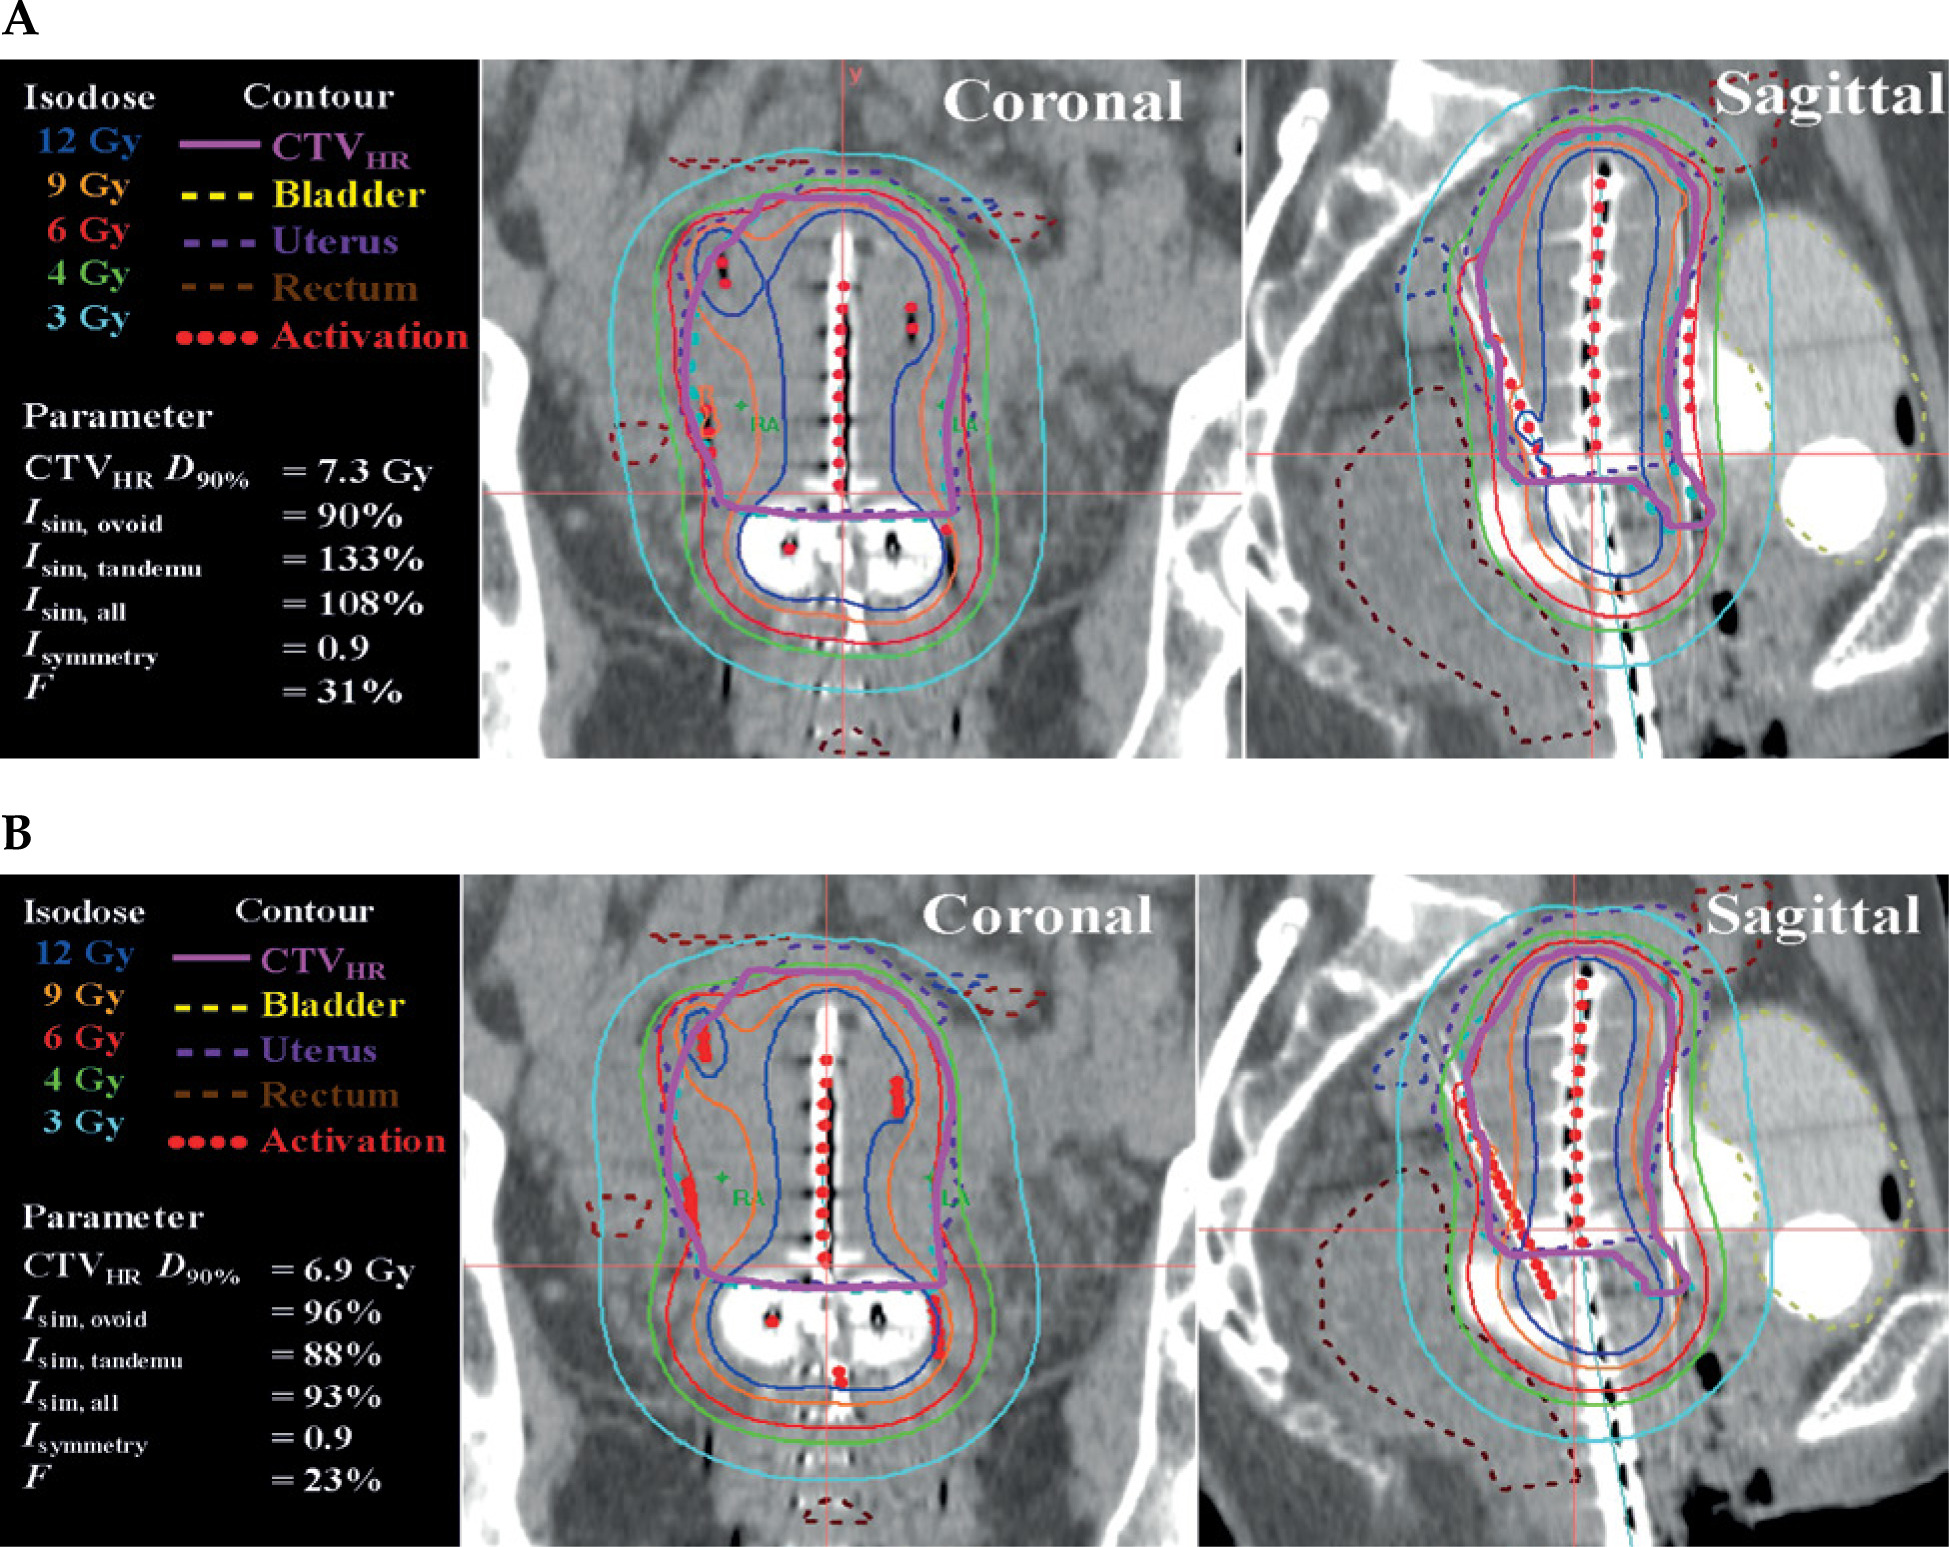
Table 5
Number (percentage) of plans, which satisfied DVH parameters, as shown in Table 2, for all treatment plans
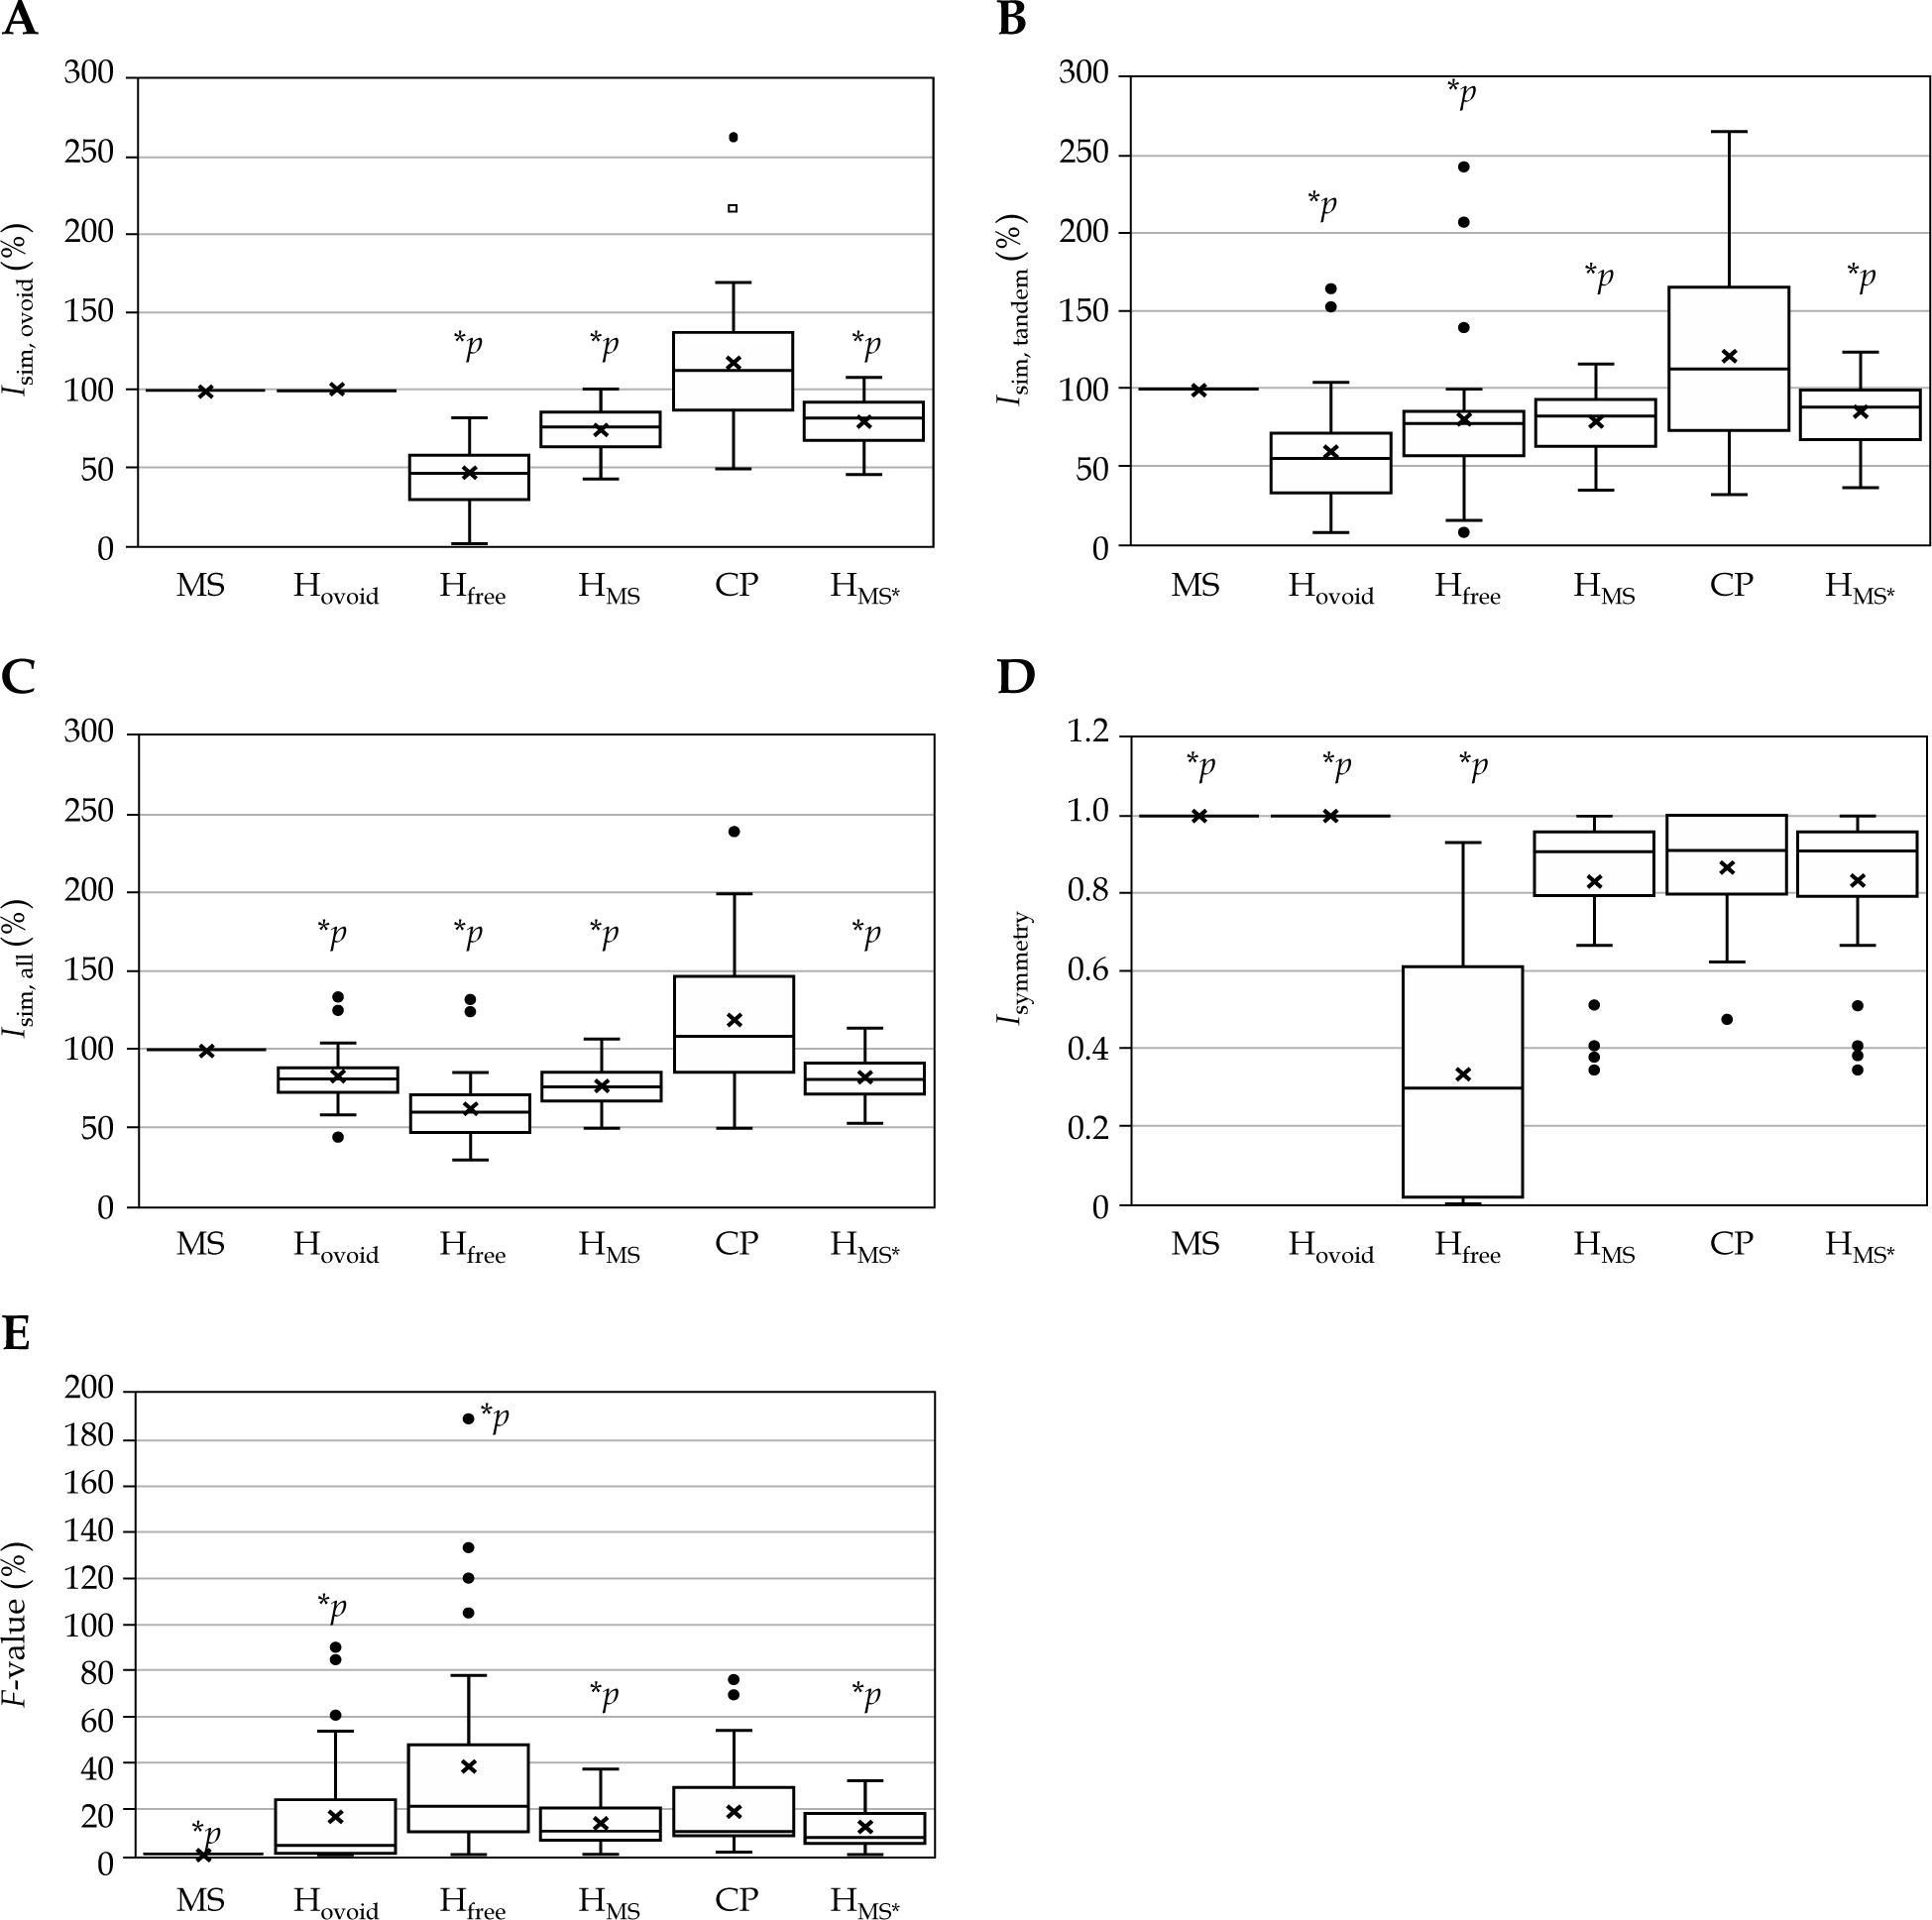
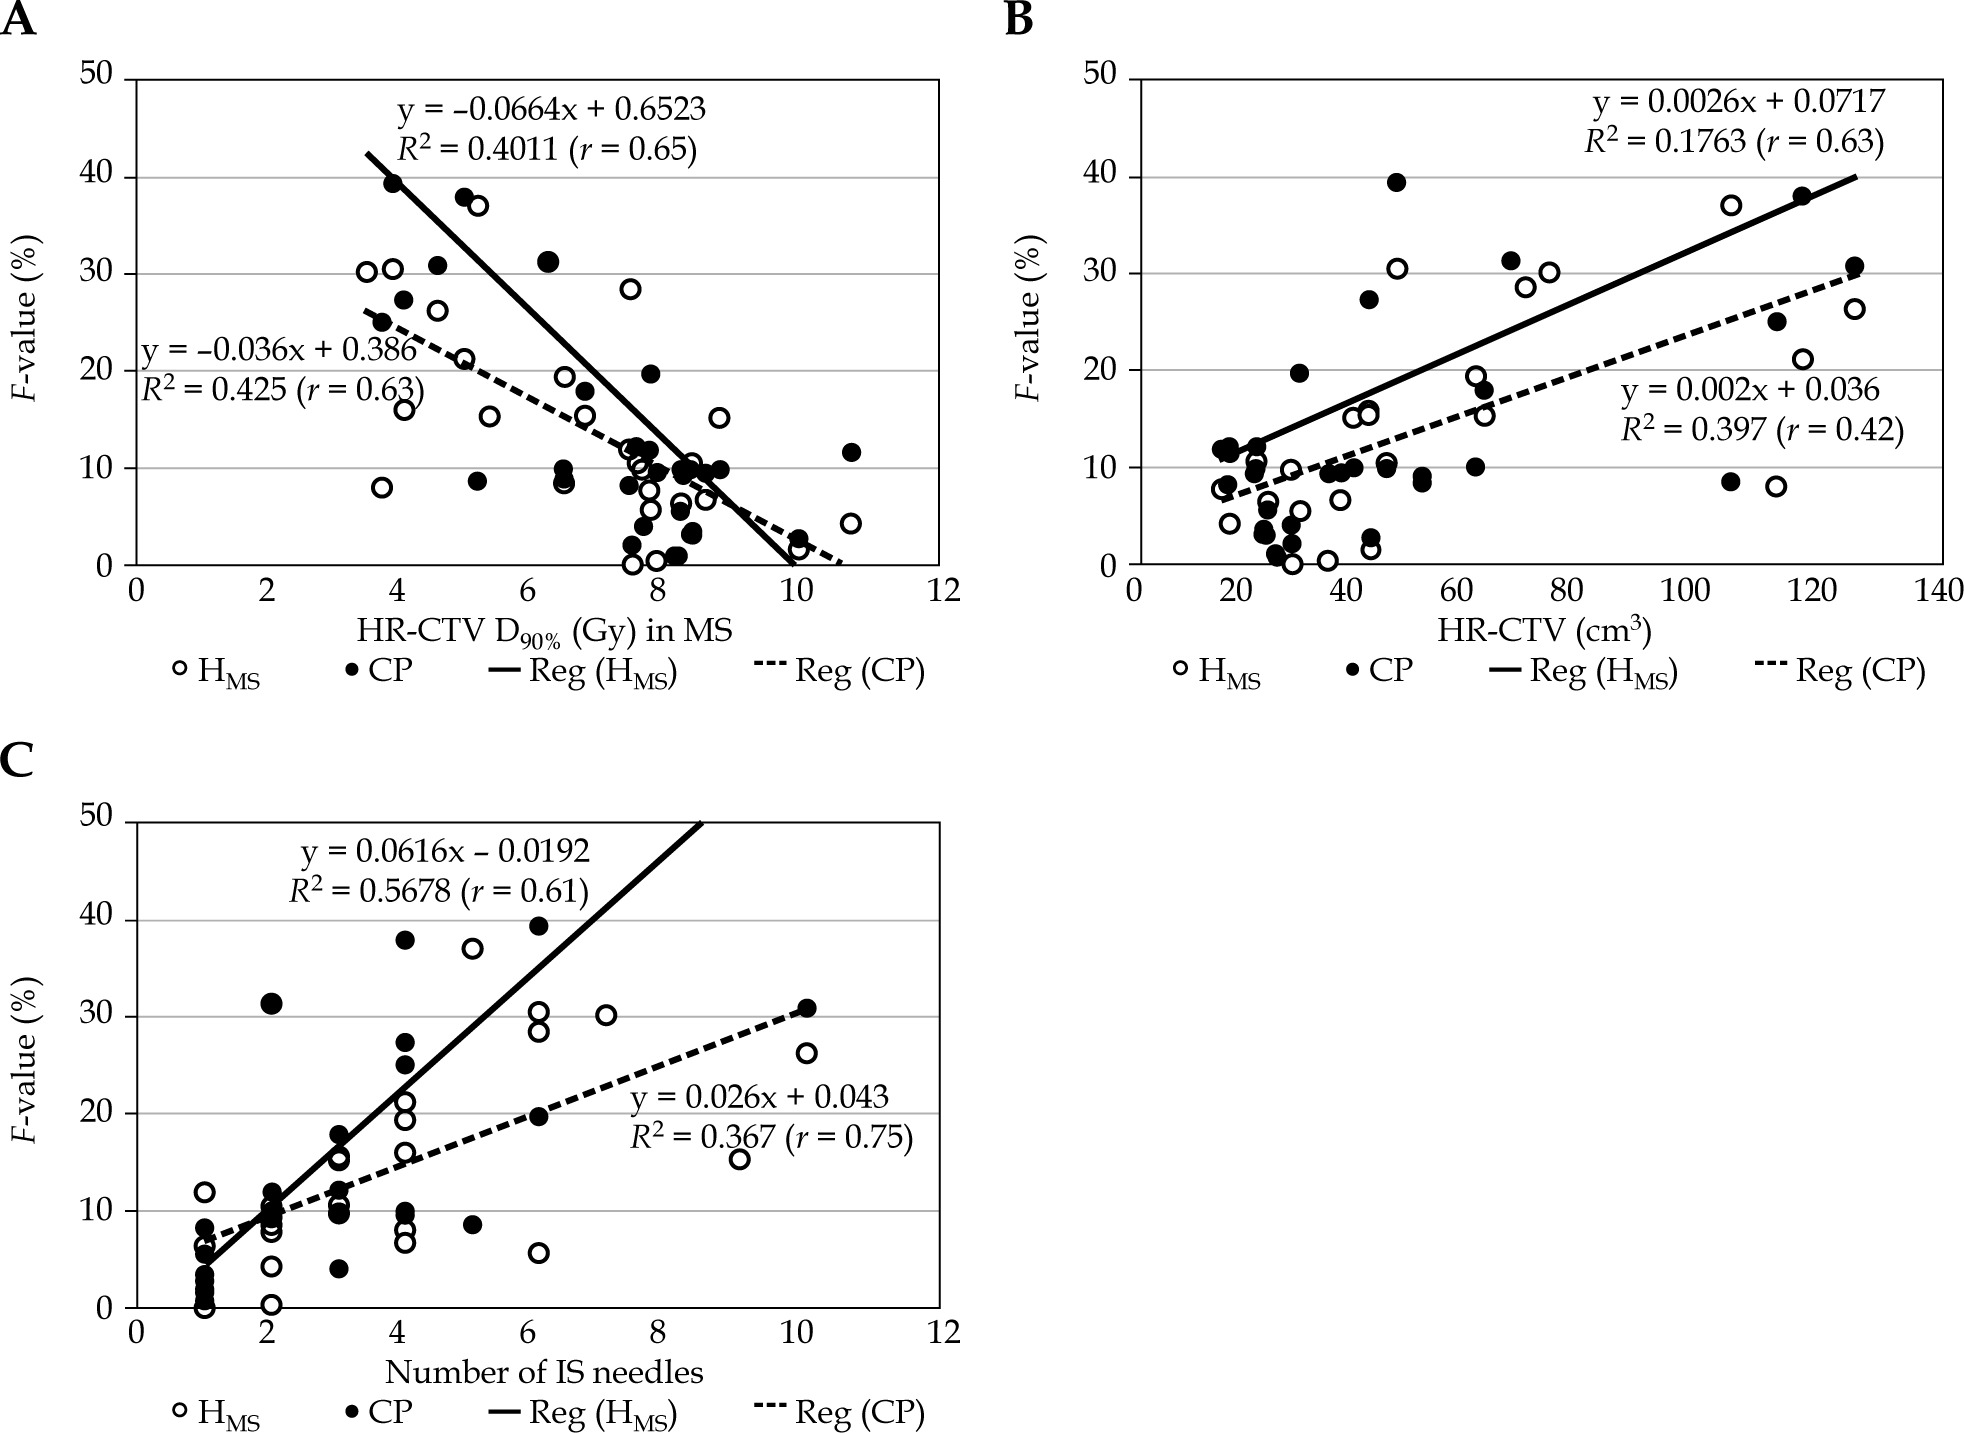
Figure 6A-C illustrates the similarity indices used to evaluate consistency with the pear-shaped dose distributions (MS plan), Isim, ovoid, Isim, tandem, and Isim, all. Hovoid exhibited 100% of Isim, ovoid because the same dwell times as those of the MS plan were used. Hfree showed the lowest Isim, ovoid, with one case presenting zero dose contribution from the ovoids. Notably, considerable variations in Isim, tandem were observed even for the CP, whereas most HIPO plans demonstrated only small variation, which is of interest. Figure 6D shows the symmetry index for the right and left ovoid applicators. In the MS and Hovoid, Isymmetry was in unity, as the dwell times at the ovoids were not optimized. In contrast, Hfree tended to exhibit shorter dwell times at one or the other ovoid, resulting in greater Isymmetry variation. Results in HMS and HMS* demonstrate that the similarity indices at the respective ovoid and tandem applicator were closer to 1.0, and the dose contributions from both ovoids were also symmetric. Therefore, the dose distributions in HMS and HMS* resembled the characteristic pear-shaped pattern. Figure 6E demonstrates the index F ratio between the total dwell time at IS needles and the total dwell time. The median F-values for Hovoid, Hfree, HMS, CP, and HMS* were 3.7%, 20.7%, 10.4%, 9.9%, and 7.6%, respectively. At the individual patient level, a substantial number of cases exhibited F-values ≥ 20%. Among the 29 cases analyzed, the number (percentage) of deviation cases for Hovoid, Hfree, HMS, CP, and HMS* were 8 (28%), 15 (52%), 7 (24%), 9 (31%), and 6 (21%), respectively, with Hfree demonstrating the highest F-value. The role of HIPO to increase dwell times at IS needles in cases where the dose coverage to HR-CTV is inadequate, means that the MS also shows inadequate dose coverage. Therefore, relationships between HR-CTV D90% in the MS, HR-CTV (cm3), and F-value for the HMS and CP were examined, as demonstrated in Figure 7. A higher F-value were observed in decreasing HR-CTV D90% in the MS and larger HR-CTV (cm3). The correlation coefficients r between HR-CTV D90% in the MS and F-value for the HMS and CP were 0.65 and 0.63, respectively. As for HR-CTV (cm3), those for the HMS and CP were 0.63 and 0.42, respectively. In addition, a large number of IS needles cases also indicated a higher F-value (Figure 7C). The correlation coefficients r between them for the HMS and CP were 0.61 and 0.75, respectively. Figure 8 illustrates two representative cases, indicating inadequate dose coverage on either ovoid side in Hfree, which would be deemed clinically unacceptable.
Fig. 6
Similarity indices for the intracavitary applicator A) Isim, ovoid, B) Isim, tandem, and C) Isim, all. D) Symmetry index for the right and left ovoid applicators, Isymmetry. E) Proportion of dwell times at interstitial needles
* p < 0.05 (reference = CP)
Discussion
As described for the conventional IC/IS method, the predetermined activation patterns and weights of the dwell times are generally applied to the intracavitary applicators. Subsequently, given a pear-shaped dose distribution, they are modified by adding a shorter dwell times to the IS needles or by slightly adjusting the dose distribution to achieve dose coverage to the target and dose reduction in OARs. However, all procedures are manually administered, time-consuming, and prone to human error. Moreover, variations in planning remain a major issue. Thus, IP is expected to reduce planning time and inter-planner variability in planning, possibly leading to improvements in the quality of standardized IC/IS treatment plans. For instance, Oud et al. introduced a fully automated, GPU-based, multi-criterial optimization engine that outputs an adaptive plan in approximately 20 seconds. This approach increased EMBRACE II study’s compliance for total doses (EQD2 ≥ 90 Gy) from 56% to 88% while simultaneously reducing OARs doses [40]. Bélanger et al. proposed a combination of GPU-based multi-criteria optimization algorithm, with a sparse catheter optimization algorithm for the Venezia applicator. Their plans demonstrated a significant increase in plan quality, increasing up to 32.8% in the EMBRACE II soft constraint acceptance rate compared with CP [41]. Sharma et al. introduced a two-step re-optimization approach, which adds a structure generated from the prescription isodose line in the second step. This method reduced the D2cm3 to the sigmoid, bladder, and rectum by an average of 37%, 28%, and 27%, respectively, while maintaining HR-CTV D90% [42]. Several studies have also introduced dummy structures to preserve the conventional pear-shaped dose distribution. Dohlmar et al. showed that adding just two semi-automated pseudo-structures enables recreation of the pear-shaped dose distribution with smooth dwell-time patterns [25]. Similarly, Jamema et al. demonstrated that adding help structures (5 mm-thick structures were contoured around each tandem, ovoid/ring, and IS needle) in the optimization can reduce the dwell time contribution from IS needles [26]. In this study, we propose a novel semi-automatic HIPO inverse planning approach, which maintains the conventional pear-shaped dose distribution, preserves HR-CTV dose coverage, and reduces OARs doses, without relying on dummy contours. In addition, we identified dose distribution patterns, which are clinically unacceptable under certain optimization conditions in HIPO.
Previous reports have shown that IP can markedly shorten the planning workflow. Jamema et al. documented that IPSA reduced manual planning times from 15-20 min to approximately 10 min [26], whereas Fröhlich et al. reported an approximately 40% reduction in the overall planning time when HIPO was used instead of forward optimization across three tumor sites [24]. In the present study, we did not systematically record planning times, and our semi-automatic workflow still requires manual creation of the MS dose distribution. Consequently, we do not anticipate time savings of the magnitude reported for fully automated optimization, where the entire dose distribution is generated by the optimization process. Rather, our proposed method is intended to reduce inter-planner variability and to preserve the conventional pear-shaped dose with minimal additional effort.
In the statistical evaluation of DVH parameters (Figures 3 and 4), it was difficult to identify clear trends for each HIPO plan, and no consistent patterns were observed. This is because, in the actual clinical practice, graphical optimization and manual adjustment of dose distribution and dwell times are routinely performed at the final stage to further improve the dose distribution. However, since no such fine adjustments were made for the HIPO plans, it is practically impossible for the optimization alone to fully reproduce the dose distribution of CP. Some cases exhibited abnormally high OARs doses, or required further improvement in HR-CTV dose coverage (see the outliers in Figures 3 and 4). Even in the HIPO plans, dose distribution adjustments similar to those performed in the CP are essential.
Our results demonstrate the dosimetric characteristics of various fixation applicators, regarded as a function of HIPO. Moreover, they show that Hovoid can maintain the same dose contributions at the right and left ovoid applicators as those in the MS plans. However, these plans exhibited slightly higher doses at the rectum, since the dwell times at the ovoid applicator near the rectum were not optimized. The median D2cm3 in the rectum for Hovoid was 3.8 Gy, and those for Hfree, HMS, CP, and HMS* were 3.1, 3.2, 3.5, and 3.4 Gy, respectively. The MS showed the highest median value of 4.0 Gy. On the other hand, the DVH parameters for the rectum in Hfree were lower than those in the other plans (Figures 3C, 4C, D, Table 5). A similar trend was observed for the bladder in Hfree (Figures 3D, 4E, F, Table 5). Furthermore, no deterioration of the dose coverage for HR-CTV in Hfree was observed (Figures 3A, 4A, B, Table 5), and the Hfree plan quality might be excellent in terms of DVH parameters. However, Figure 8 shows two example cases indicating inadequate dose coverage on either ovoid side in Hfree, which may be clinically unacceptable, as it cannot effectively cover potential microscopic vaginal tumor extension. Additionally, given that the dose shape is completely different from the conventional pear-shaped dose distributions, some cases do not use the ovoid for contributing doses to the tumor (see lower value of Isim, ovoid and Isymmetry shown in Figure 6). HMS or HMS* were demonstrated to be feasible and realistic, allowing semi-automatic generation of the optimized dose distributions without significantly disrupting the original pear-shape as seen with the MS plan. It is possible to safely switch to the new method and to prevent clinically unacceptable dose distribution, such as zero dose contribution at the ovoid applicators.
As presented in Table 5 and Supplementary Figure 2, in the EBRT technique using WP only, the median dose of HR-CTV D90% for Hovoid, Hfree, HMS, and HMS* was 83.5, 85.4, 84.1, and 86.8 Gy, respectively, whereas the CP was 88.4 Gy. HMS* with revised optimization parameters could improve the dose coverage to the target. Although no statistically significant difference in HR-CTV D90% between the CP and HMS* was observed, there was a slightly lower total EQD2 in HR-CTV for HMS*. For the OARs, the compliance rates were higher compared with the CP, except for Hovoid plans. It should be emphasized again that the HIPO results presented in the current study reflect only the output of the optimization algorithm without any manual dose adjustments by manual or graphical optimization. Thus, it is anticipated that compliance rates could further improve if dose distributions were manually adjusted. In the EBRT technique using WP + CS, the median dose of HR-CTV D90% for Hovoid, Hfree, HMS, and HMS* was 77.1, 78.1, 76.3, and 79.3 Gy, respectively, while the CP showed 79.4 Gy. HMS and HMS* plans, except for the MS, exceeded the criterion of > 70 Gy in the WP + CS technique [37]. Similarly, HMS* with the revised optimization parameters could improve the dose coverage to the target without a significantly increased dose at OARs. No statistically significant difference for HR-CTV D90% between the CP and HMS* was observed.
HMS* was incorporated to enable a systematic, cohort-wide assessment of how changes in optimization parameters affect dose distributions. Selecting appropriate parameters for optimization algorithms can be challenging. However, for brachytherapy, the process is conceptually simpler than for external-beam radiotherapy, as it largely involves iterative trial-and-error adjustments of parameters until a clinically accepted dose distribution is reproduced. Closing this gap at the parameter-selection stage can reduce the subsequent workload of adjusting dose distribution using manual or graphical optimization. Accordingly, HMS* was introduced to verify whether tuning the nominal-dose parameters used in HMS could yield an improved dose distribution. When optimization-based planning is implemented clinically, these parameters should be refined through systematic comparison with clinically accepted reference plans to streamline the overall workflow.
In terms of the possible advantages of introducing IP, one of the main benefits is a well-balanced dose distribution with minimal inter-planner variation and ability to systematically adjust dose distributions, as demonstrated in HMS*. In the single BT plan, the median dose of HR-CTV D90% for HMS and HMS* was 6.7 and 7.1 Gy, respectively, and the incremental median D90% of HMS* from HMS was 0.4 Gy, corresponding to an increment parameter of approximately 0.4 Gy (from 6.0 to 6.4 Gy in Table 4). Similarly, the median V100% improved by 1.4%, increasing from 97.1% to 98.5%, and an even greater improvement was observed in the mean value: increasing from 95.7% to 97.4%. This suggests the possibility of improving treatment efficacy on a patient-by-patient basis through the assessment of tumor response. Moreover, the modified MS dose distribution used in HMS or HMS* plans was generated using graphical optimization, enabling safe reductions in OARs doses, with high flexibility for all cases.
As for the limitations of this study, we examined the planning study only for the first-fraction treatment plans in most patients, and assumed that the same results would apply to all fractions when evaluating the total treatment plan for dosimetric assessment in the entire course. All patients were injected with the spacer; therefore, OARs doses were lower even for the MS plans (Figures 3 and 4). Moreover, after optimization, the minor modifications to the dose distribution by graphical or manual optimization, which are commonly performed in clinical practice, were not permitted in this study. Consequently, the dose distribution is expected to be further improved beyond what was achieved here. This study was a retrospective planning study, and our proposed method has not yet been introduced into clinical practice. Therefore, it remains unclear how much time could be reduced by introducing the inverse planning. Unfortunately, our method requires manual preparation of the modified MS, and it is not possible to dramatically shorten the procedure time during planning. From our planning study in some test cases, it takes approximately 5 to 10 min to produce the expected dose distributions, allowing us to carefully adjust the dose distribution using graphical or manual optimization.
Conclusions
The current study investigated the consistency of HIPO with conventional techniques, such as the pear-shaped dose distribution. New indices, similar to the MS, and the symmetry of dose contribution at both sides of ovoid applicators were examined. HIPO allows the dwell times at specific applicators to be fixed. We propose using graphical optimization to adjust the MS dose distribution in order to ensure safe doses to OARs, and to apply this modified MS as the fixation object in HIPO. Based on the modified MS, we introduced optimization parameters with the primary objective of improving dose coverage of HR-CTV. The dose distribution and DVH parameters in our proposed method were clinically acceptable, and consistency with the pear-shaped dose distribution was confirmed. When introducing HIPO plans in clinical practice, the consistency of target dose coverages and OARs doses in HIPO plans with those of conventional plans, should be verified. For this purpose, HIPO plans can systematically adjust the dose distribution by modifying optimization parameters.


