
Introduction
Breast cancer (BC) is the most frequent malignancy in women worldwide, and advanced breast cancer is considered incurable, leading to high mortality [1]. In the USA alone, 276,480 cases of BC were diagnosed last year, accounting for 30% of the overall cancer cases in women [2]. Moreover, in spite of having similar tumor characteristics, the post-diagnosis survival rates of BC patients vary greatly [3]. Currently, the immune system is identified as the determinant for cancer genesis and development [4]. Thus, the development of immune-related biomarkers for the prognosis of BC patients is required.
The immune microenvironment (IME) plays an important role in predicting the therapeutic and clinical efficacy of cancer treatments [5, 6]; also, innate and adaptive immune responses are associated with the success of treatments and clinical outcomes [4]. In particular, T-cells and their infiltrating levels are known to influence the survival of BC patients [6]. Previous studies indicated that BCs with higher immune infiltrating degrees have favorable prognostic outcomes [7-10]. Additionally, higher immune infiltrating degree is significantly associated with enhanced adjuvant or neoadjuvant chemotherapy (NACT) response [11]. These results suggest that it would be promising to apply immune prognostic characteristics in BC. Therefore, analyzing immune-related genes (IRGs) with the prognostic outcome will lead to the development of effective anti-BC treatment strategies.
The single-sample gene set enrichment analysis (ssGSEA) method is an extension of the GSEA method, working at the level of a single sample rather than a sample population as in the original GSEA application. The score derived from ssGSEA reflects the degree to which the input gene signature is coordinated within a sample [12]. The Lasso regression tries to minimize the gap between the target feature and the linear combination of the other features with the coefficient vector. This means that once the model has been accurately trained, fewer data are needed to evaluate the model [13]. So the ssGSEA was adopted in this study for grouping BC cases into low, moderate, and high immune infiltrating clusters, which were verified by the ESTIMATE and CIBERSORT computational methods. Differentially expressed genes (DEGs) were identified in tumor vs. normal and high vs. low immune infiltration clusters; 19 immune-associated genes with prognostic value were selected and verified by LASSO and univariate Cox analyses. Additionally, we evaluated the credibility of IRG-based prognostic features by the nomogram. Finally, protein-protein interactions (PPI) were screened, and three significant genes were selected.
Material and methods
Data collection and clustering
This study obtained The Cancer Genome Atlas (TCGA)- BRCA dataset with the corresponding complete clinical data by utilizing the R software (Version 4.1.1) TCGA- Assembler package (Version 2.0.6) [14]. The data collected corresponded to 1,102 tumor samples and 113 normal breast tissues. The ssGSEA was performed on 1,102 BC samples, and they were subsequently grouped into low, moderate, and high immune infiltrating clusters by utilizing the R software “sparcl” package.
Validation of the immune cluster
Estimation of stromal and immune cells in malignant tumors using expression data (ESTIMATE) is a method adopted to infer the fraction of stromal and immune cells in tumor samples [15]. Thus, the ESTIMATE method was used to calculate the stromal, immune, and ESTIMATE scores and the tumor purity of the 1,102 BC samples by the “estimate” package of R software. In order to evaluate the various subtypes of immune cells, we adopted the R software “CIBERSORT” package for calculating the proportions of 22 immune cells within each BC sample according to the gene expression matrix table [16]. Finally, the different levels of expression of PD-1 and HLA families in the three clusters were evaluated using the “ggpubr” package of R software.
Identification of immune-associated genes in breast cancer
The DEGs in tumor vs. normal and high vs. low immune infiltrating clusters were identified using the “DESeq” package of R software. We selected FC ≤ 1/2 or FC ≥ 2.0 and adjusted the p-value of ≤ 0.05 to be the threshold for selecting the DEGs. The same strategy was applied for identifying DEGs in cancer and healthy samples. At last, to carry out further analyses, the intersected DEGs were obtained by Venn online tools (http://bioinformatics.psb.ugent.be/webtools/Venn/).
Gene set enrichment analysis
The R software “clusterprofiler” package was adopted for gene set enrichment analysis (GSEA) between low and high immune infiltrating clusters, whereas the R software “enrichplot” package was utilized for visualization.
Identification and confirmation of immune-associated gene prognostic signature for breast cancer
Univariate Cox regression analysis was performed to distinguish immune-associated genes in BC with detailed clinical information and significance for overall survival (OS) based on results obtained from the R software “survival” package. Thereafter, the R “glmnet” package was utilized for identifying significant genes related to survival from the genes selected by univariate Cox regression analysis. The BC prognosis signature was established based on the results of LASSO regression analysis. Next, we adopted the R software “Survminer” package to define median risk score and classified cases into low-and high-risk groups. Later, we plotted time-dependent receiver operating characteristic (t-ROC) curves and assessed the capacity of our constructed risk score in prognosis prediction based on the survival line by R software “timeROC”, “survminer”, and “survival” packages. Finally, to assess whether our constructed risk score might independently predict the OS of BC patients, we conducted univariate as well as multivariate Cox regression by utilizing the R software “survival” package, with stage, age, and gender being the variables.
Construction and verification of nomogram
The survival of BC patients was predicted using a nomogram, which was constructed based on gender, age, risk score, and stage using the R software “survival” and “rms” packages. The accuracy of the constructed nomogram in distinguishing patients was assessed by plotting the calibration curve.
PPI network construction and hub gene identification
This study employed the STRING database for constructing a PPI network, which was visualized with Cyto- scape software (Version 3.7.0). Later, the CytoHubba plugin was employed to determine the node degree, and the three most significant genes were identified to be the hub genes.
Results
Data collection and clustering
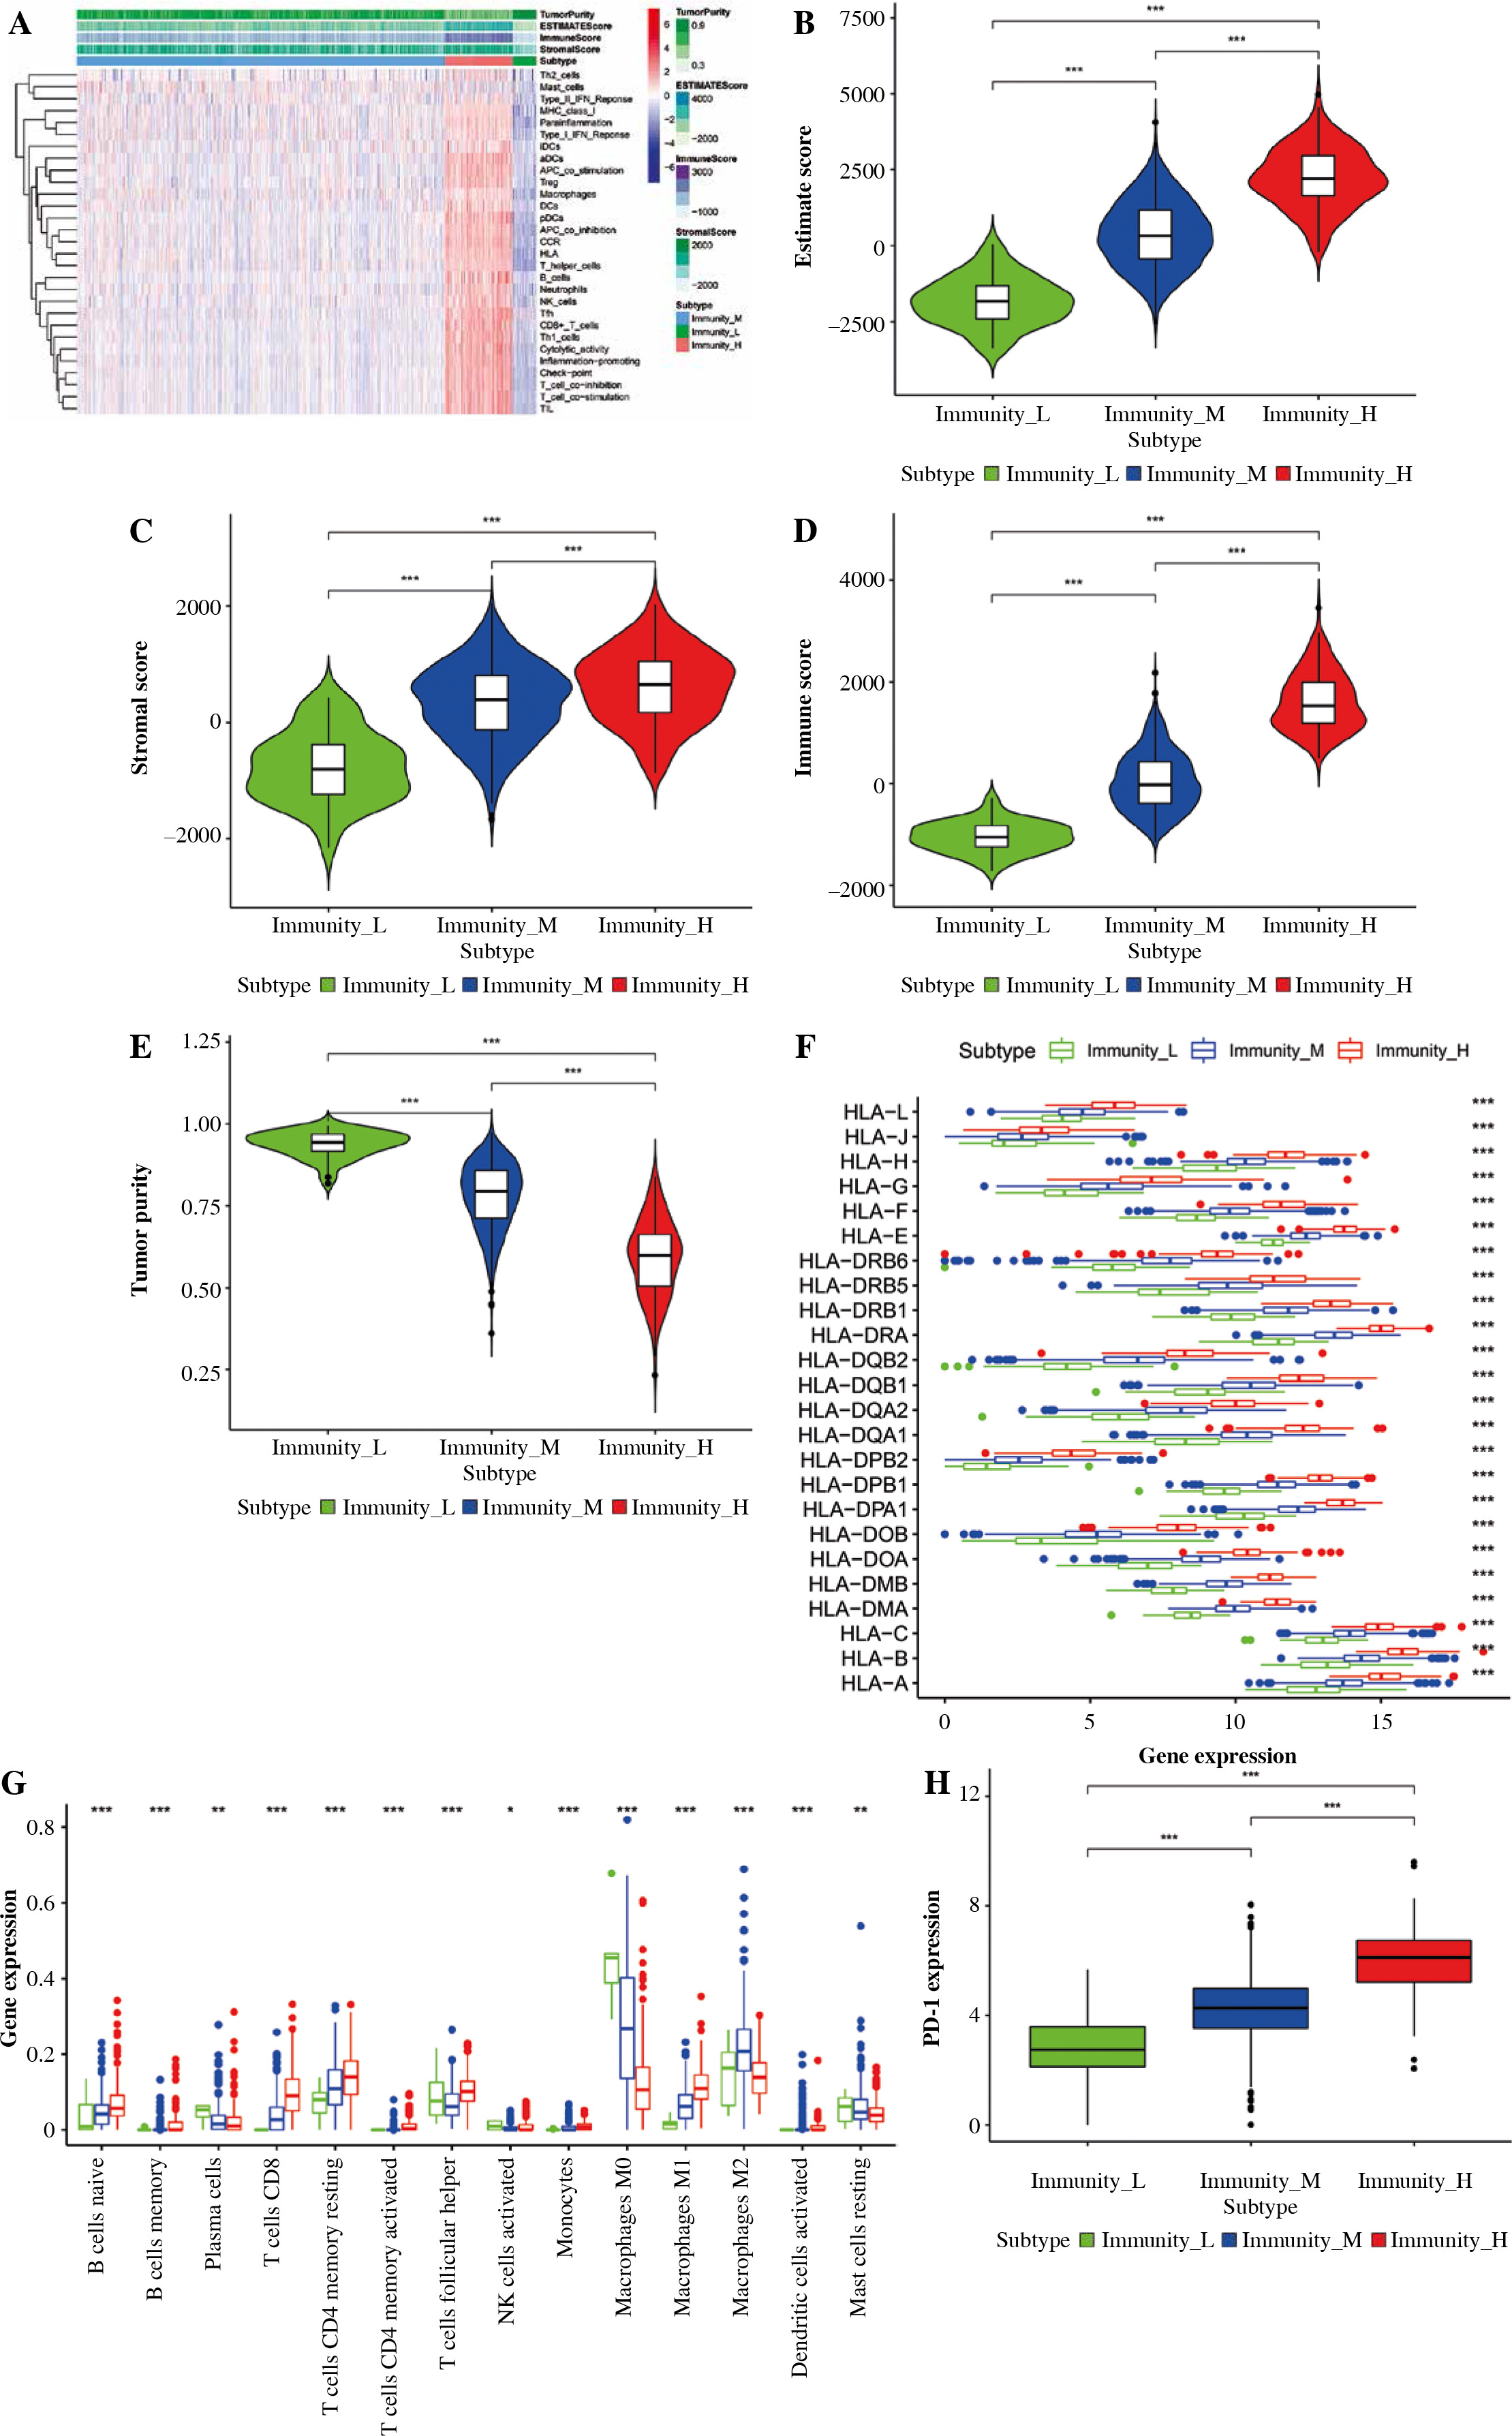
The TCGA-BRCA dataset was downloaded from the TCGA database. The ssGSEA method was utilized for assessing immune infiltrating degrees, and enrichment levels of 29 immune-related cell types in BC tissues were obtained by unsupervised hierarchical clustering. Based on these results, BC samples were classified into three clusters, namely, low, moderate, and high infiltrating clusters (Immunity_H, Immunity_M, and Immunity_L) consisting of 883, 163, and 56 samples, respectively (Fig. 1A). These clusters were verified by employing the ESTIMATE algorithm, which was used to calculate the stromal, immune, and ESTIMATE scores and tumor purity based on the expression levels of mRNA in BC samples. The stromal, ESTIMATE, and immune scores of the high immune infiltrating cluster were higher than those of the other two clusters, whereas tumor purity showed an opposite trend (Fig. 1B-E). On one hand, the highly polymorphic genes of the human leukocyte antigen (HLA) system encode cell surface proteins and the peptide antigens to T lymphocytes triggering immune responses. Specific HLA alloantigens were usually used to select cell, tissue and organ donors, diagnose autoimmune diseases, determine the risk of drug reactions, and guide immunotherapies [17]. On the other hand, B-cells and T-cells are responsible for the generation of long-lasting protective antibody responses and the development of immunological memory following infection [18]; hence, aberrant function at numerous points throughout the B-cell lifecycle can influence their ability to initiate a primary or secondary response [18]. Monocytes and macrophages are also phagocytic cells that are important for the innate response against infection [18]. From the result, the high immune infiltrating cluster exhibited enriched proportions of various immune cell types (Fig. 1G). Additionally, higher expression levels of PD-1 and many HLAs were observed in the low, moderate, and high immune infiltrating clusters (Fig. 1H, I).
Fig. 1
Construction and validation of breast cancer (BC) immune infiltration clustering. A) Enrichment levels of 29 immune-related cells and types in the high immune infiltration group, middle immune infiltration group, and low immune infiltration group. The ESTIMATE Score, Stromal Score, Immune Score, and Tumor Purity of every patient gene are shown combined with the clustering information. B-E) The violin plot shows the difference in ESTIMATE Score, Stromal Score, Immune Score, and Tumor Purity between three clusters. F) The expression of most HLAs showed a significant difference in the high, middle, and low immune infiltration clusters. *p < 0.05, **p < 0.01, ***p < 0.001 G) The boxplot shows the percentage of immune cells among the high, middle, and low immune infiltration clusters using the CIBERSORT algorithm. H) The expression of most HLAs showed a significant difference in high, middle, and low immune infiltration clusters. *p < 0.05, **p < 0.01, ***p < 0.001
Identification of DEGs in tumor vs. normal and high vs. low immune infiltrating clusters of breast cancer
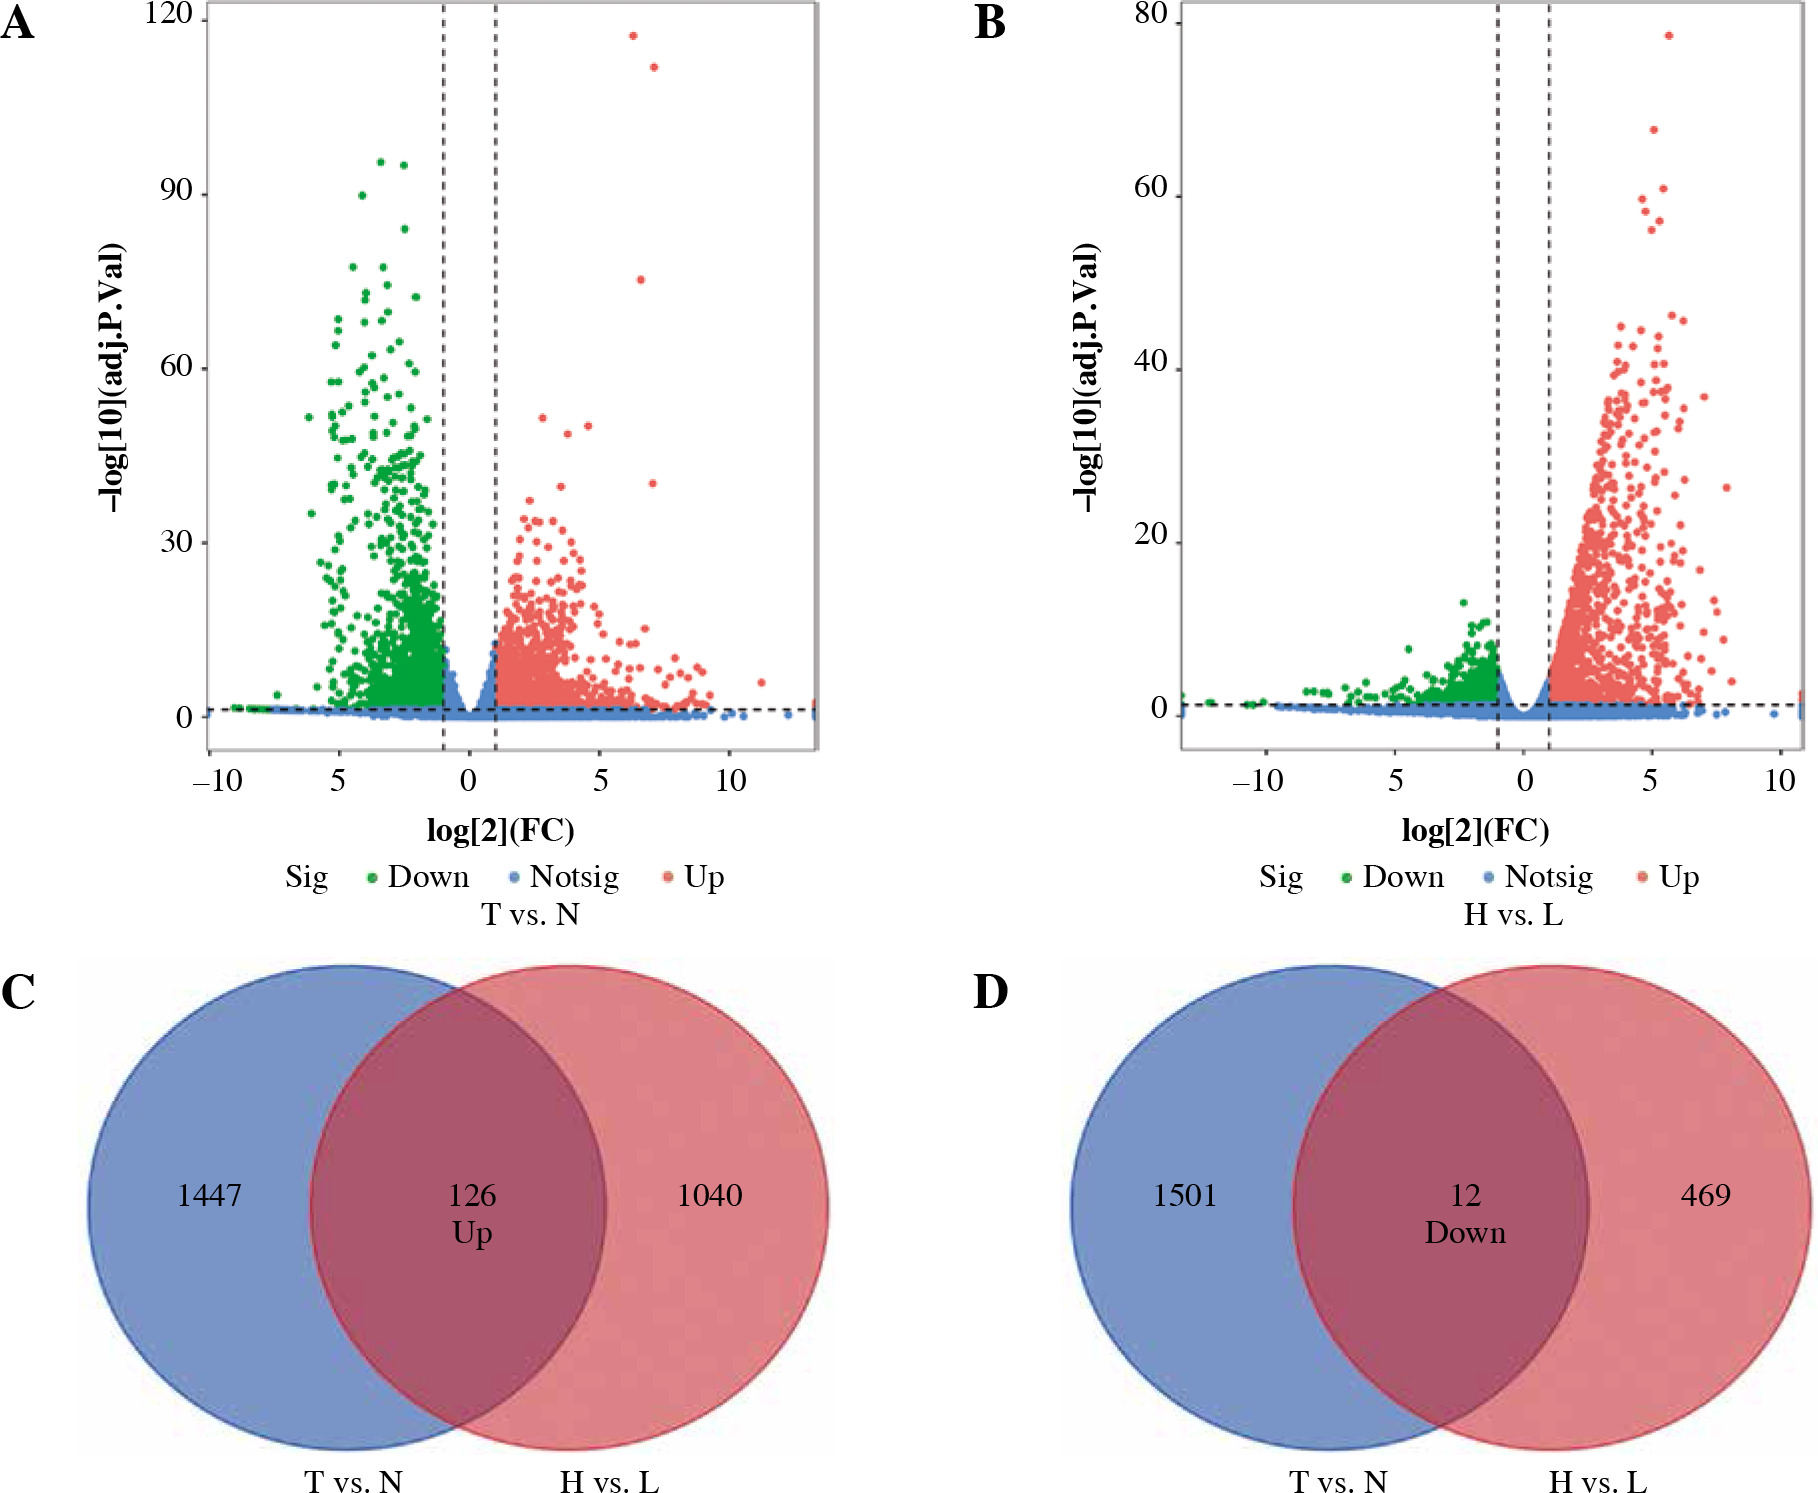
The DEGs between BC (n = 1102) and normal tissues (n = 113) were explored. We obtained 1,573 up-regulated DEGs and 1,513 down-regulated DEGs (Fig. 2A). In addition, adjusted p ≤ 0.05 and FC ≤ 1/2.0 or FC ≥ 2.0 were selected to be the thresholds for selecting the DEGs. The same methods were applied in high (n = 163) and low (n = 56) immune infiltrating groups. Finally, we obtained 126 intersected DEGs with up-regulation and 12 intersected DEGs with down-regulation in tumor vs. normal samples and low vs. high immune infiltrating groups (Fig. 2C, D).
Fig. 2
Identification of differentially expressed genes. A) The volcano plot shows 1573 up-regulated genes and 1513 down-regulated genes between breast cancer (BC) and normal breast tissues (T vs. N). B) The volcano plot shows 1166 up-regulated genes and 581 down-regulated genes between high immune infiltration cluster and low immune infiltration cluster (H vs. L). C, D) Venn diagram of the intersection of DEGs between T vs. N and H vs. L
GSEA enrichment analysis
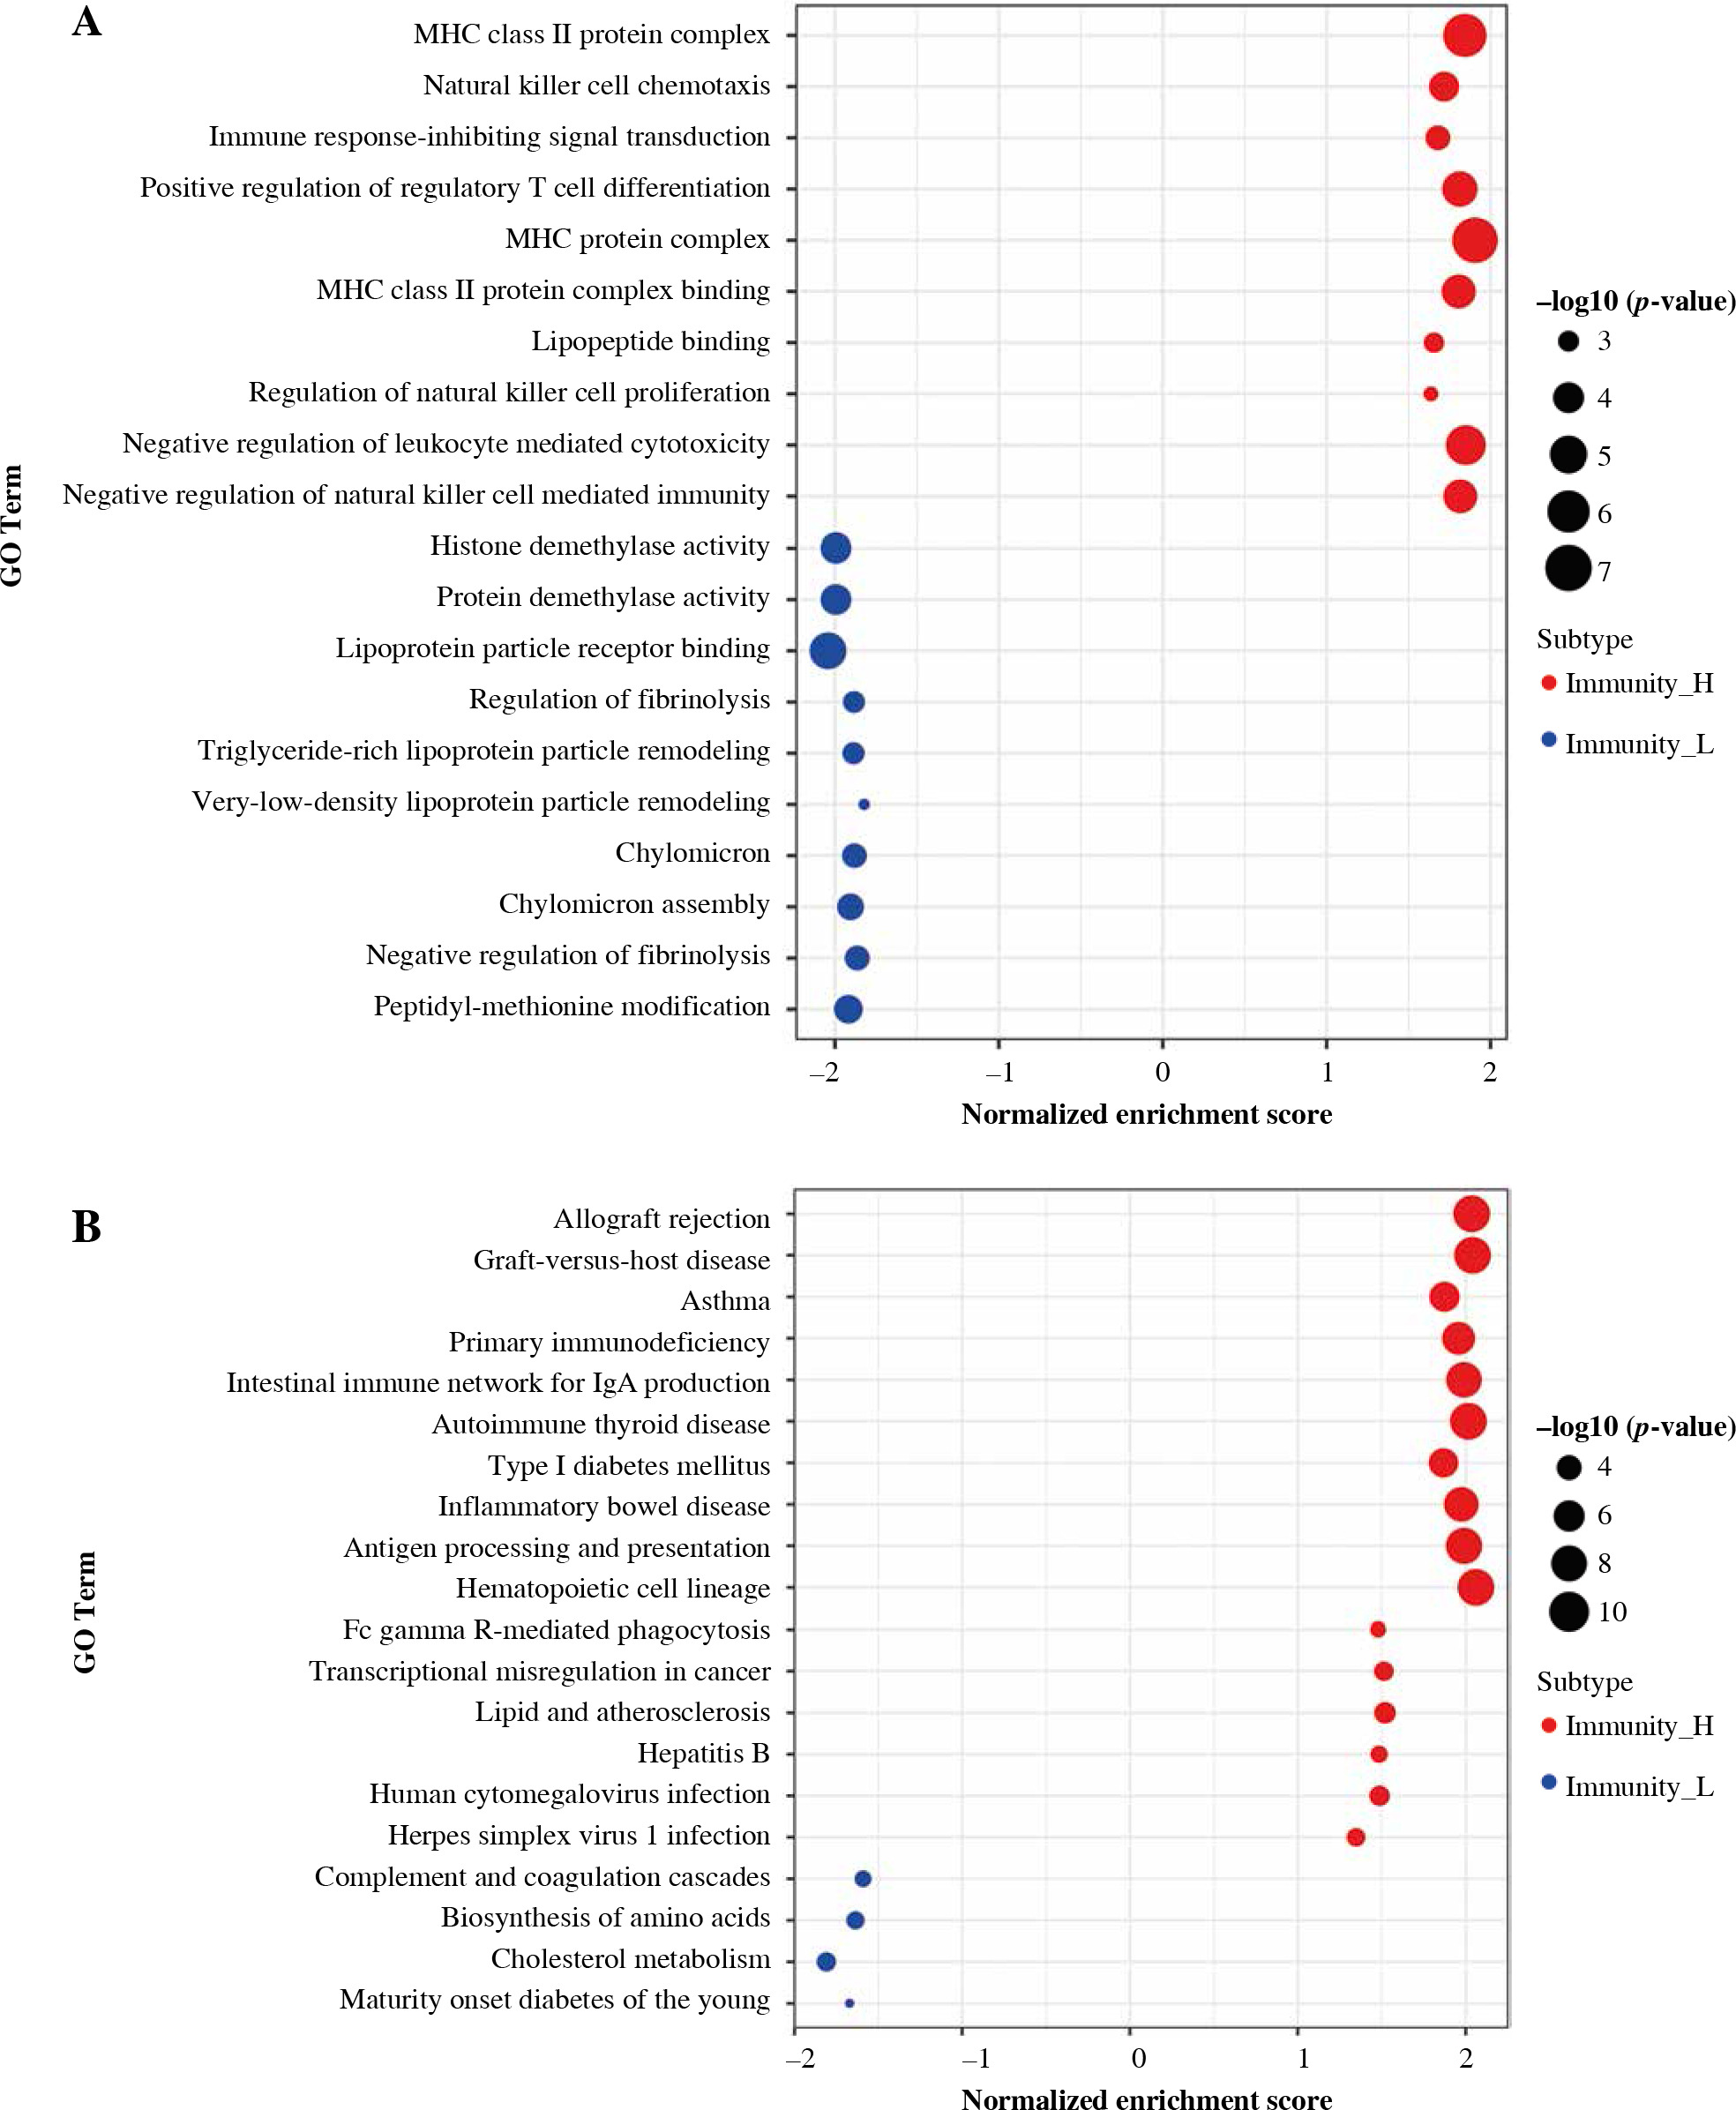
Based on the Gene Ontology (GO) annotation on genes in high and low immune infiltrating clusters, it was observed that these genes are related to MHC class II protein complex, natural killer cell chemotaxis, histone demethylase activity, and protein demethylase activity (Fig. 3A). Based on the Kyoto Encyclopedia of Genes and Genomes (KEGG) pathway enrichment analysis, the genes were observed to be related to allograft rejection, graft-versus-host disease, complement and coagulation cascades, and biosynthesis of amino acids (Fig. 3B).
Identification and evaluation of 19 immune-associated genes’ prognostic features for breast cancer
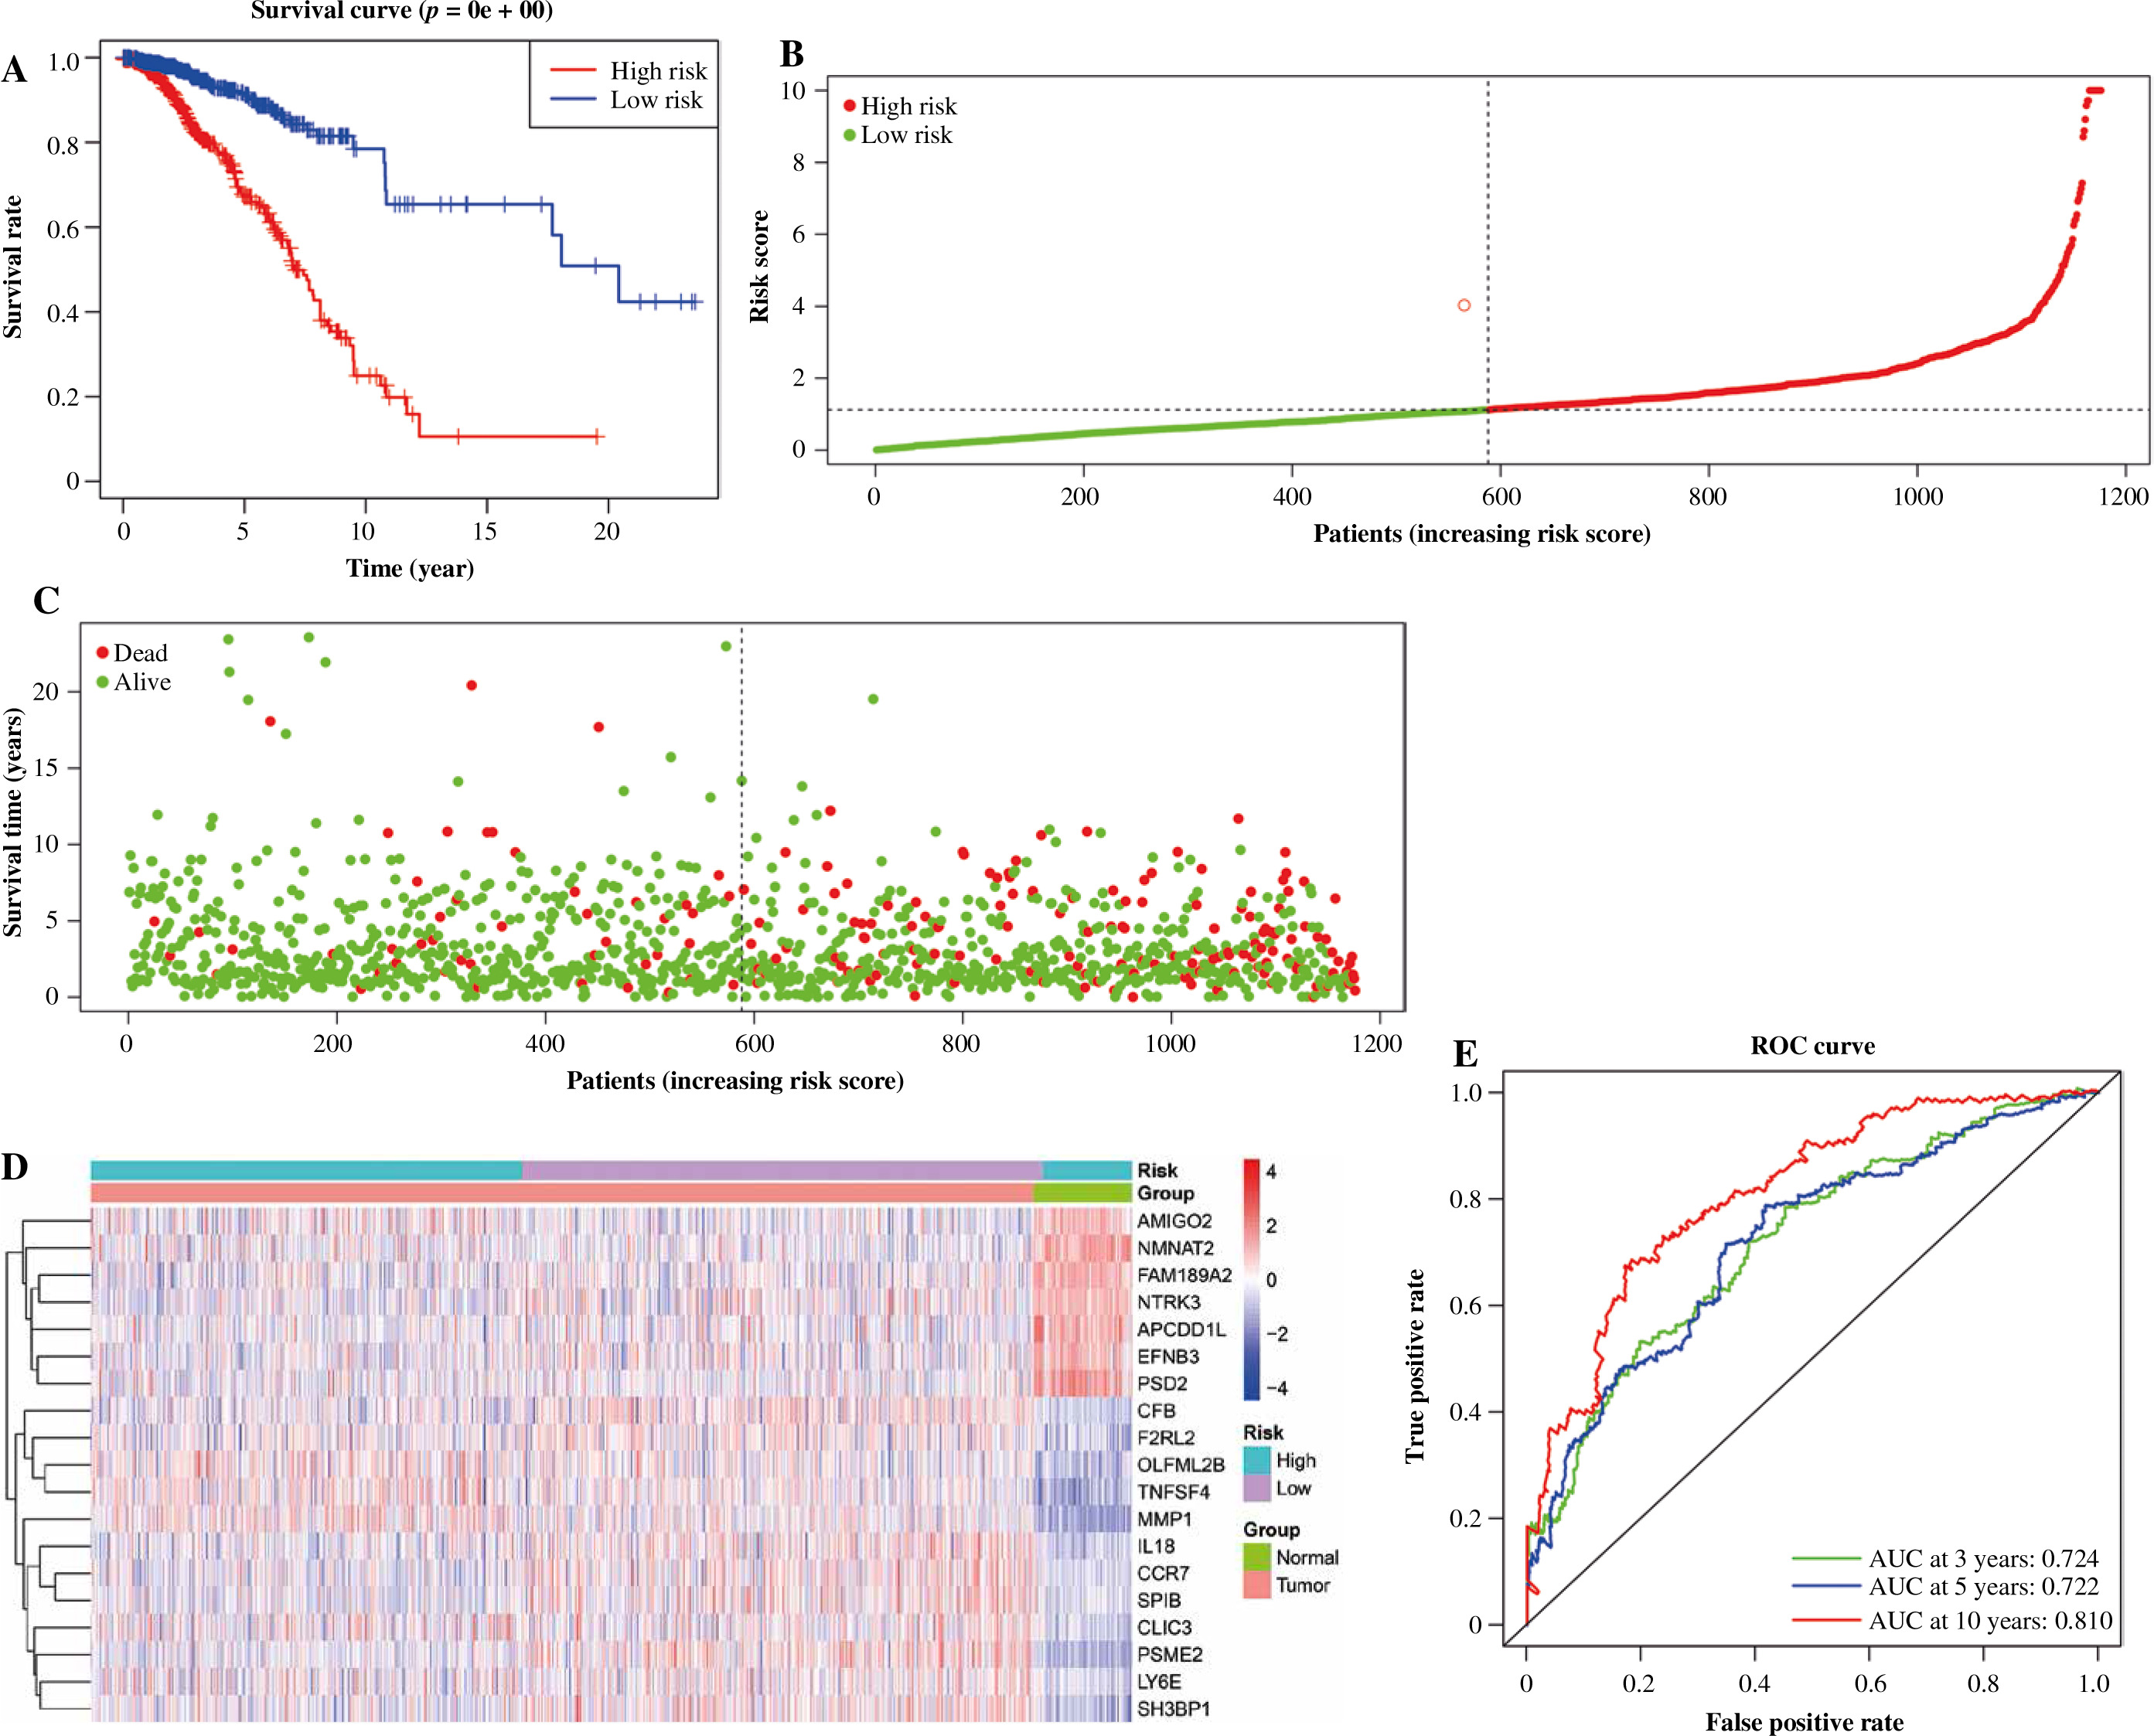
138 overlapped DEGs were analyzed by univariate Cox regression analysis, and it was observed that 68 DEGs were significantly related to OS (p ≤ 0.05) (Fig. 4A). Then, based on the LASSO regression analysis, 19 genes (AMIGO2, APCDD1L, CCR7, CFB, CLIC3, EFNB3, F2RL2, FAM-189A2, IL18, LY6E, MMP1, NMNAT2, NTRK3, OLFML2B, PSD2, PSME2, SH3BP1, SPIB, and TNFSF4) were screened (Fig. 4B, C). Later, the risk score was constructed by incorporating 19 gene levels together with gene coefficients. Based on the median risk score, the samples were classified into high- and low-risk groups. As suggested by Kaplan-Meier curve analysis, the constructed risk score was effective in prognosis because low-risk samples were associated with significantly superior survival as compared to high-risk samples (Fig. 5A). The risk curve and scatter plot showed that low-risk samples had a decreased risk coefficient and death rate compared with high-risk samples (Fig. 5B, C). The relative expression levels of these 19 genes are shown in Figure 5D. Furthermore, t-ROC curves were plotted to evaluate the accuracy of the constructed 19 ARG-based signature in estimating the 3-, 5-, and 10-year OS for BC cases. Moreover, the values falling under the ROC (AUC) curve exhibit the good ability of 19 immune-associated gene features in predicting OS (Fig. 5E).
Fig. 4
Construction of immune-related gene prognostic signature. A) The p-value and HR of selected genes in univariable Cox regression analysis (p < 0.05), and the LASSO Cox analysis identified genes with the highlight. B) The LASSO Cox analysis identified 19 genes associated with prognosis. C) The optimal values of the penalty parameter were defined by 1,000-round crossvalidation
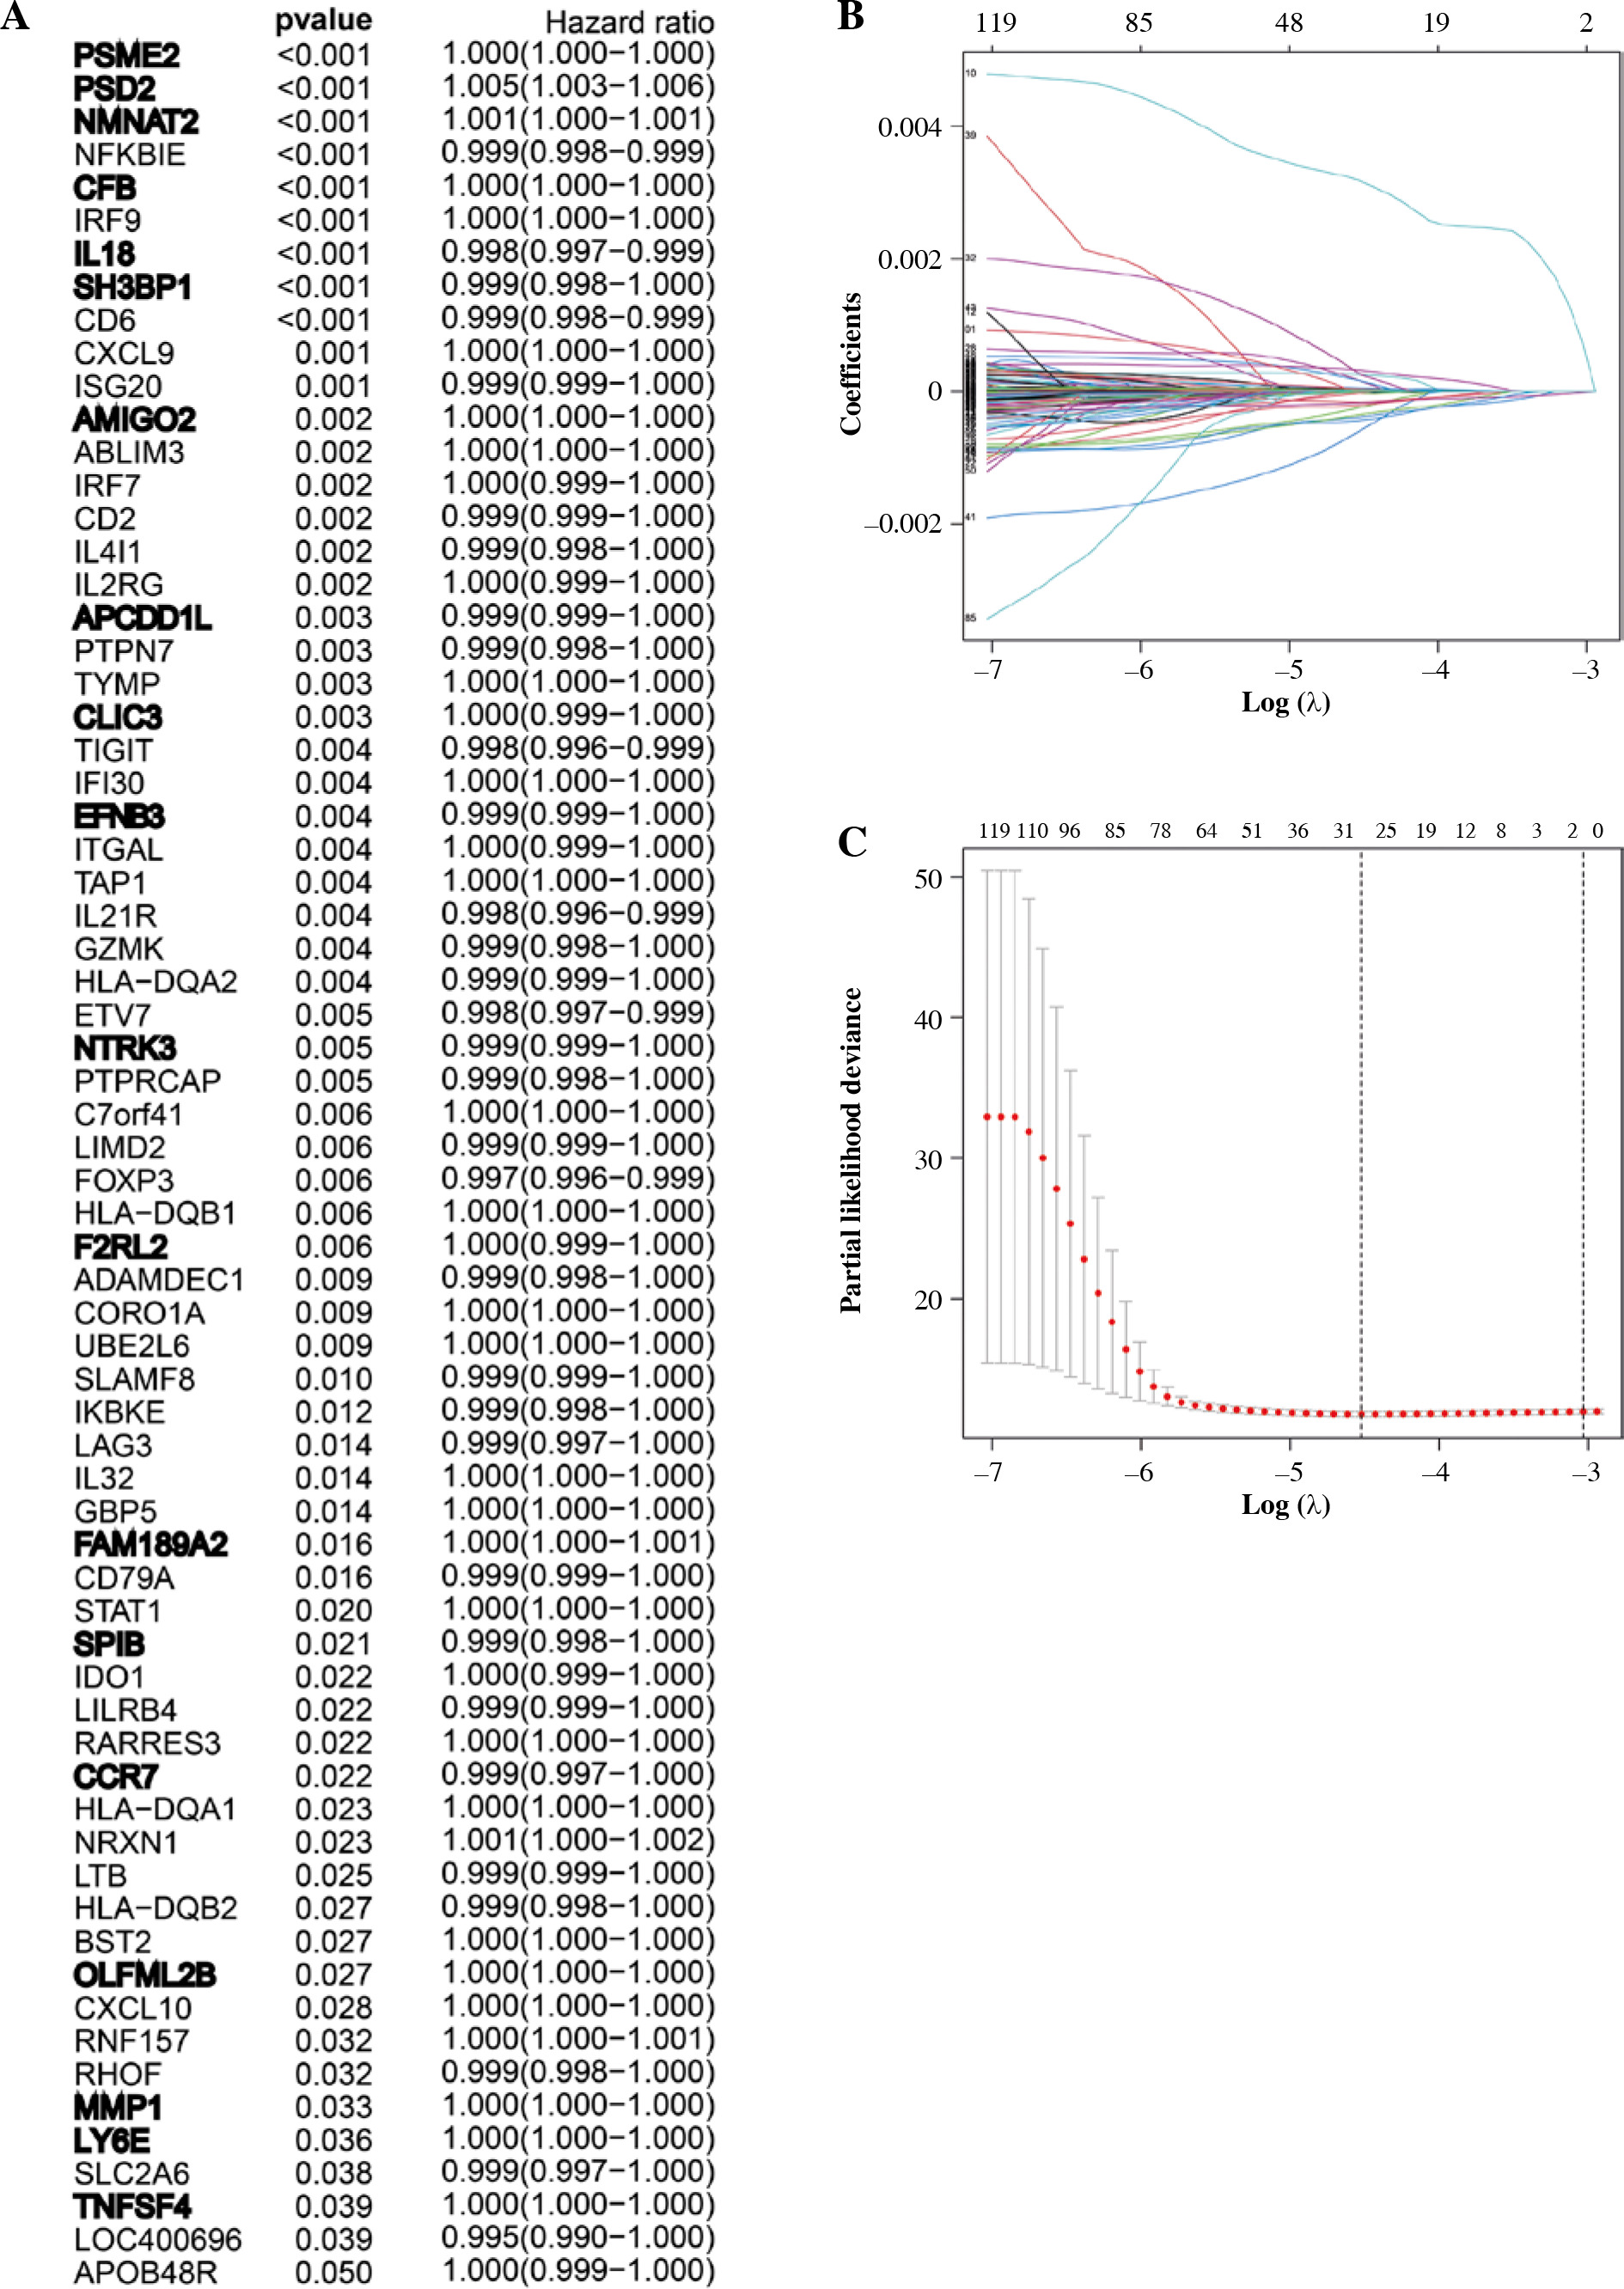
Fig. 5
The prognostic value of 19 immune-related genes. A) Patients in the low-risk group showed better overall survival than those in the high-risk group. B) The risk curve of every sample arranged by risk score. C) The scatter plot of breast cancer (BC) samples survival overview. The red and green dots stand for death and survival, respectively. D) Heatmap showed the expression level of 19 genes in the normal group and BC group. E) The ROC curve for 3-, 5-, and 10-year overall survival of BC patients
Evaluation of 19 immune-related genes’ signature as an independent prognostic factor in breast cancer patients
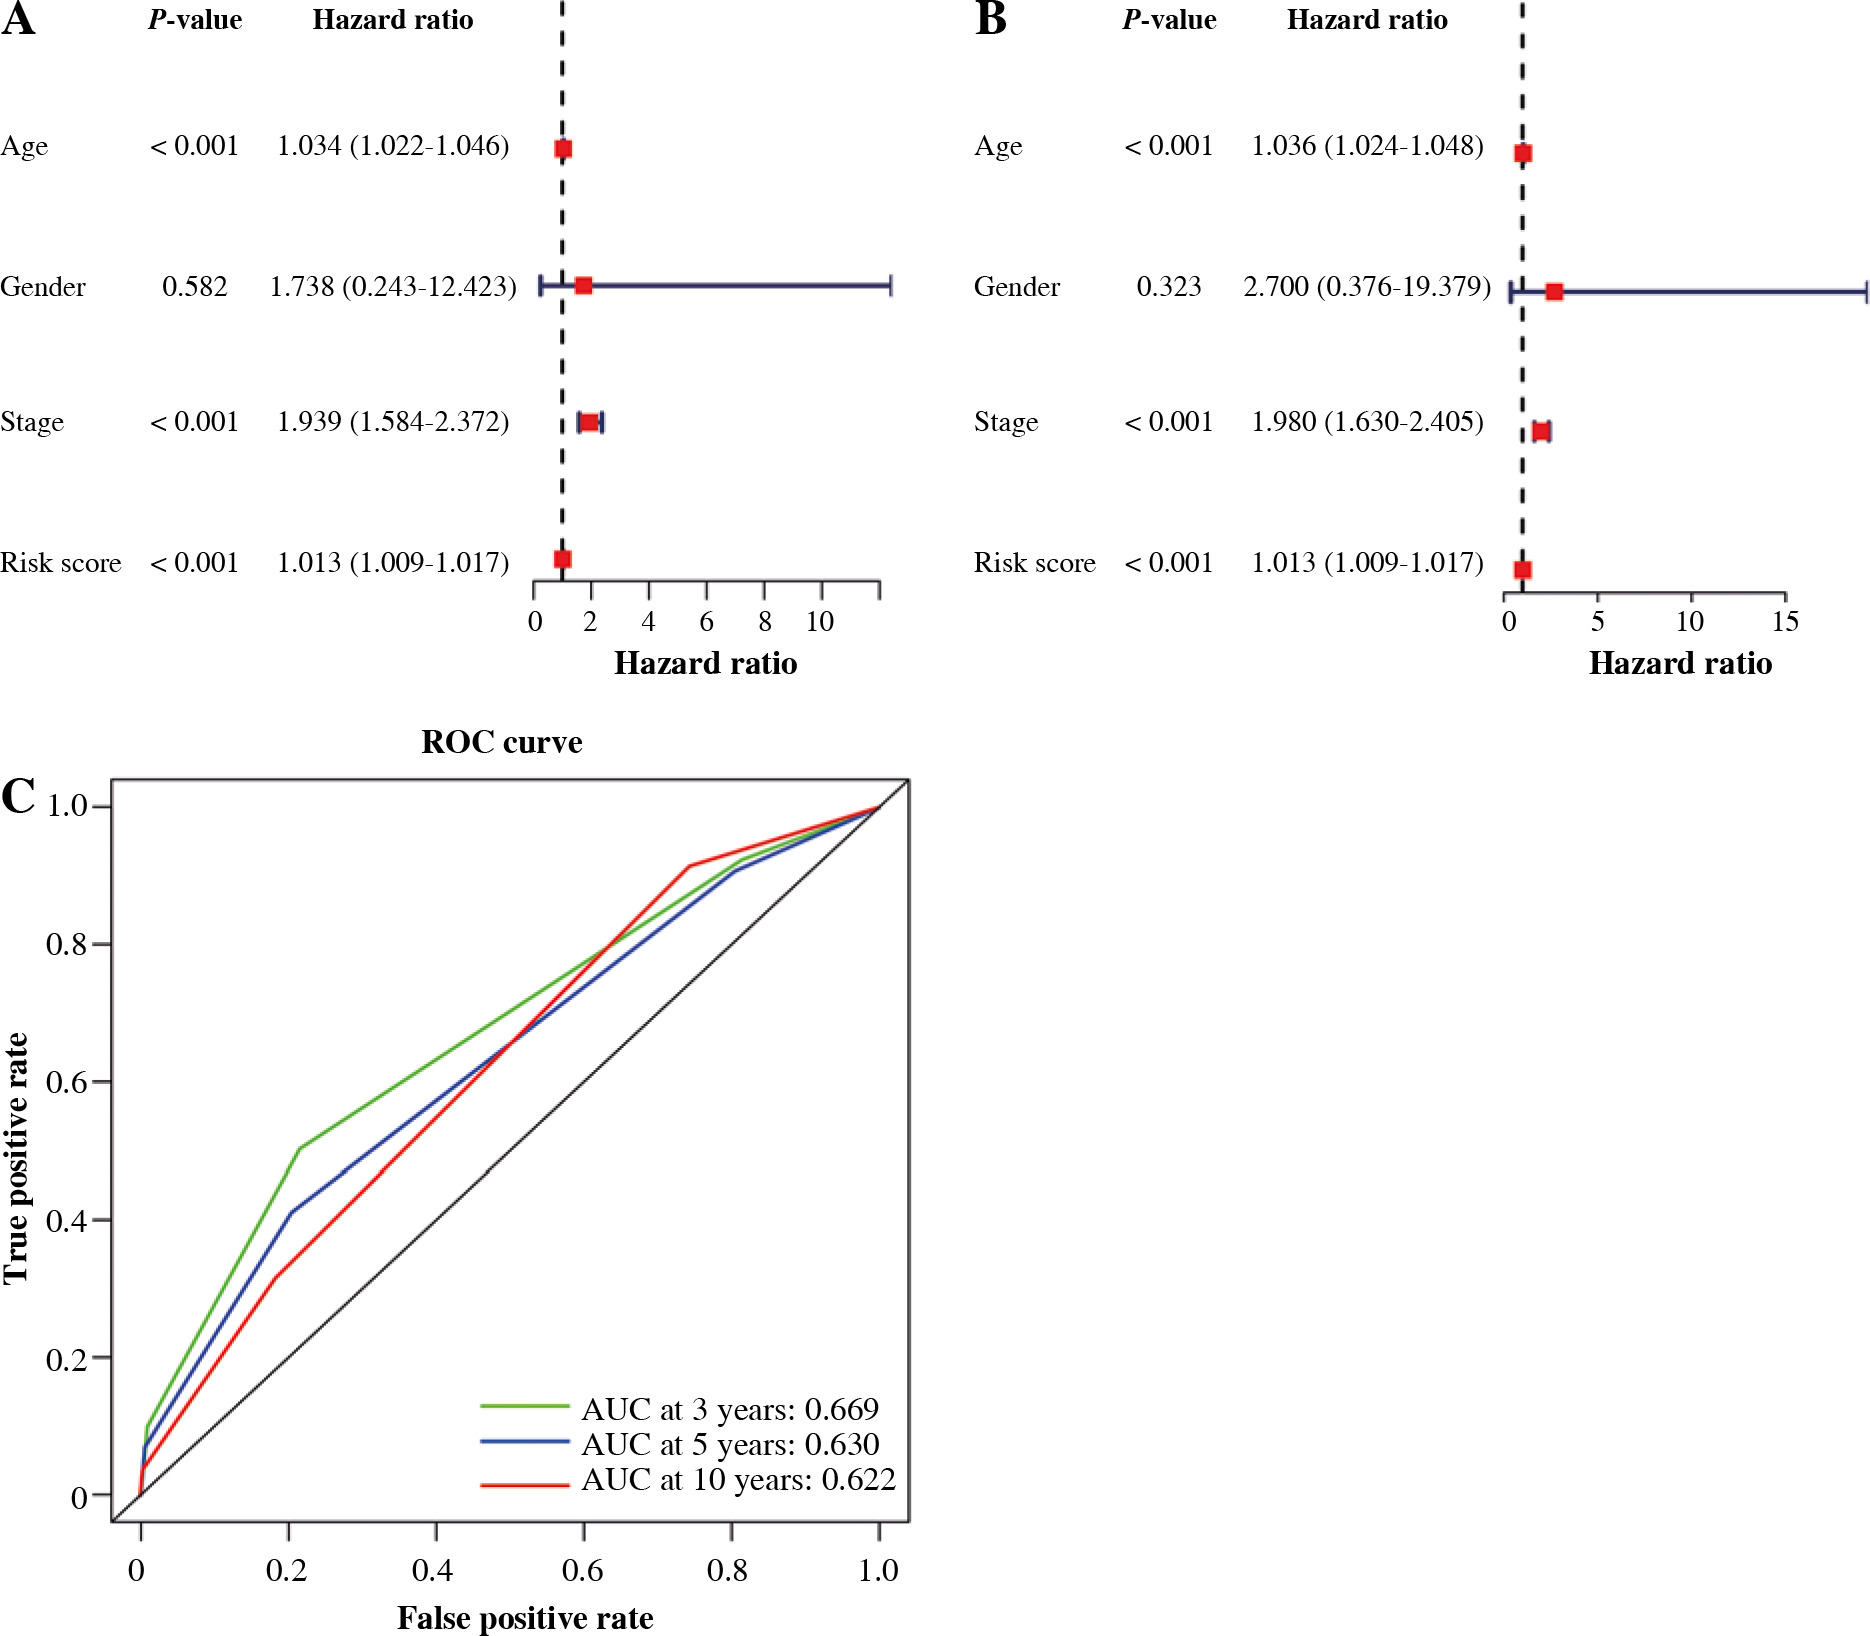
We carried out univariate as well as multivariate Cox regression analyses to examine whether other factors apart from the constructed 19 IRGs-based signature could serve as an independent prognostic factor, including age, gender, risk score, and stage. The results indicate that cancer stage and risk score and patient’s age independently predict prognosis (Fig. 6A, B). Also, t-ROC curves were plotted to assess the accuracy of the stage in the estimation of 3-, 5-, and 10-year OS for BC cases, with the corresponding area under curve (AUC) values being 0.669, 0.630, 0.622, respectively (Fig. 6C). The above results imply that the 19 immune-associated genes’ features independently predict prognosis for BC cases.
Construction and validation of nomogram
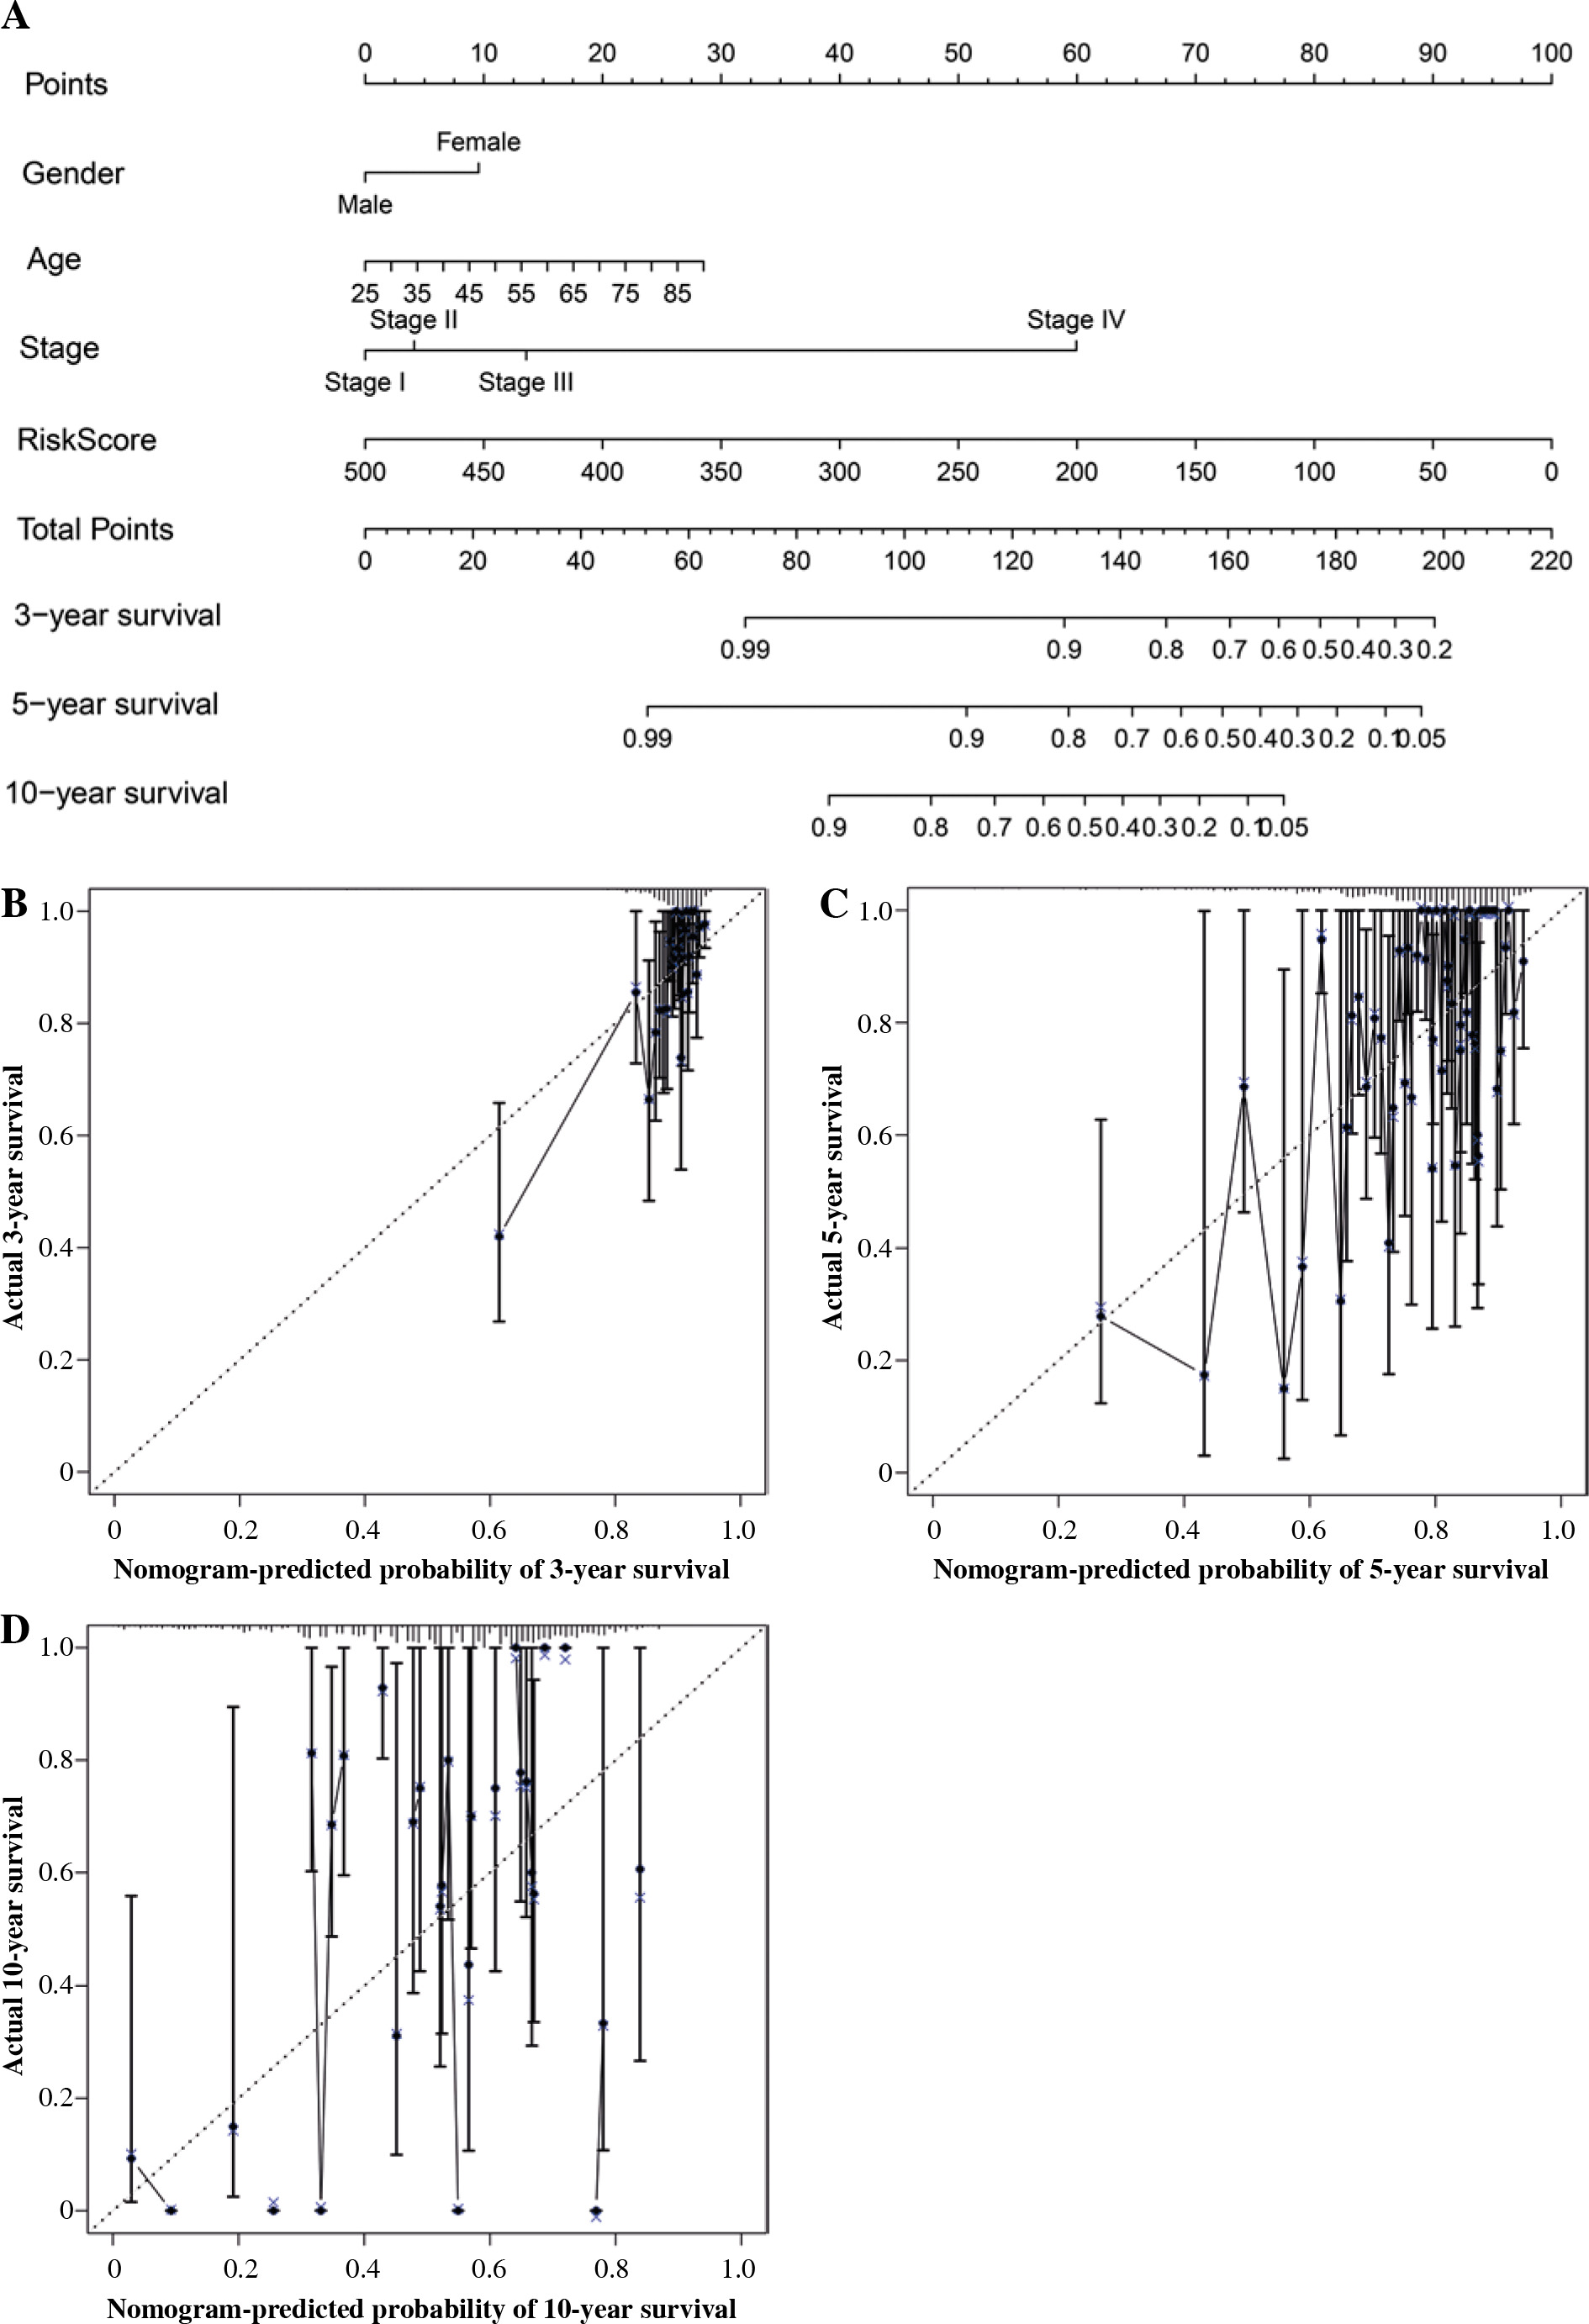
To predict 3-, 5-, and 10-year OS for BC cases, a nomogram was constructed. The features for the 19 IRGs, gender, age, and stage were considered as the variables (Fig. 7A), and the calibration curve was compared with the nomogram (Fig. 7B-D).
Protein-protein interactions network construction and hub gene identification
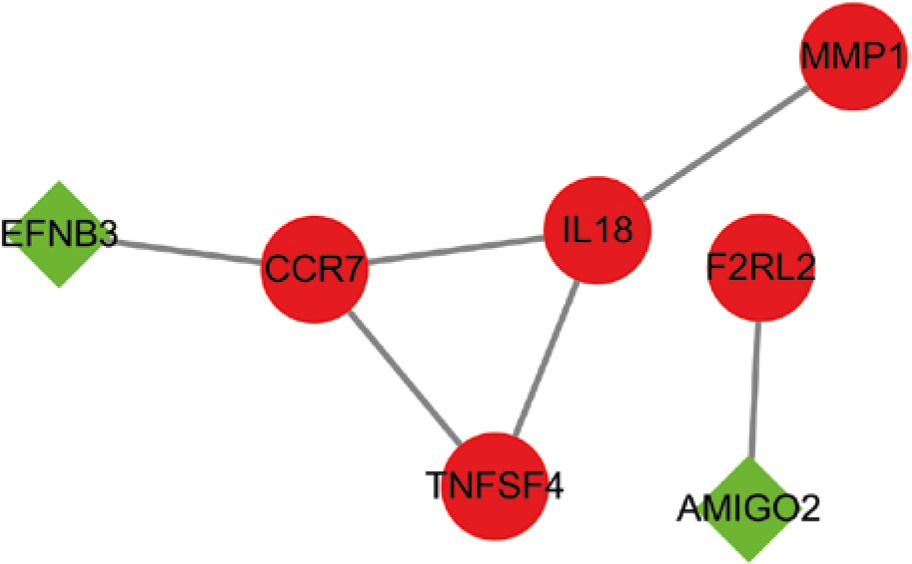
A PPI network was constructed utilizing the STRING online database based on 19 immune-associated genes, and Cytoscape software was adopted for visualization. The CytoHubba plugin was utilized to determine the node degrees, and the top three hub genes (CCR7, IL18, and TNFSF4) were identified (Fig. 8A).
Discussion
Breast cancer, like other cancers, is highly heterogeneous with diverse biological characteristics and is induced by various factors related to gene alteration accumulation [19]. Since most of the BC cases are diagnosed and treated at the advanced stage, its prognostic outcome remains dismal [20]. Increasing evidence has pointed to the utilization of IRGs as biomarkers to predict BC prognosis [21, 22]. Finding accurate and early diagnostic immune- related biomarkers helps to predict BC prognosis and enhance the efficacy of anti-BC therapies.
In this study, the TCGA-BRCA dataset was downloaded from the TCGA database. Then, the mRNA sequencing data were separated into three clusters with 29 types of immune cells by adopting the unsupervised hierarchical clustering algorithm. There were significant differences in the immune, ESTIMATE, and stromal scores and tumor purity between the low, medium, and high immune infiltrating clusters. Furthermore, the expression levels of HLAs and PD-L1 and portions of many immune cell types were analyzed to validate immune infiltrating degrees. Based on the results, 138 overlapped IRGs were identified between low and high immune infiltrating degrees as well as normal and cancer tissues. Univariate Cox and LASSO regression analyses were utilized to review 19 genes (AMIGO2, APCDD1L, CCR7, CFB, CLIC3, EFNB3, F2RL2, FAM189A2, IL18, LY6E, MMP1, NMNAT2, NTRK3, OLFML2B, PSD2, PSME2, SH3BP1, SPIB, and TNFSF4) that could be utilized as an immune-related biomarker for BC.
For the further validation of these 19 genes’ clinical features, the samples were classified into high- and low-risk groups according to the median risk score. The Kaplan-Meier plot, ROC curve, and score indicated that these 19 immune-associated genes have a satisfactory predictive ability.
Univariate and multivariate Cox regression analyses were employed to analyze the relationships between age, gender, risk score, and stage. The results indicated that risk score, age, and stage might independently predict BC prognosis. Finally, a nomogram was constructed to predict BC prognosis based on risk scores obtained from gender, age, 19 IRGs-based signature, and stage. Additionally, the 3-, 5-, and 10-year OS of BC was also predicted.
In order to determine the hub genes of these 19 immune-associated genes, a PPI network was constructed. Three hub genes (CCR7, IL18, and TNFSF4), highly expressed in BC tissues, were selected from this network. C-C Motif Chemokine Receptor 7 (CCR7) and its ligands have been associated with metastasis [23, 24], and evidence indicates that CCR7 expression is linked to a poorer prognosis of BC [25]. Furthermore, CCR7 up-regulation is correlated with lymph node metastasis in various types of cancers, such as pancreatic [26], esophageal [27], head and neck [28], prostate [29], colorectal [30], and breast cancers [25]. Interleukin (IL)-18, which is structurally similar to IL-1, is a cytokine belonging to the IL1 superfamily. The expression of IL-18 is detected in numerous lymphoid and nonlymphoid cells, and it is known to play a critical role in inflammation [31]. Studies have demonstrated the dual roles of IL-18 in tumors; it promotes the immune response, mediated by interferon (IFN) production, thereby suggesting its anti-tumoral effects. However, high levels of IL-18 in some cancers and cancer-related polymorphisms imply that it promotes tumor progression [31]. Tumor necrosis factor (TNF) superfamily member 4 (TNFSF4) is one of the TNF ligand family members, which is related to regulating activated T-cell adhesion onto the target cells and the interactions between T-cells and antigen-presenting cells [32]. TNFSF4 and TNFRSF4 form a stimulatory pair leading to the proliferation of T-cells and generation of cytokines. Furthermore, TNFRSF4 is highly expressed in BC tissues and related to shorter survival time [32]; however, its exact function in BC remains unclear.
To sum up, this study adopted machine learning and bioinformatics analysis to analyze IRGs in BC samples. Altogether three possible prognostic targets were selected; however, they should be further validated in clinical trials. The findings of the present work provide an approach for predicting survival rates in BC patients and offer possible therapeutic targets for anti-BC immunotherapy.