
Introduction
Immunoglobulin A nephropathy (IgAN) is the most common form of primary glomerulonephritis and a major cause of renal failure, and its main feature is the deposition of IgA in the glomerular mesangium [1, 2]. IgAN is clinically associated with a variety of inflammatory and infectious diseases, liver diseases and cancers [3-5]. Its common clinical manifestations are gross hematuria, microscopic hematuria, proteinuria, and hypertension [6, 7]. In addition, IgAN is associated with significant mortality [8]. The current diagnostic criterion for IgAN remains the presence of dominant mesangial immunoglobulin A deposition in renal biopsy [9]. So far, there is no specific treatment for this disease. Therefore, the identification of new biomarkers for the disease is important for diagnosis, treatment and detection of disease progression.
The pathogenesis and progression of IgAN are related to the immune mechanism by single-cell transcriptomes [10]. Compared with the control group, IgAN patients had abnormal CD4+ and CD25+ cell levels [11]. Differentiation of CD4+ T cell subsets plays a vital role in the artemisinin and hydroxychloroquine combination therapy of IgAN [12]. The CD208+ dendritic cell level in tonsils is significantly higher in IgAN patients, and is positively correlated with the proportion of crescentic glomeruli and urinary protein levels [13]. Compared with healthy subjects, IgAN patients had a higher percentage of activated and effector memory CD4+ T lymphocytes [14]. These findings suggest that exploring the distribution of immune cells will contribute to the study of IgAN pathogenesis and immunotherapy.
Although the specific pathogenesis of IgAN is still unclear, it has been found that a variety of molecules are involved in the regulation of its progression, which lays the foundation for in-depth understanding of the pathogenesis of IgAN. The expression level of core 1 synthase, glycoprotein-N-acetylgalactosamine 3-beta-galactosyltransferase 1 (C1GALT1) is significantly down-regulated in IgAN patients and negatively correlated with the increased level of galactose-deficient IgA1 (Gd-IgA1) in peripheral B lymphocyte [15]. The expression level of toll-like receptor 4 (TLR-4) is increased in circulating monocytes of IgAN patients [16]. MiR-133a/133b inhibits regulatory T cell differentiation in IgAN through targeting forkhead box P3 (FOXP3) [17]. MiR-98-5p in pediatric IgAN patients may affect IgA1 glycosylation and thus regulate disease progression by targeting C1GALT1 [18]. In addition, differentially expressed genes participate in different biological signaling pathways in the progression of IgAN [19]. For example, sterile 20/SPS1-related proline/alanine-rich kinase (SPAK) plays a pathogenic role in IgAN by activating the nuclear factor κB/mitogen-activated protein kinase (NF-κB/MAPK) signaling pathway [20]. Therefore, exploration of the IgAN molecular mechanism is helpful for the development of new management methods.
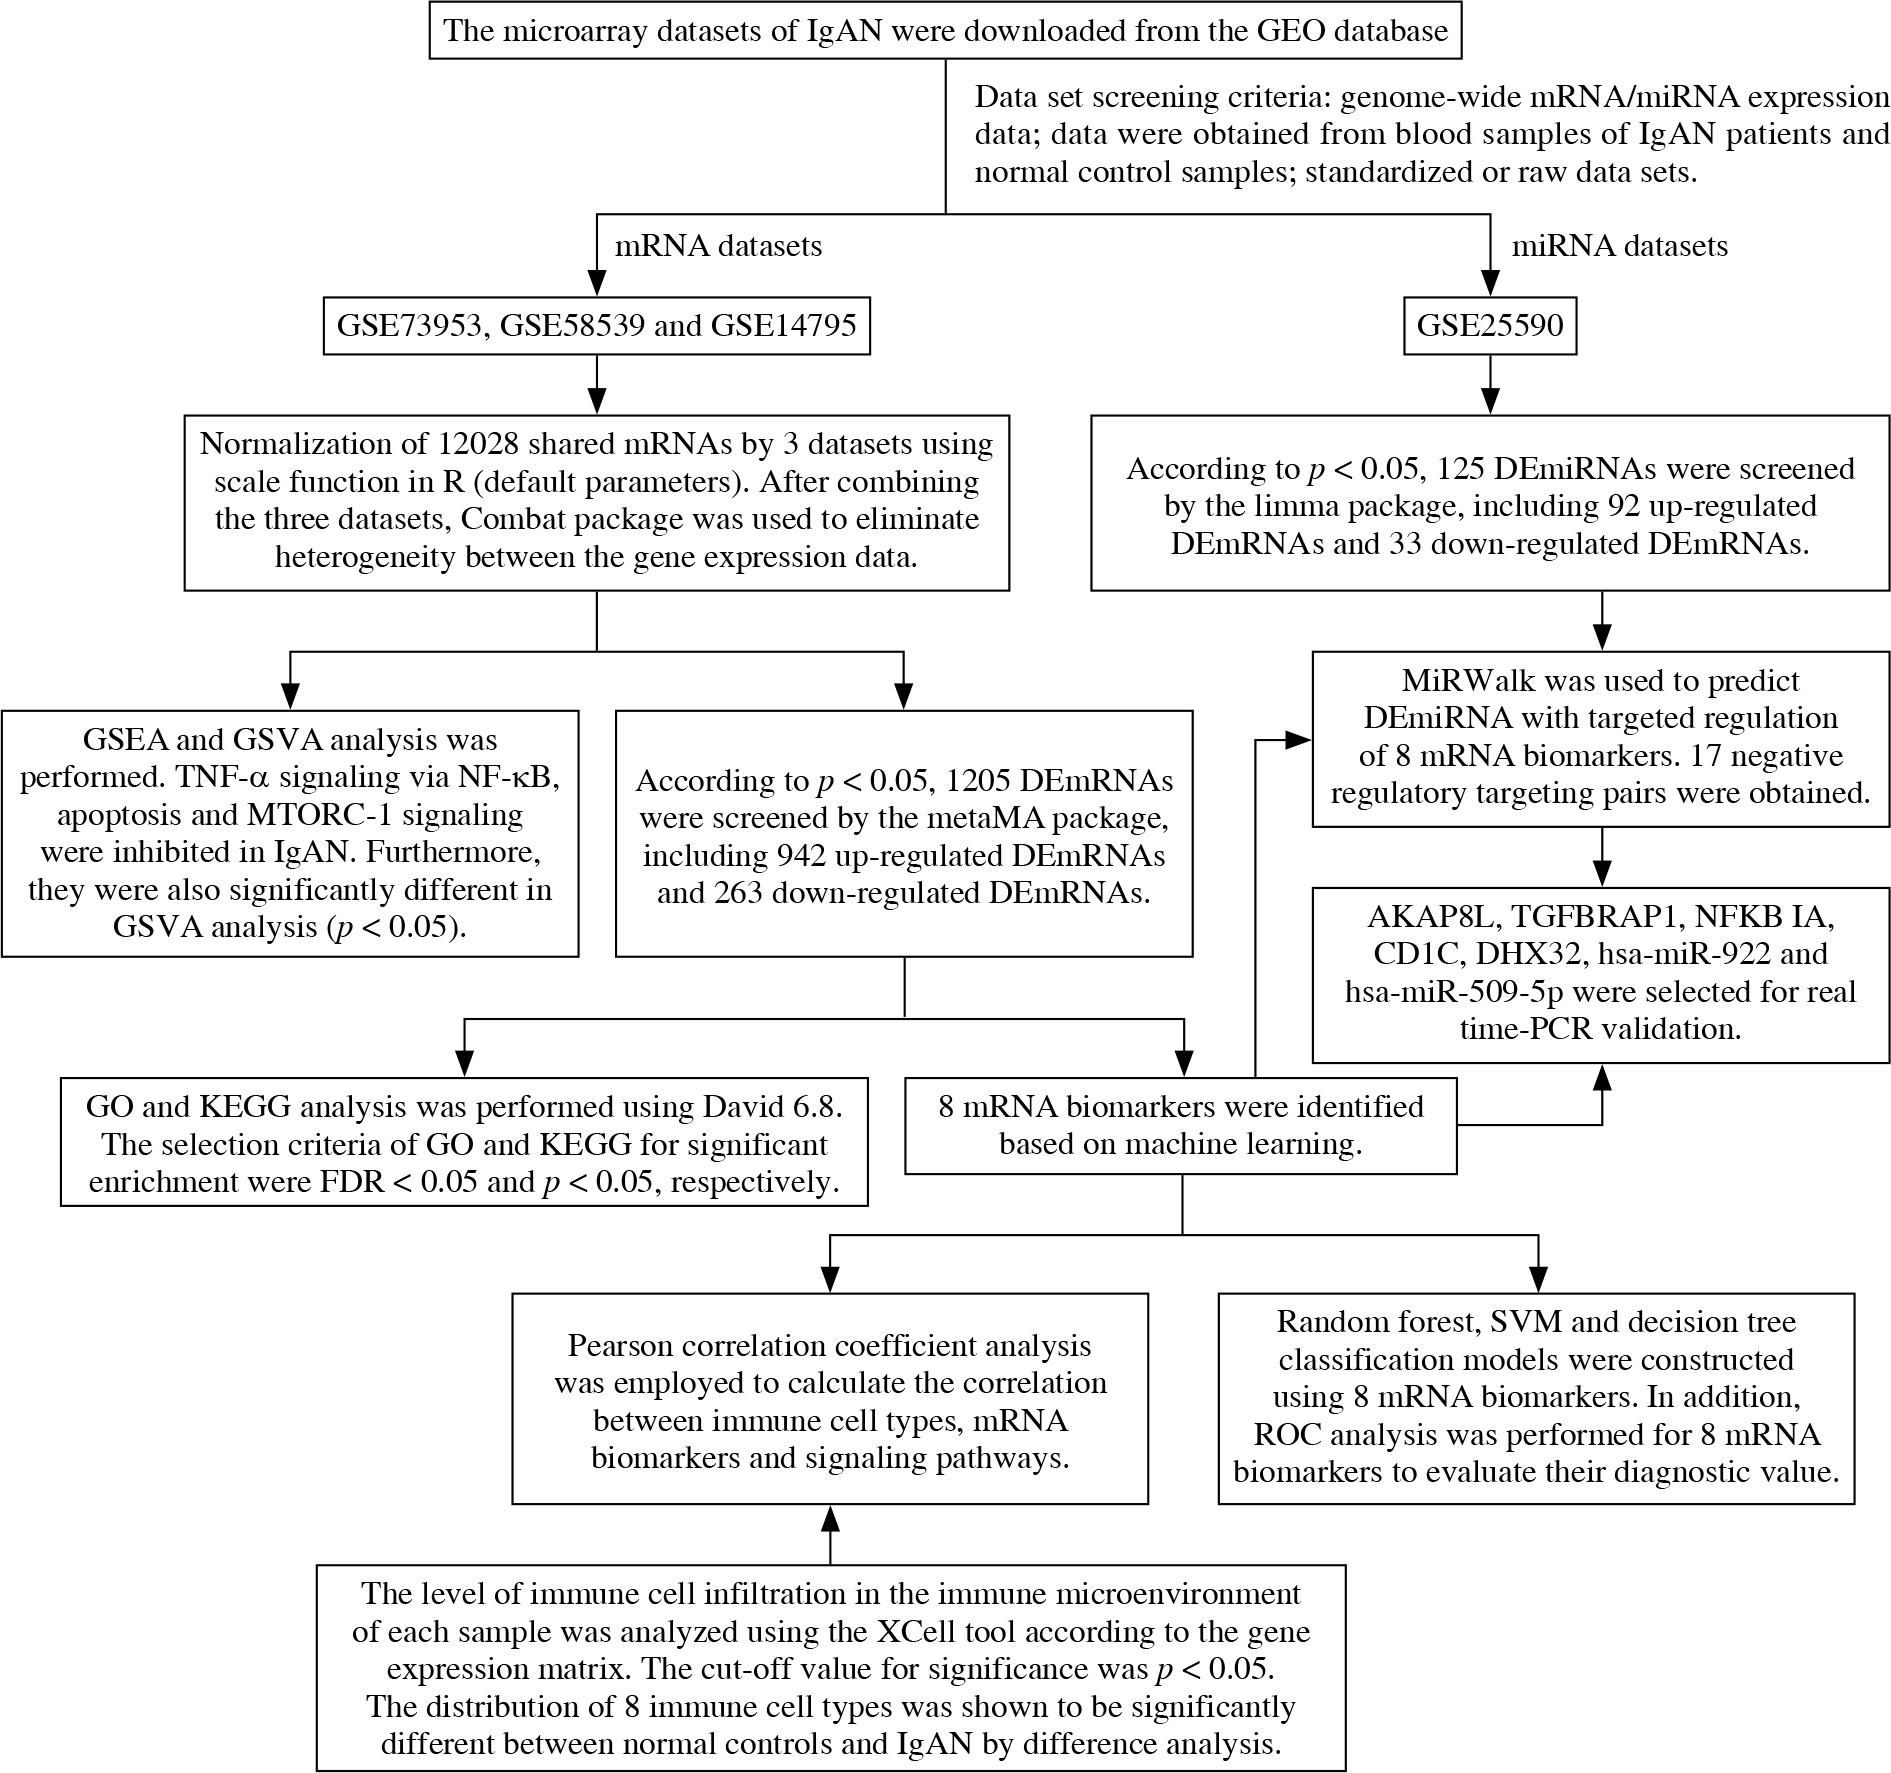
In this study, the data of IgAN were downloaded from the Gene Expression Omnibus (GEO) database. 8 mRNA biomarkers were screened by difference analysis and machine learning. The XCell tool was used to analyze the distribution of immune cells in IgAN and normal controls. Subsequently, correlations between mRNA biomarkers, immune cells and signaling pathways were analyzed. In addition, we analyzed miRNAs and constructed a miRNA- mRNA targeted regulatory network (Fig. 1).
Material and methods
Data
The microarray datasets of IgAN were downloaded from the GEO database (https://www.ncbi.nlm.nih.gov/). The datasets were further chosen based on the inclusion criteria: 1) the dataset must be genome-wide mRNA/miRNA transcriptome expression data; 2) these data were obtained from blood samples of IgAN patients and normal control blood samples; 3) standardized or original datasets were considered in this study. Subsequently, four datasets were included our study, including three datasets of mRNA (GSE73953, GSE58539 and GSE14795) and 1 dataset of miRNA (GSE25590). The details of these datasets are shown in Table 1. The raw data of GSE73953, GSE58539 and GSE14795 were downloaded from the GEO database, and 12028 mRNAs shared by 3 sets of mRNA datasets were scale standardized (scale function in R, default argument). After combining the three datasets, the Combat package [21] was used to eliminate heterogeneity among the gene expression data.
Identification of DEmRNAs and DEmiRNAs
The metaMA package [22] was utilized to recognize differentially expressed mRNAs (DEmRNAs) between the IgAN patients and normal controls. The screening condition for the DEmRNAs was p value (p) < 0.05. The limma package [23] was applied to define the differentially expressed miRNAs (DEmiRNAs) between the IgAN patients and normal controls, and the selection criterion was p < 0.05. In addition, a heat map of DEmRNAs and DEmiRNAs was produced with the pheatmap package in R language (http://cran.r-project.org/web/packages/pheatmap/index.html).
Functional analysis
To uncover the potential biological function of DE- mRNAs in IgAN, gene ontology (GO) and Kyoto Encyclopedia of Genes and Genomes (KEGG) analysis was performed using David 6.8 (https://david.ncifcrf.gov/). The selection criteria of GO and KEGG for significant enrichment were false discovery rate (FDR) < 0.05 and p < 0.05, respectively. Moreover, gene set enrichment analysis (GSEA) and gene set variation analysis (GSVA) were used to further disclose the pathways of significant enrichment. According to the reference gene set, h.all.v7.2.symbols.gmt, we used the GSEA 4.1.0 software tool (https://www.gsea-msigdb.org/gsea/index.jsp) to discover the pathways. P < 0.05 was regarded as statistically significant. Using the reference gene set described above, we used the GSVA package [24] to measure the signaling pathway variation score for each sample in IgAN. Significantly differential enriched gene sets were filtered at a cut-off criterion of p < 0.05.
Identification of optimal diagnostic mRNA biomarkers
Firstly, the least absolute shrinkage and selection operator (LASSO) algorithm in the glmnet package [25] was used to perform feature selection (a dimensionality reduction process to select important mRNAs). Then, the random forest and caret packages in R language [26] were used to find the optimal parameter, and the importance of these mRNAs was ranked from high to low according to the mean decrease in accuracy value. Subsequently, one mRNA was added from top to bottom according to the order of sorting results. The random forest algorithm was used to classify, and the 10-fold cross-validation process was used to calculate accuracy. In addition, the random forest package (https://cran.r-project.org/web/packages/randomForest/) was employed to establish the random forest model. The rpart package (https://cran.r-project.org/web/packages/rpart/) was used to build the decision tree model. The e1071 package (https://cran.r-project.org/web/packages/e1071/index.html) was applied to establish the support vector machine (SVM) model. Finally, receiver operating characteristic (ROC) analysis was performed using the pROC package (http://web.expasy.org/pROC/) in R to evaluate the diagnostic value of mRNA biomarkers.
Immune cell infiltration analysis
The level of immune cell infiltration in the immune microenvironment of each sample was analyzed using the XCell tool (https://xcell.ucsf.edu/) according to the gene expression matrix. The cutoff value for significance was p < 0.05. To further explore the possible mechanism of mRNA biomarkers, Pearson correlation coefficient analysis was employed to calculate the correlation between immune cell types, mRNA biomarkers and signaling pathways.
Construction of the DEmiRNA-DEmRNA network
The interactions between the DEmiRNA and mRNA biomarkers were predicted using miRWalk (http://mirwalk.umm.uni-heidelberg.de/interactions/). Screening of DEmiRNAs that negatively regulate mRNA biomarkers was performed. Cytoscape software (http://www.cytoscape.org) was utilized to produce the miRNA-mRNA network.
Real-time polymerase chain reaction (real time-PCR) validation
Based on the above bioinformatics integration analysis results, 5 DEmRNAs (CD1C, TGFBRAP1, DHX32, AKAP8L and NFKBIA) and 2 DEmiRNAs (hsa-miR-922 and hsa-miR-509-5p) were selected for in vitro validation. Blood samples were collected from 11 IgAN patients and 19 healthy individuals. Total RNA was isolated using the RNAliquid ultra speed whole blood (liquid sample) total RNA extraction kit (Beijing HT-biotech Co., Ltd., China). The FastKing cDNA first strand synthesis kit (TIANGEN, China) and miRNA first strand cDNA synthesis kit (tailing method) (Sangon Biotech, China) were reverse transcribed to synthesize mRNA and miRNA, respectively. SuperReal PreMix Plus (SYBR Green) (TIANGEN, China) and the miRNA quantitative PCR kit (dye method) (Sangon Biotech, Ltd., China) were used to perform real time-PCR validation of mRNA and miRNA, respectively. Human ACTB, GAPDH and hsa-U6 were used as an internal reference. The 2–ΔΔCt method was used to calculate the relative gene expression level [27].
Results
DEmRNAs and DEmiRNAs
According to the screen condition of p < 0.05, 1205 DE- mRNAs were identified. Among them, 942 were up-regulated and 263 were down-regulated. The top 10 up- regulated DEmRNAs were C19orf21, ARFRP1, PIK3R2, DHX32, PADI2, OLFM1, PAX8, SSTR2, TGFBRAP1 and EDC4 (Table 2). The top 10 down-regulated DE- mRNAs were HUWE1, PDIA3, CDC25B, CDC42, CTSB, PPP1CA, SAT1, ANAPC1, ZNF710 and DPM1 (Table 2). The heat map of the top 100 DEmRNAs is shown in Fig. 2A. 125 DEmiRNAs were identified. Among them, 92 were up-regulated and 33 were down-regulated DEmiRNAs. The top 10 up-regulated DEmiRNAs were hsa-let-7i, hsa-miR-1224-5p, hsa-let-7d, hsa-let-7b, hsa-miR-760, hsa-let-7a, hsa-miR-501-5p, hsa-miR-671-5p, kshv-miR-K12-7 and hsa-let-7c (Table 3). The top 10 down-regulated DEmiRNAs were hsa-miR-30c, hsa-miR-30a, hsa-miR-222, hsa-miR-26a, hsa-miR-32, hsa-miR-484, hsa-miR-212, hsa-miR-17*, hsa-miR-140-3p and hsa-miR-181c (Table 3). The heat map of the top 50 DEmiRNAs is shown in Fig. 2B.
Fig. 2
Heat map of DEmRNAs and DEmiRNAs. A) Heat map of top 50 DEmRNAs; B) heat map of DEmiRNAs. Rows and columns represent genes and samples, respectively. Orange indicates above the reference channel (high expression genes). Purple indicates below the reference channel (low expression genes)
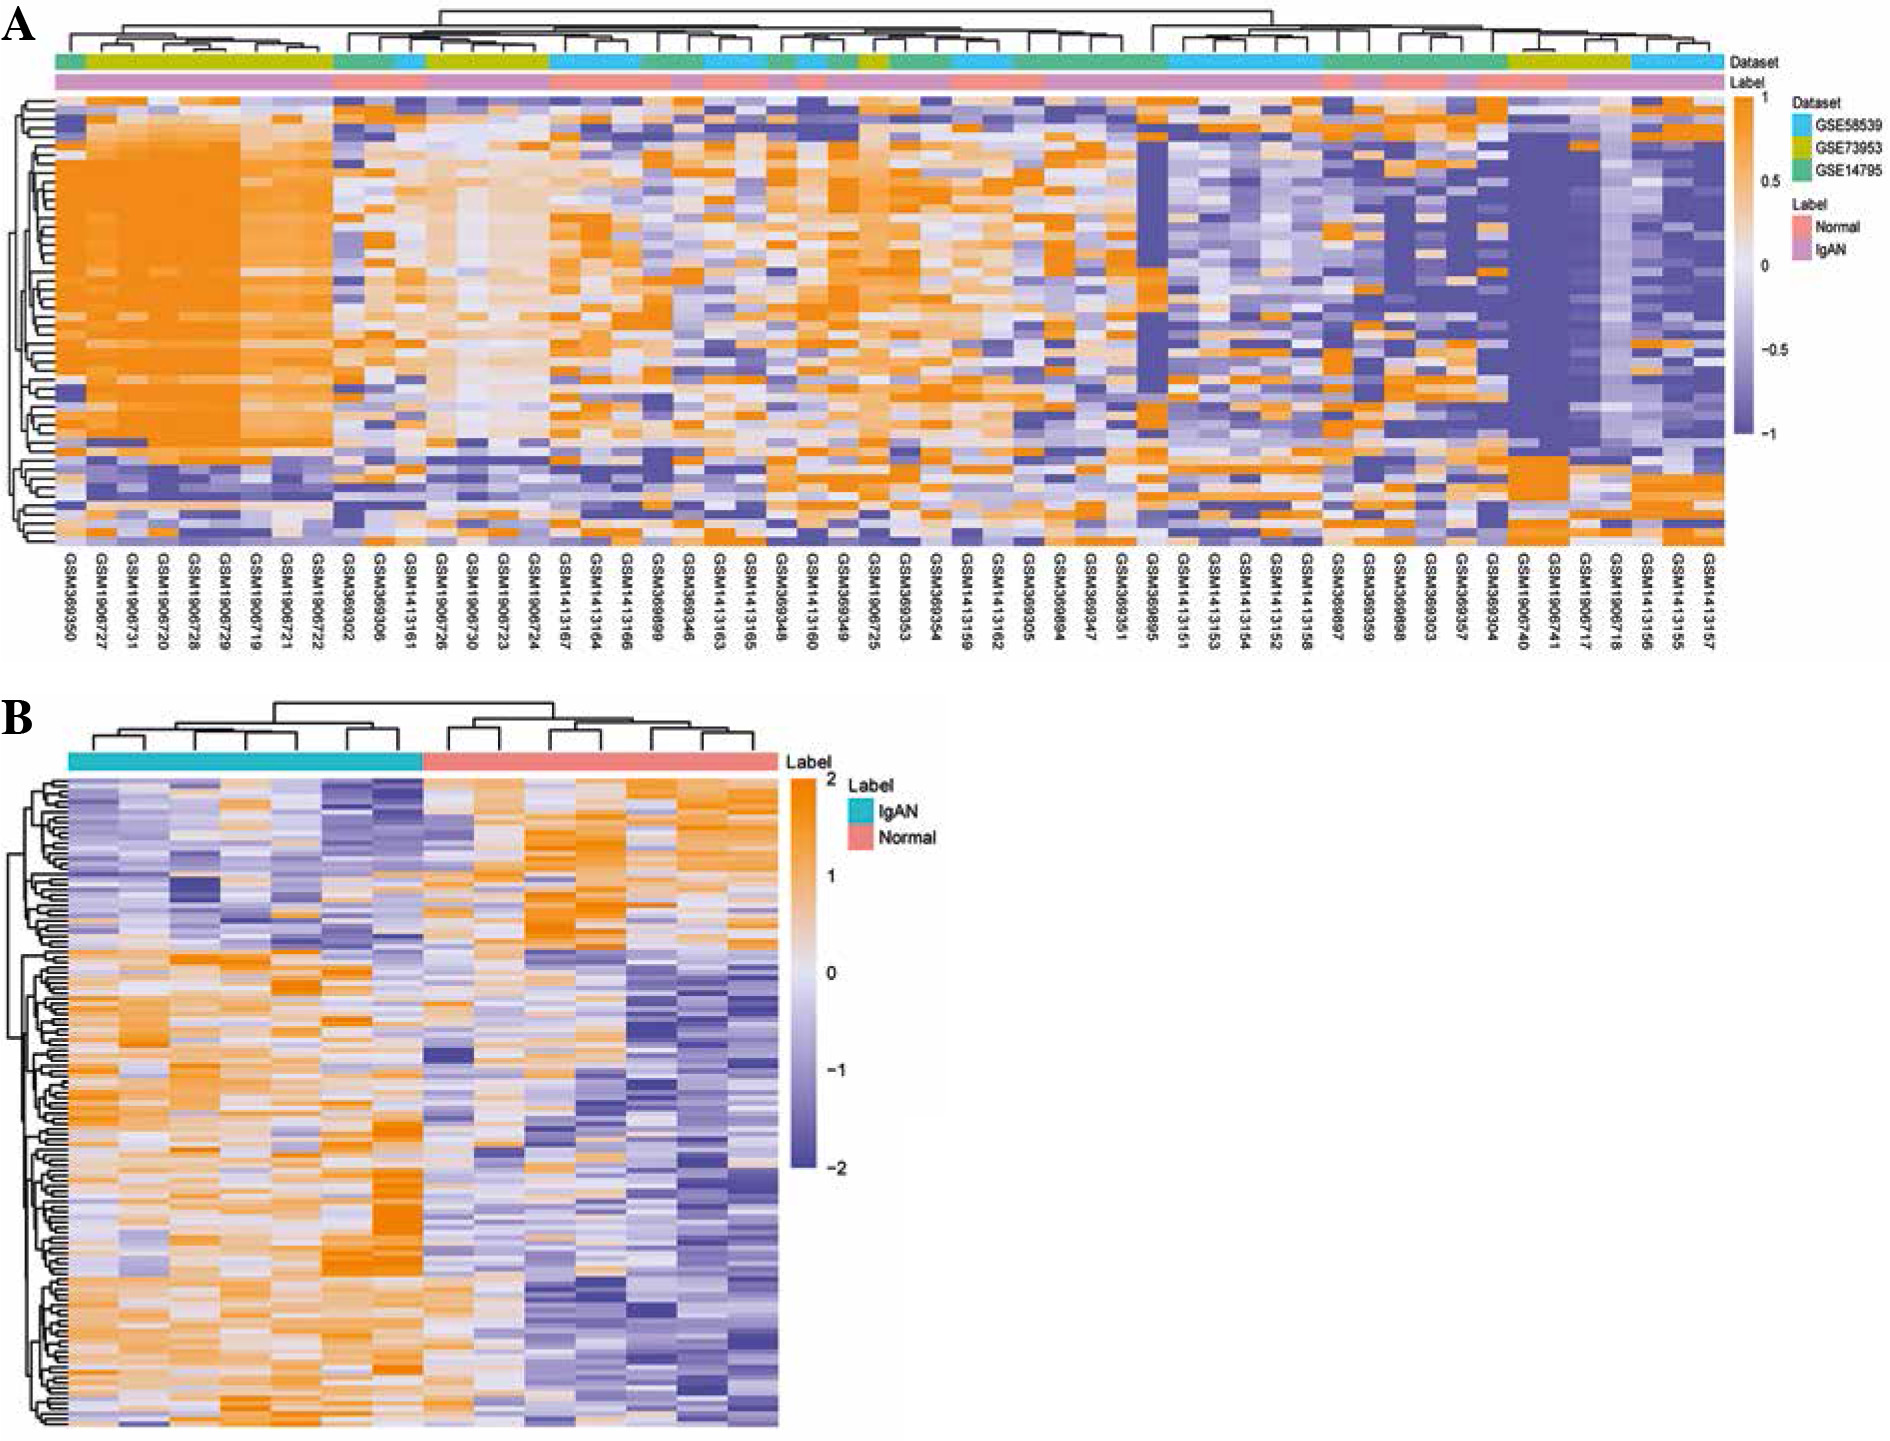
Table 2
Top 10 up/down-regulated DEmRNAs
Table 3
Top 10 up/down-regulated DEmiRNAs
Functional analysis
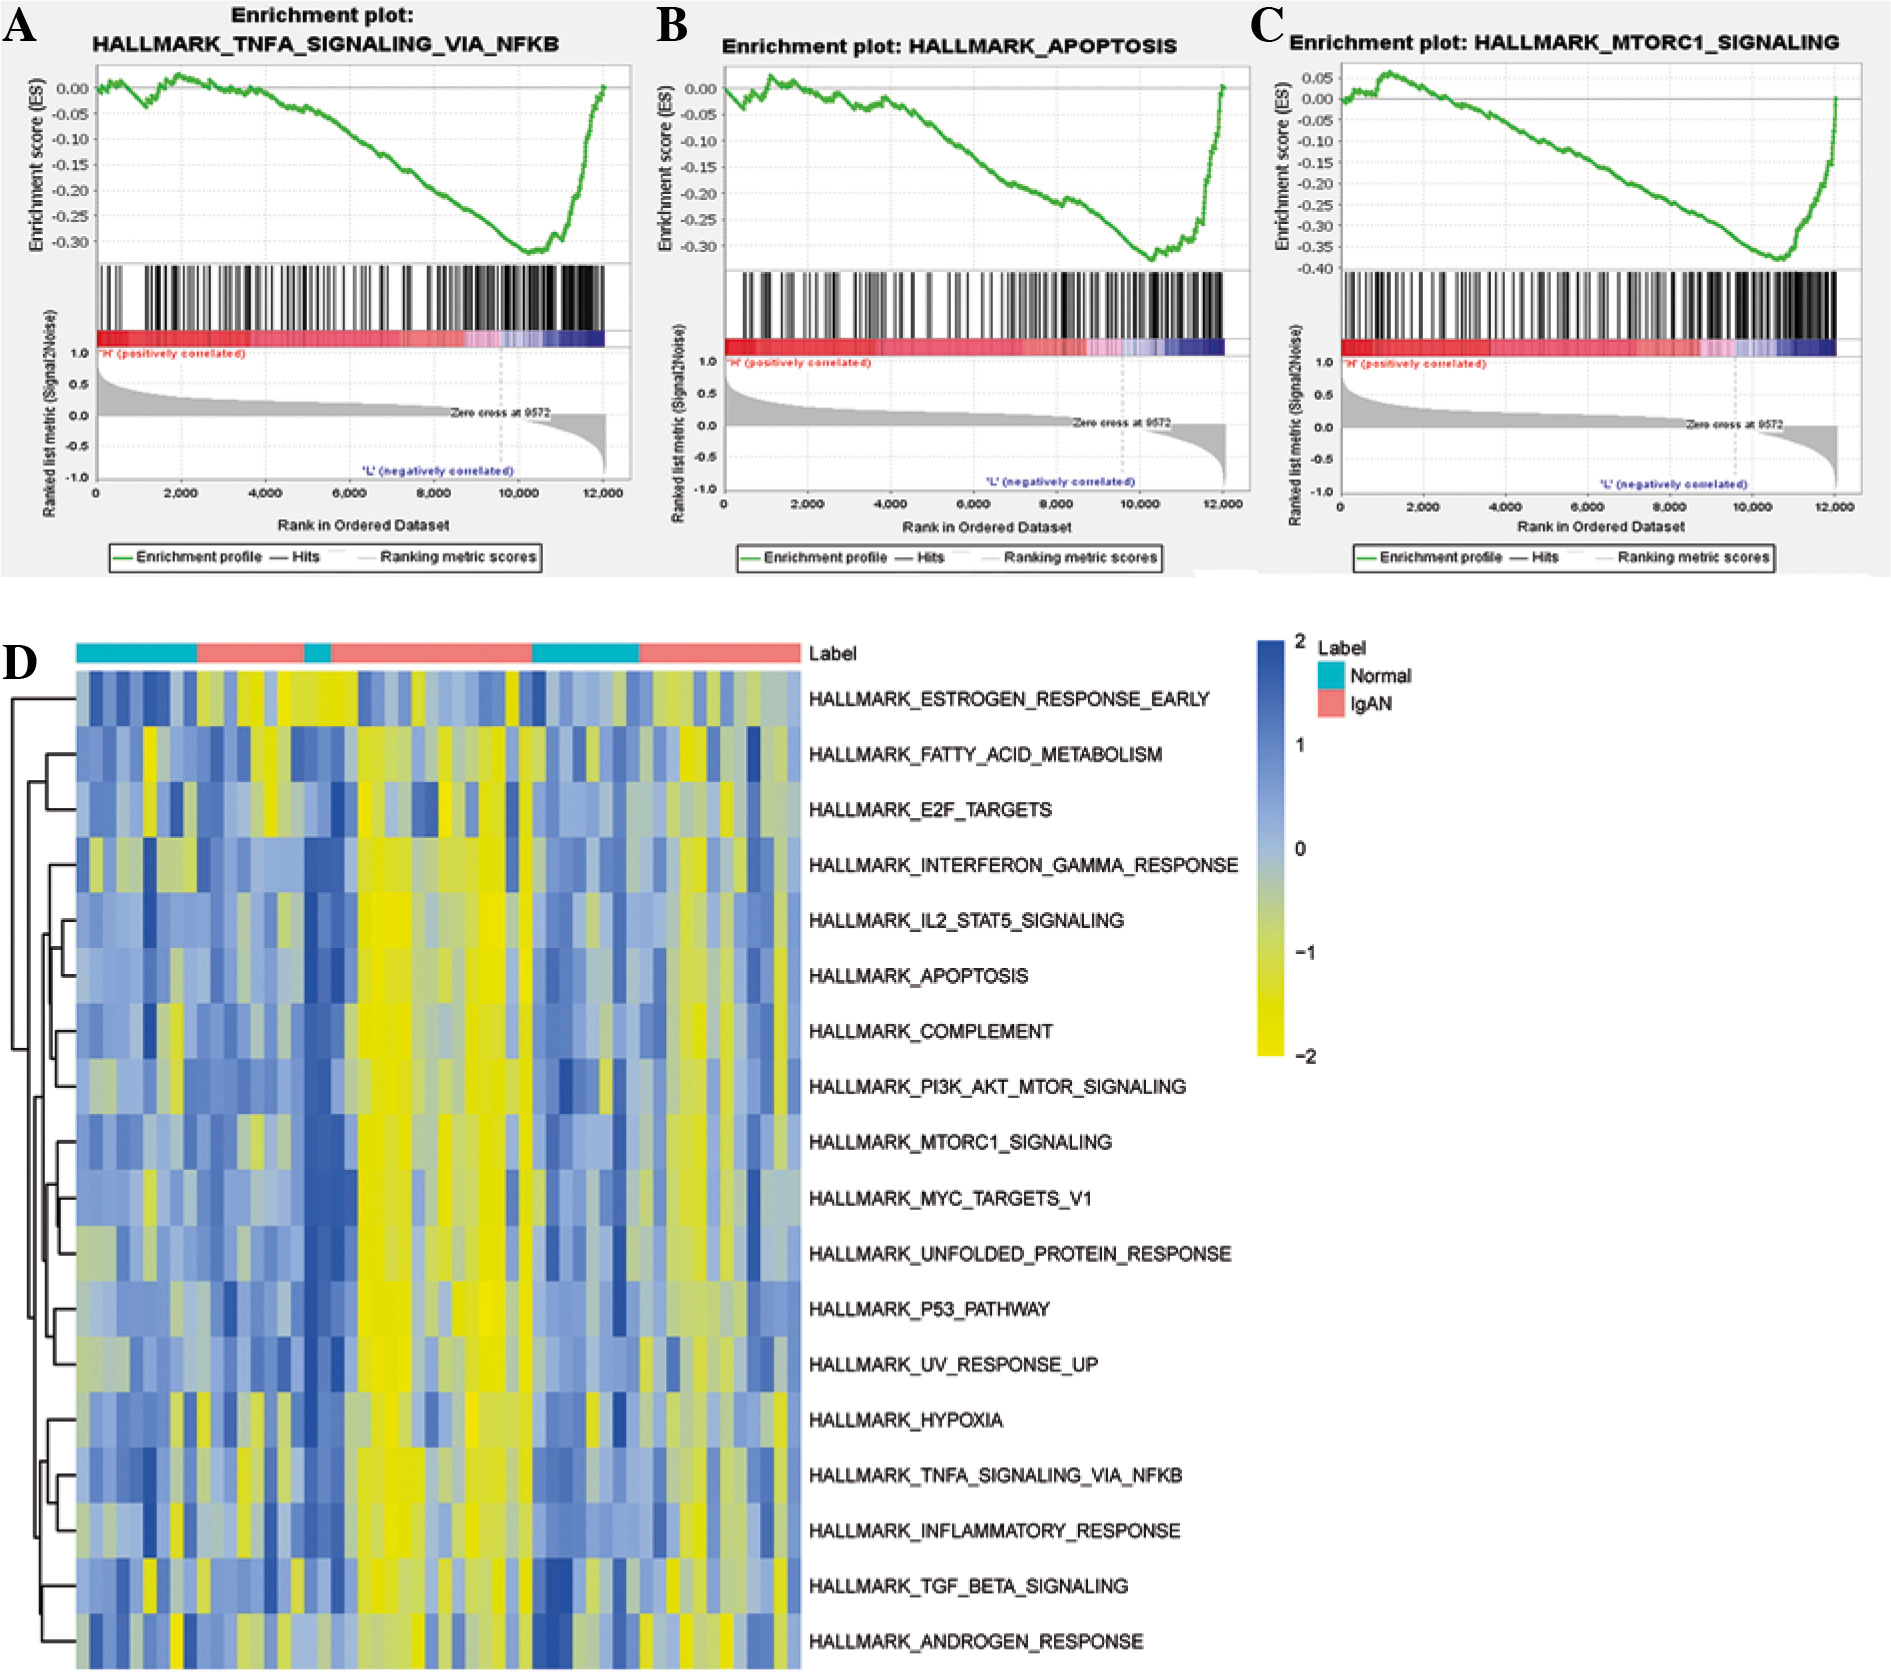
Gene ontology and KEGG functional enrichment analyses were performed using David 6.8 (Fig. 3). GO enrichment analysis includes biological process (BP) terms, cell composition (CC) terms and molecular function (MF) terms. In BP terms, DEmRNAs were mainly involved in regulation of transcription from RNA polymerase II promoter and endosomal vesicle fusion. In CC terms, DEmRNAs were mainly distributed in the nucleoplasm and cytosol. In MF terms, DEmRNAs were mainly associated with protein binding and poly (A) RNA binding. According to KEGG analysis, Epstein-Barr virus infection, endocytosis, and spliceosome were significantly enriched signaling pathways. In addition, GSEA and GSVA analysis was performed on the expression matrix of all genes. In GSEA analysis, TNF-α signaling via NF-κB (p = 0.032), apoptosis (p = 0.002) and MTORC-1 signaling (p = 0.025) were inhibited in IgAN (Fig. 4A-C). Moreover, TNF-α signaling via NF-κB, apoptosis and MTORC-1 signaling were also significantly different in GSVA analysis (p < 0.05) (Fig. 4D).
Fig. 3
Gene ontology (GO) and Kyoto Encyclopedia of Genes and Genomes (KEGG) functional enrichment analysis of DEmRNA. A) GO functional enrichment of DEmRNA. Circle, triangle and square represent biological process (BP), cellular component (CC) and molecular function (MF), respectively; B) KEGG functional enrichment of DEmRNA
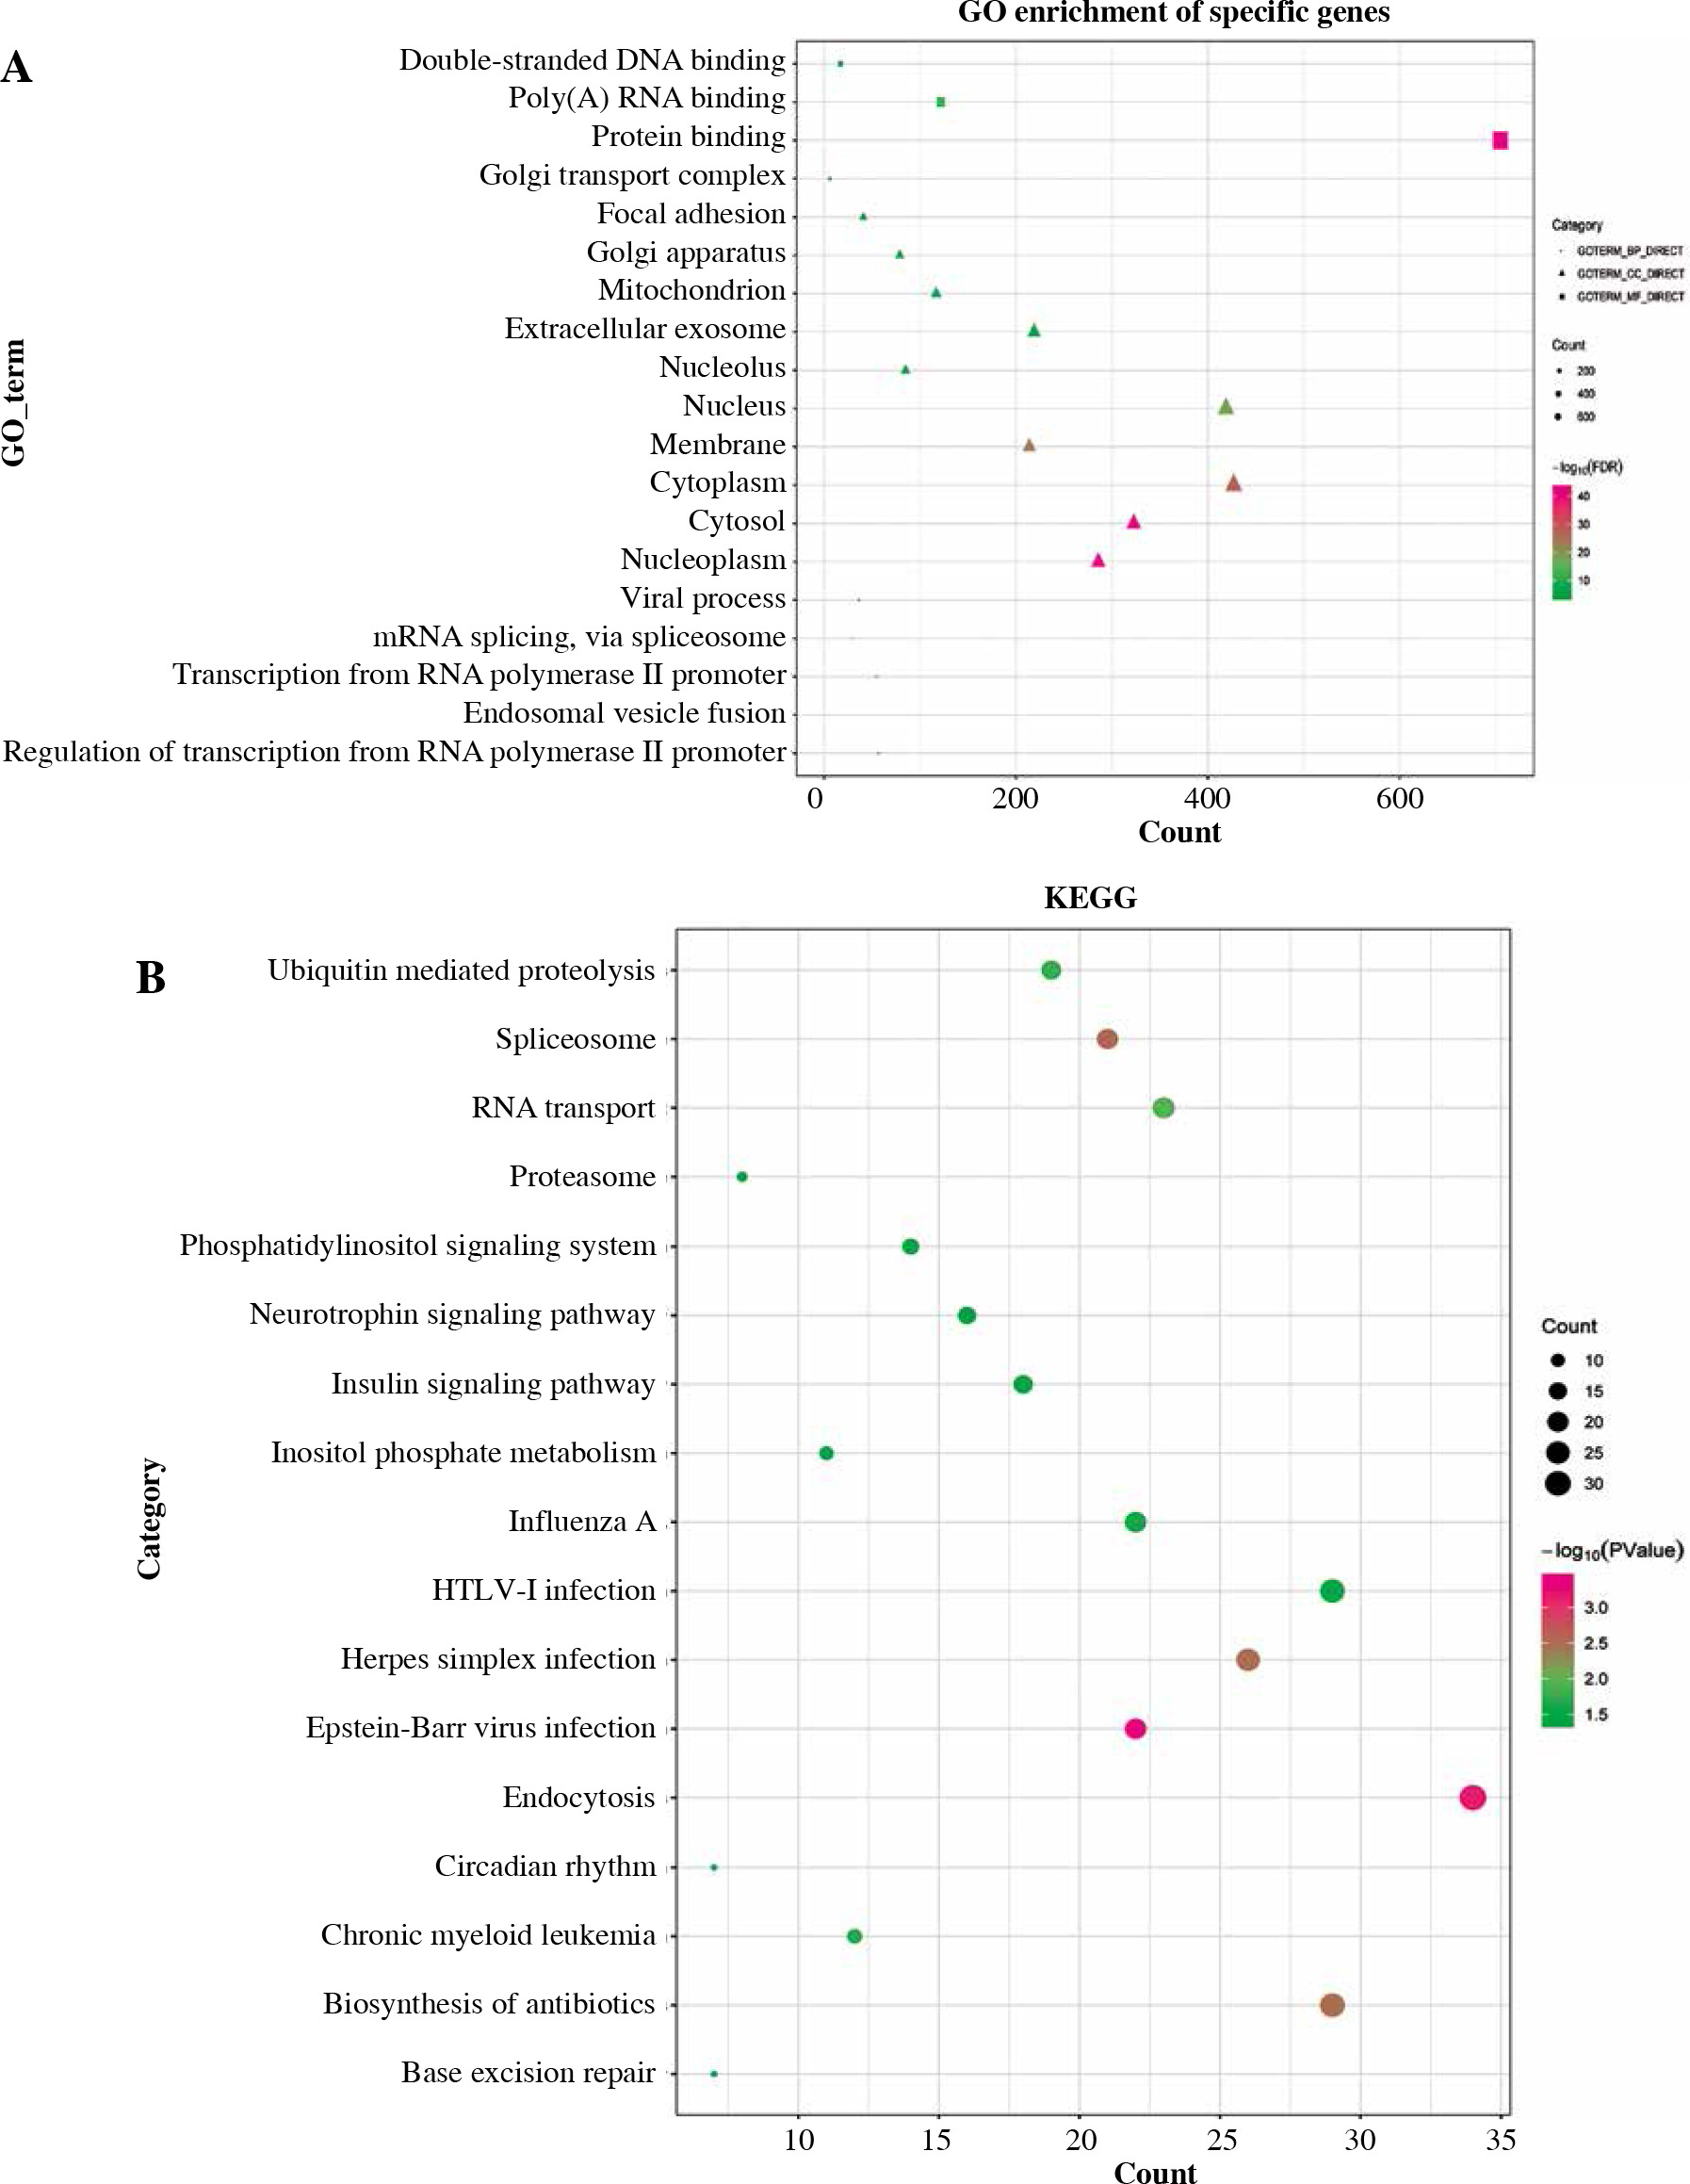
Fig. 4
GSEA and GSVA. A) GSEA analysis showed that TNF-α signaling via the NF-κB signaling pathway was inhibited in IgAN; B) GSEA analysis showed that the apoptosis signaling pathway was inhibited in IgAN; C) GSEA analysis showed that the MTORC-1 signaling pathway was inhibited in IgAN; D) GSVA enrichment analysis of IgAN and normal controls
Identification of optimal diagnostic mRNA biomarkers
After feature selection of 1205 DEmRNAs, 17 important DEmRNAs were obtained (Table 4). The importance of these DEmRNAs was ranked from high to low according to the mean decrease in accuracy value (Fig. 5A). Subsequently, one mRNA was added from top to bottom according to the order of sorting results. The random forest algorithm was used to classify, and the 10-fold cross-validation process was used to calculate accuracy. The results showed that the accuracy reached the maximum value for the first time when the mRNA number reached 8 (Fig. 5B). Therefore, the first 8 DEmRNAs (AKAP8L, ANAPC1, TGFBRAP1, NFKBIA, CD1C, MRPS15, CDC25B and DHX32) were selected as the optimal diagnostic mRNA biomarkers. Heat maps of the 8 mRNA biomarkers are shown in Fig. 5C. Random forest, SVM and decision tree classification models were constructed using 8 mRNA biomarkers. The accuracy of the random forest model is up to 0.9259 (Table 5). In addition, the area under the curve (AUC) in the ROC curve of decision tree, random forest and SVM were 0.844, 0.975, and 0.992, respectively (Fig. 6A-C). In addition, ROC analysis was performed for 8 mRNA biomarkers to evaluate their diagnostic value. The AUC values of 8 mRNA biomarkers were all greater than 0.8 (Fig. 6D-K). The results showed that these 8 mRNAs may be considered as potential diagnostic gene biomarkers in IgAN.
Fig. 5
Machine learning to screen important mRNA biomarkers. A) Sort the importance of the 17 mRNAs according to the mean decrease of accuracy value from high to low; B) Trend graph of accuracy rate increasing with the number of mRNA; C) Heat map of 8 mRNA biomarkers. The rows and columns represent genes and samples, respectively. Orange indicates above the reference channel (high expression genes). Purple indicates below the reference channel (low expression genes)
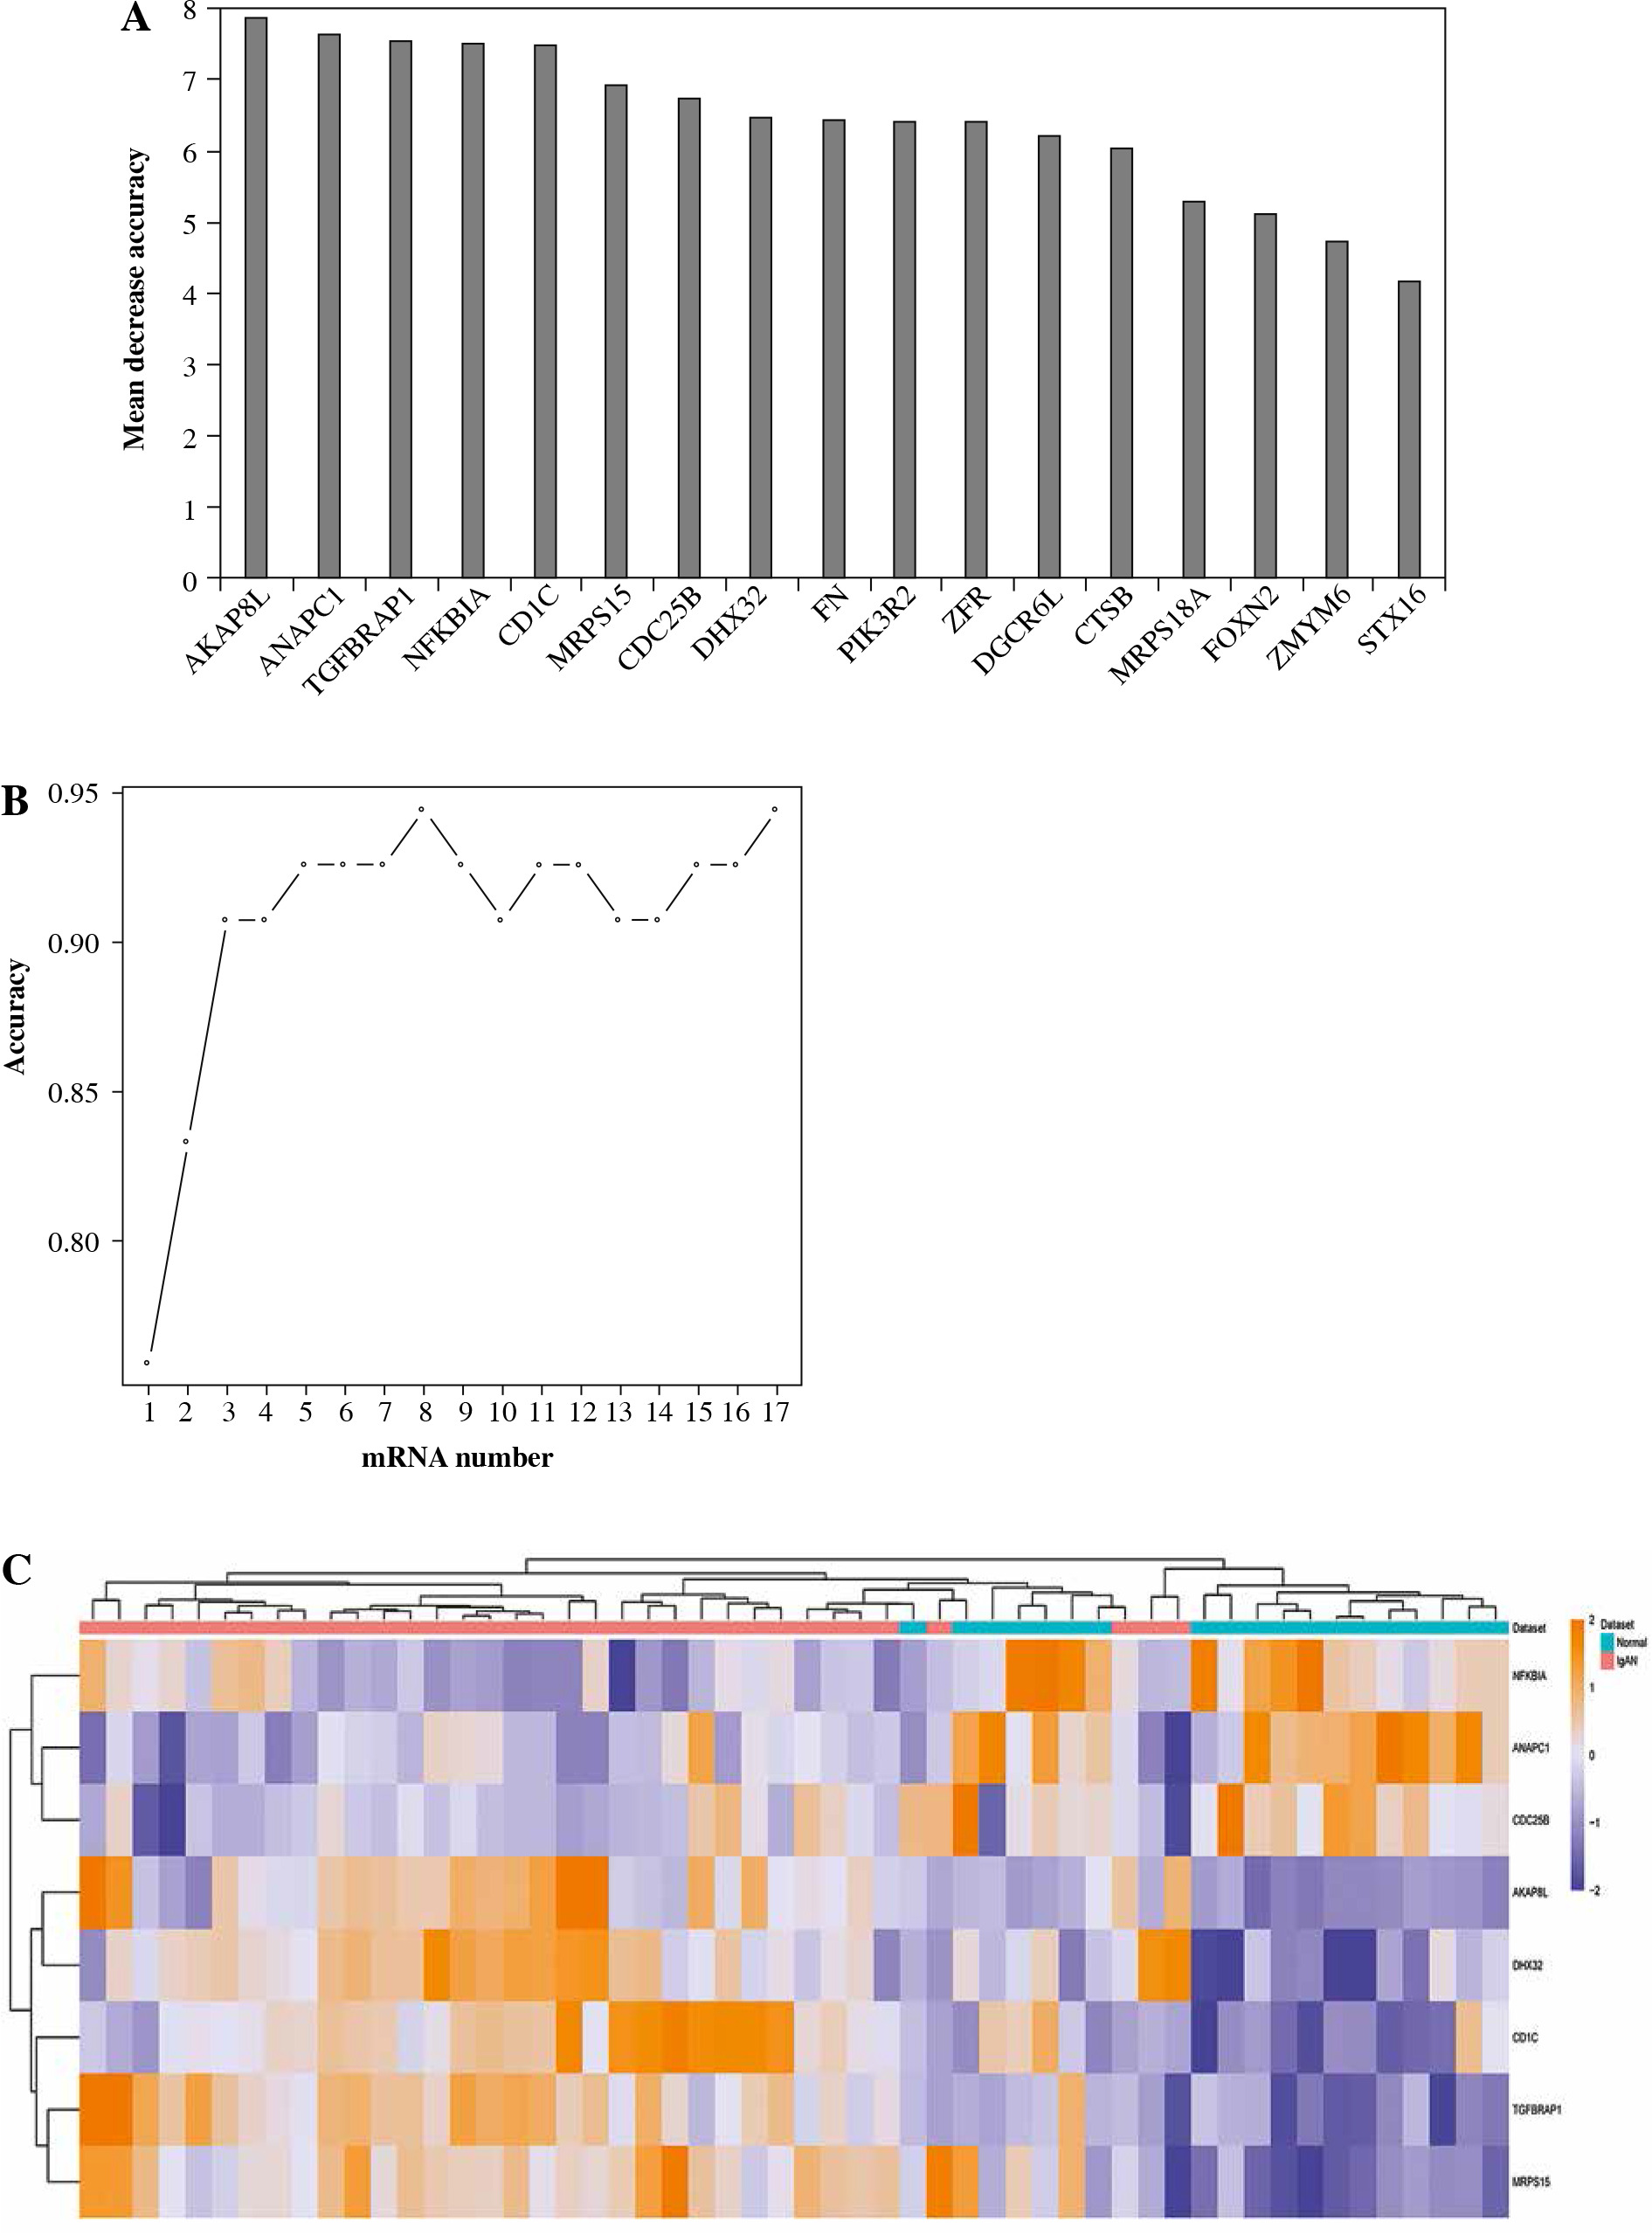
Fig. 6
ROC analysis of classification models and genetic biomarkers. A) ROC curve of decision tree classifier; B) ROC curve of random forest classifier; C) ROC curve of support vector machine (SVM) classifier; D-F) ROC curve of 8 mRNA biomarkers (CDC25B, ANAPC1, DHX32, TGFBRAP1, AKAP8L, MRPS15, CD1C and NFKBIA). AUC – area under curve, ROC – receiver operating characteristic G-K) ROC curve of 8 mRNA biomarkers (CDC25B, ANAPC1, DHX32, TGFBRAP1, AKAP8L, MRPS15, CD1C and NFKBIA). AUC – area under curve, ROC – receiver operating characteristic
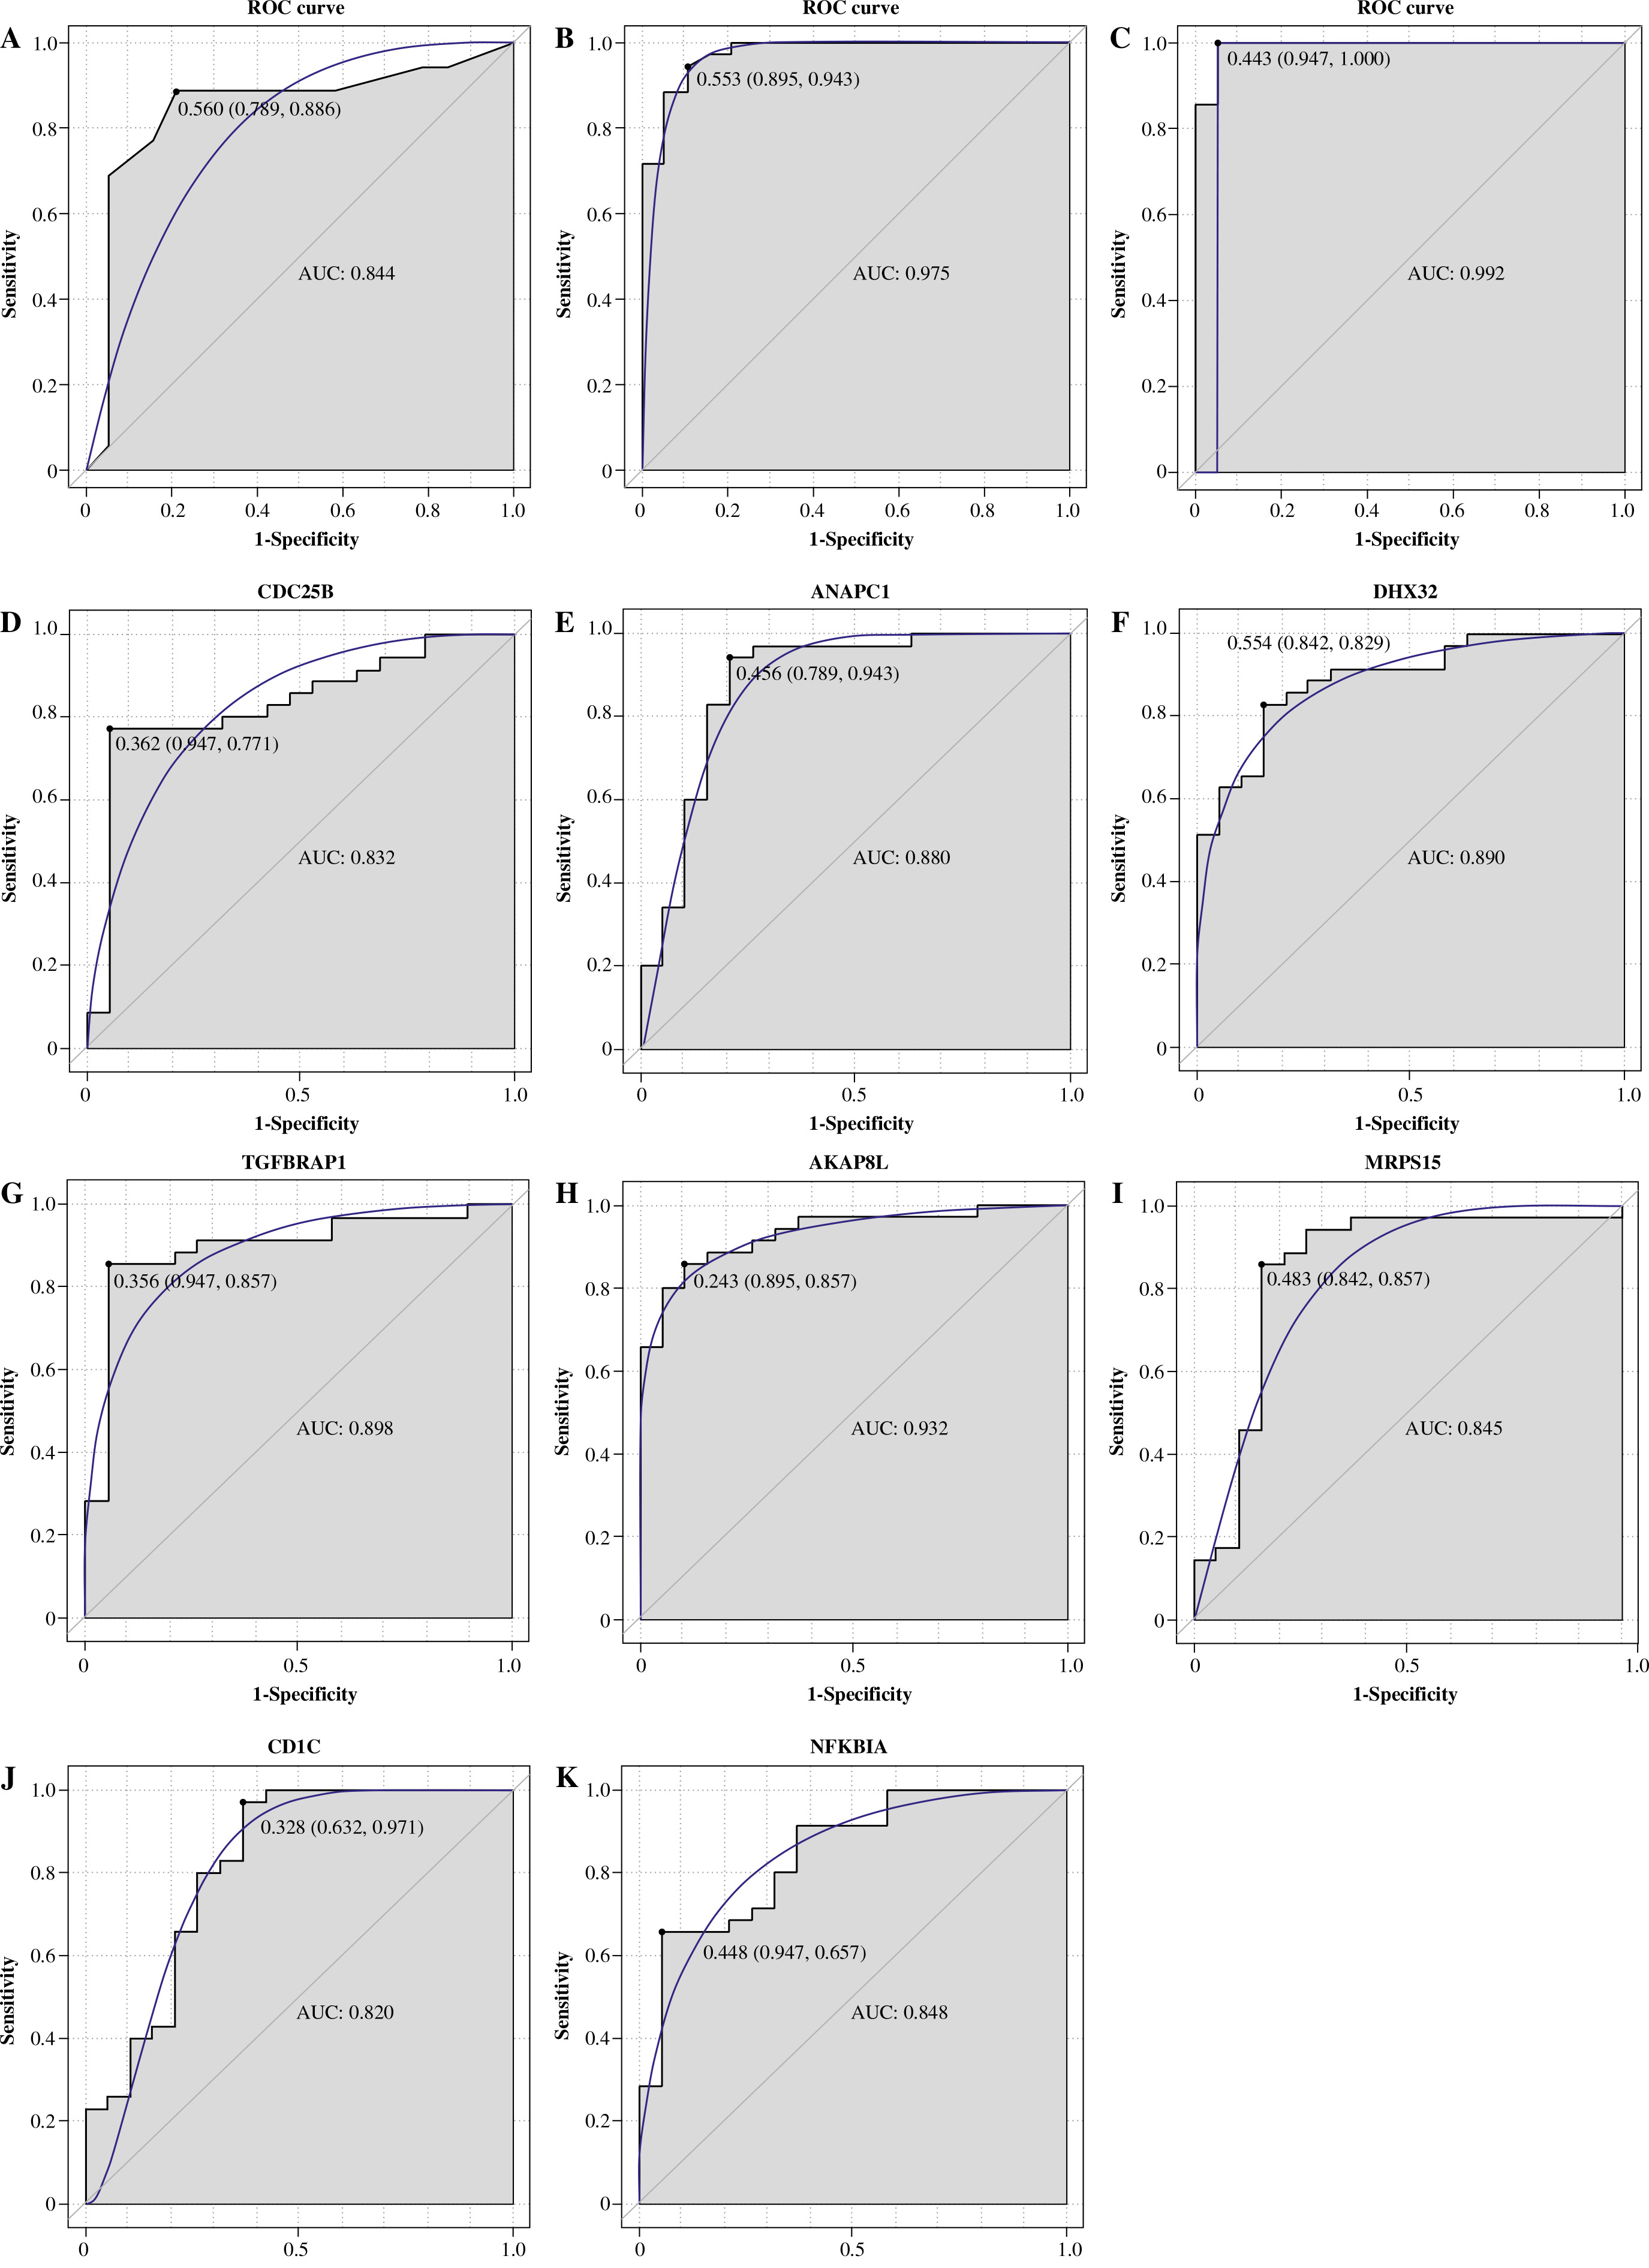
Table 4
17 important DEmRNAs after feature selection
Immune correlation analysis
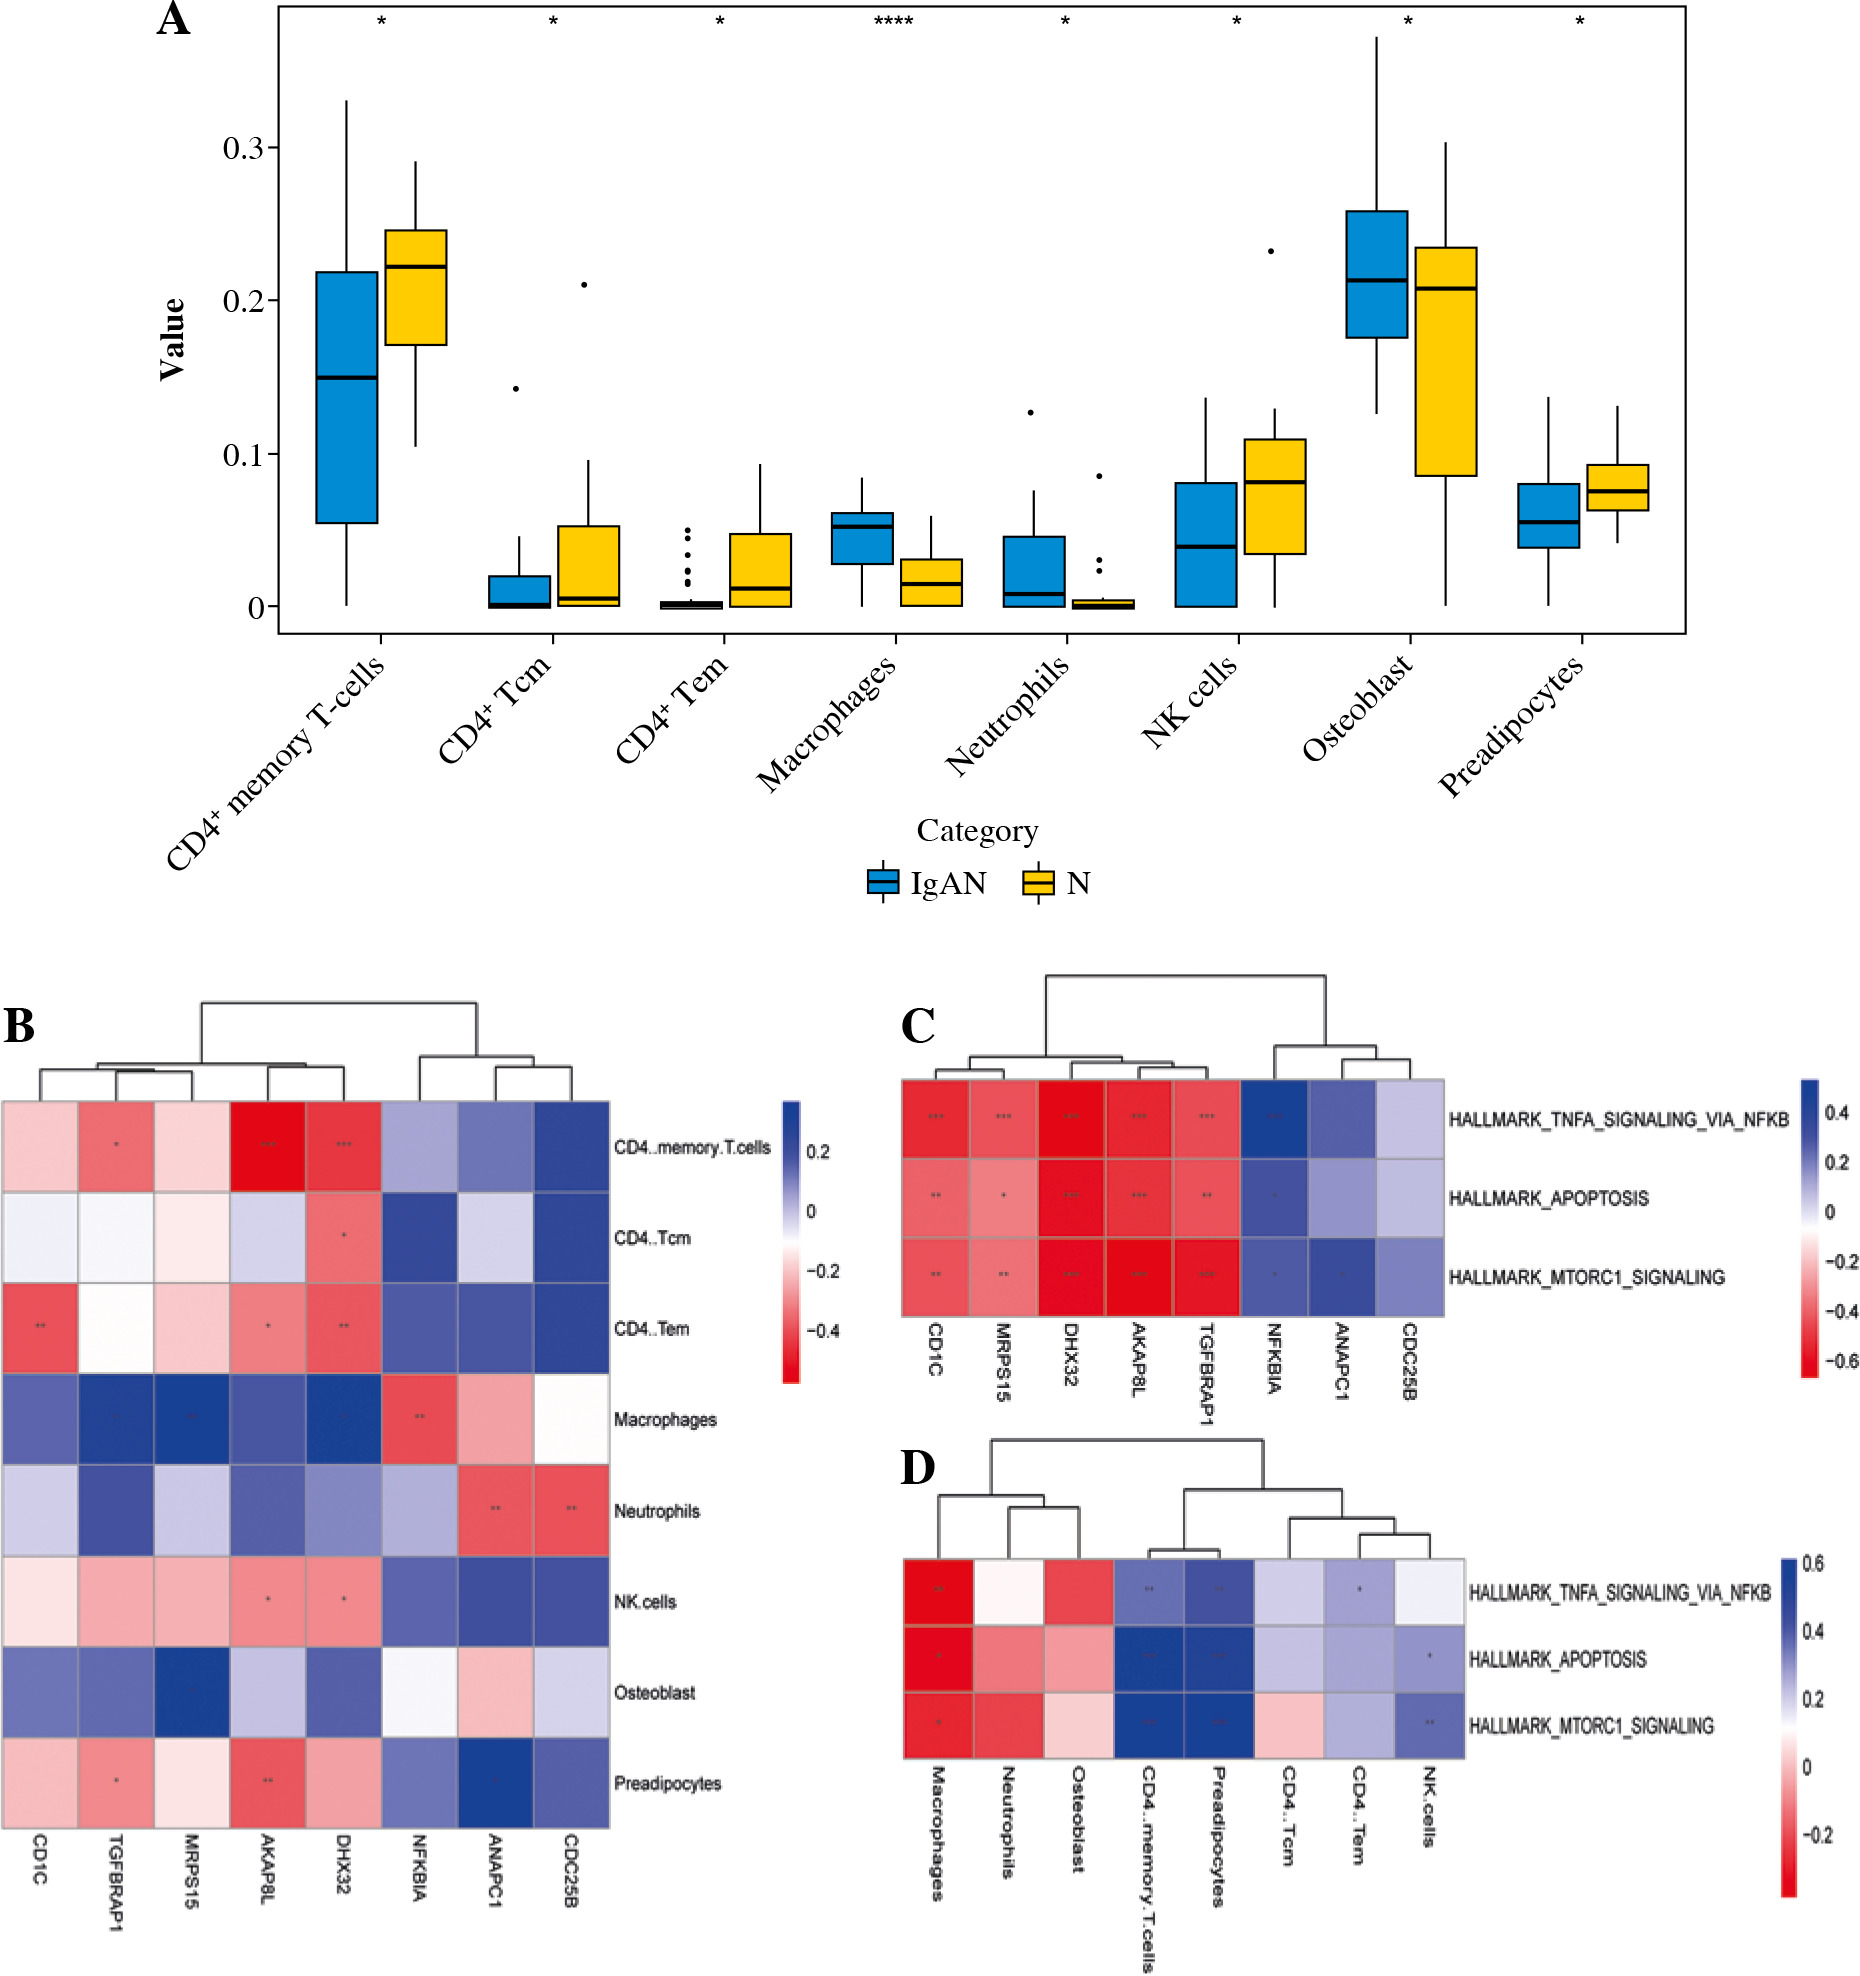
XCell scores were collated into the immune cell infiltrating matrix, and the distribution of 8 immune cell types was shown to be significantly different between normal controls and IgAN by difference analysis (Fig. 7A). Pearson correlation coefficient analysis was employed to calculate the correlation between immune cell types and 8 mRNA biomarkers (Fig. 7B). The results demonstrated that AKAP8L was significantly negatively correlated with CD4+ memory T-cells. Then, Pearson correlation coefficient analysis was employed to calculate the correlation between 8 mRNA biomarkers and TNF-α signaling via NF-κB, apoptosis, MTORC-1 signaling (Fig. 7C). The results showed that AKAP8L was significantly negatively correlated with TNF-α signaling via NF-κB, apoptosis, and MTORC-1 signaling. In addition, the correlations between immune cell types and TNF-α signaling via NF-κB, apoptosis, and MTORC-1 signaling were revealed using Pearson correlation coefficient analysis (Fig. 7D). The results showed that CD4+ memory T-cells were significantly positively correlated with TNF-α signaling via NF-κB, apoptosis, and MTORC-1 signaling.
Fig. 7
Immune correlation analysis. A) The distribution of 8 immune cell types was significantly different between normal controls and IgAN according to difference analysis; B) Pearson correlation coefficient analysis of the correlation between immune cell types and 8 mRNA biomarkers; C) Pearson correlation coefficient analysis of the correlation between 8 mRNA biomarkers and TNF-α signaling via NF-κB, apoptosis, and MTORC-1 signaling; D) Pearson correlation coefficient analysis of the correlation between immune cell types and TNF-α signaling via NF-κB, apoptosis, and MTORC-1 signaling. Blue and red represent positive and negative correlations, respectively. The larger the absolute value of the numerical value, the stronger the correlation. *p < 0.05, **p < 0.01, ***p < 0.001
DEmiRNA-DEmRNA network
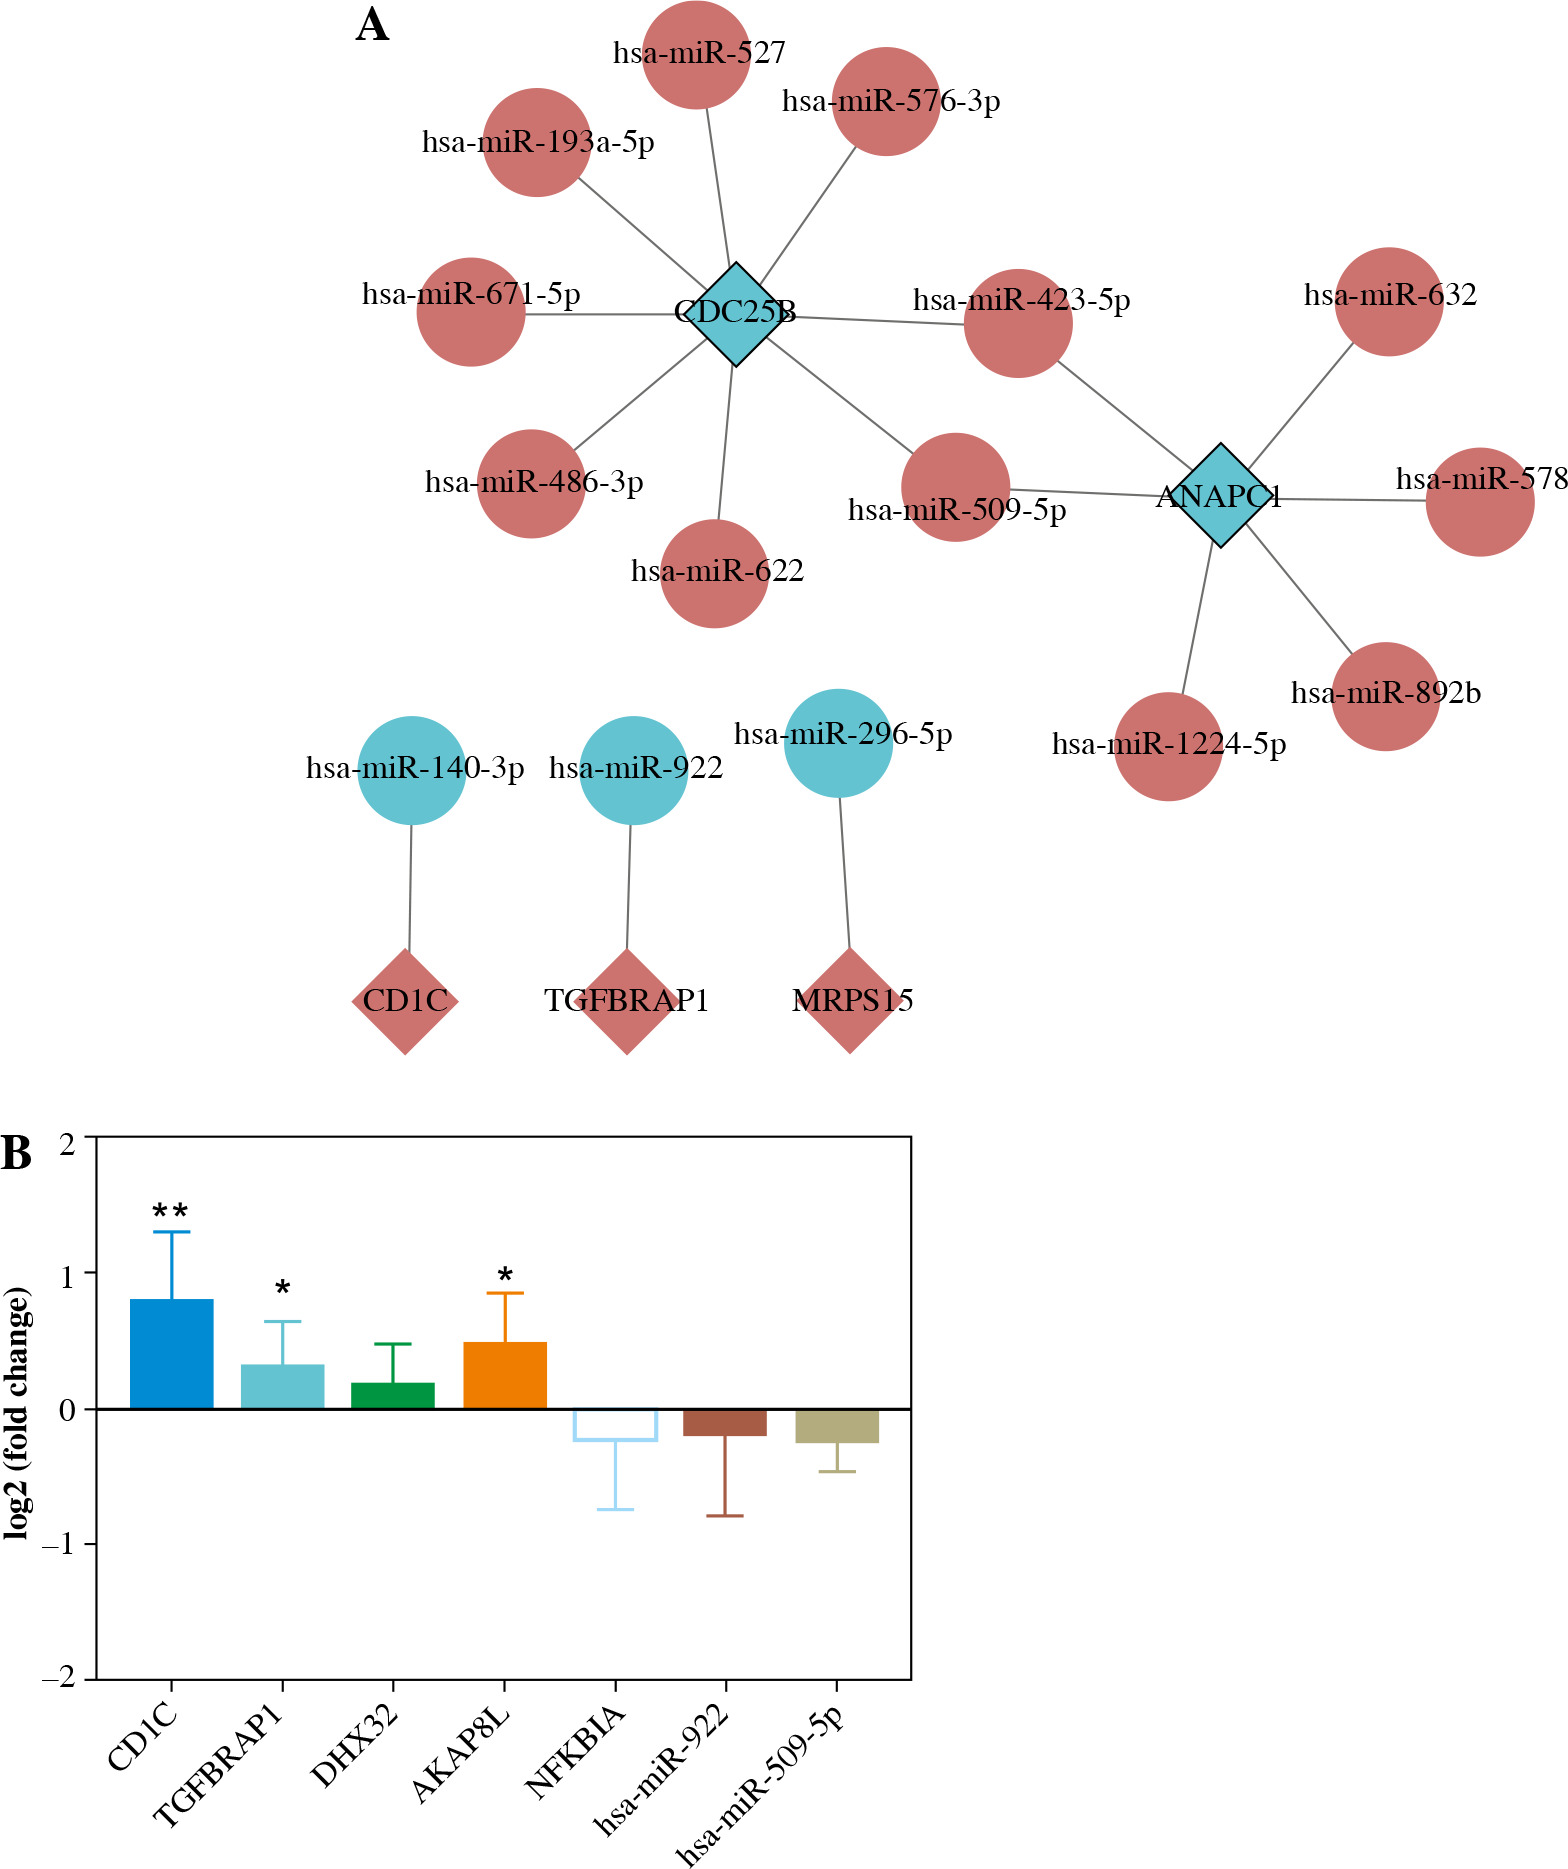
MiRWalk was used to predict DEmiRNA with targeted regulation of 8 mRNA biomarkers. After screening, 17 negative regulatory targeting pairs were obtained (Fig. 8A). Only 5 mRNA biomarkers predicted corresponding negative regulatory miRNAs (Fig. 8A).
Fig. 8
Construction of DEmRNA-DEmiRNA network and real time-PCR validation. A) DEmRNA-DEmiRNA interaction network. Rhombus, circles, blue and red represent mRNA, miRNA, down-regulation, and up-regulation, respectively. Different shapes in bold outside represent the top 10 genes. B) Real-time PCR validation of CD1C, TGFBRAP1, DHX32, AKAP8L, NFKBIA, hsa-miR-922 and hsa-miR-509-5p in blood. According to log 2 fold change > 0 or log 2 fold change < 0, it can be clearly seen whether the gene was up-regulated or down-regulated. *p < 0.05, **p < 0.01
In vitro validation
Based on the GEO integration analysis results, AKAP8L, TGFBRAP1, NFKBIA, CD1C, DHX32, hsa-miR-922 and hsa-miR-509-5p were selected for real time-PCR validation (Fig. 8B). All primers are shown in Table 6. CD1C, TGFBRAP1, DHX32 and AKAP8L were up-regulated, and NFKBIA and hsa-miR-922 were up-regulated in IgAN. Among them, CD1C, TGFBRAP1 and AKAP8L showed a significant difference. In addition, expression trends of these genes were consistent with the results of bioinformatics analysis. However, we found that the expression trend of hsa-miR-509-5p was contrary to the results of bioinformatics analysis. The differences between bioinformatics and real time-PCR results may be due to the small sample size, heterogeneity between patients, and RNA degradation during extraction or preservation. Further research is needed.
Table 6
Primer sequences in RT-PCR
Discussion
Immunoglobulin A nephropathy is the most common glomerular disease worldwide, with a poor prognosis [28]. In this study, 8 important mRNA biomarkers (AKAP8L, ANAPC1, TGFBRAP1, NFKBIA, CD1C, MRPS15, CDC- 25B and DHX32) were screened based on machine learning. Then, the correlation between 8 mRNA biomarkers, immune cell types and signaling pathways were analyzed using Pearson’s correlation coefficient. Subsequently, Pearson correlation analysis demonstrated that AKAP8L was significantly negatively correlated with CD4+ memory T-cells, TNF-α signaling via NF-κB, apoptosis, and MTORC-1 signaling. In addition, CD4+ memory T-cells were significantly correlated with TNF-α signaling via NF-κB, apoptosis, and MTORC-1 signaling. Finally, a DEmRNA-DEmiRNA network was constructed.
So far, we have not found any correlation study of A-kinase anchoring protein 8 like (AKAP8L) in nephropathy. Knockdown of AKAP8L suppressed the commitment of human hematopoietic stem cells to the erythroid lineage and cell proliferation and delayed differentiation of colony-forming unit-erythroid to the proerythroblast stage [29]. AKAP8L deletion significantly reduced human embryonic kidney 293A (HEK293A) cell size and proliferation [30]. It can also be involved in the regulation of tumor growth and the progression of diabetic liver disease [31, 32]. Moreover, high expression of AKAP8L in esophageal squamous cell carcinoma is associated with poor prognosis [33]. In this study, AKAP8L was found to be an important mRNA biomarker and was significantly negatively correlated with CD4+ memory T-cells. CD4+ memory T-cells can promote the effector response of other immune cells in the immune system and play an important regulatory role in a variety of diseases [34, 35]. Dysregulation of CD4+ memory T-cells played a role in the immune defects of chronic kidney disease patients [36]. In addition, it has been reported that the number of CD4+ memory T-cells in IgAN patients is abnormal. The IgAN patients’ peripheral blood has a special immune pattern [14]. Therefore, it is speculated that the up-regulation of AKAP8L may mediate down-regulation of the CD4+ memory T-cell infiltration level, thus affecting the immune regulatory mechanism of IgAN. In addition, AKAP8L was also significantly negatively correlated with TNF-α signaling via NF-κB, apoptosis, and MTORC-1 signaling. TNF-α signaling via NF-κB induces epithelial-mesenchymal transformation of renal cell carcinoma cells [37]. In diabetic nephropathy, podocyte injury is associated with abnormality of the NF-κB/TNF-α signaling pathway in macrophages [38]. Cytotoxin-associated antigen A (CagA) promotes proliferation and secretion of extracellular matrix by inhibiting the apoptosis signaling pathway of rat mesangial cells, thus inducing injury of mesangial cells [39]. MTORC-1 signaling plays a vital regulatory role in normal kidney fibrogenesis [40]. mTOR is an important mediator of CD4+ T-cells. Moreover, inhibition of mTORC1 in myeloid dendritic cells increased proinflammatory factors [41]. Therefore, we speculated that AKAP8L may play a vital mediating role in disease progression by mediating TNF-α signaling via NF-κB, apoptosis and MTORC-1 signaling. In addition, identification of AKAP8L and related signaling pathways and immune cells will contribute to the study of IgNA pathogenesis and immunotherapy.
Although we have not found relevant studies on anaphase promoting complex subunit 1 (ANAPC1) in nephropathy, previous studies have found that ANAPC1 plays an important regulatory role in colitis-associated colon cancer [42], gastric cancer [43], Rothmund-Thomson syndrome [44] and other diseases. In this study, we found that the AUC value of ANAPC1 was 0.880. Therefore, we speculated that ANAPC1 act as a potential diagnostic biomarker for IgAN. Hsa-miR-509-5p was found to negatively regulate ANAPC1 in the DEmRNA-DEmiRNA network. In renal cell carcinoma, the abnormal expression of hsa-miR-509-5p affects cell proliferation, migration and apoptosis [45]. Hsa-miR-509-5p can also influence inflammatory responses by targeting relevant genes [46]. Therefore, we hypothesized that the role of ANAPC1 in IgAN was regulated by hsa-miR-509-5p. In addition, hsa-miR-509-5p negatively regulates the cell division cycle 25B (CDC25B) in the DEmRNA-DEmiRNA network. Abnormal expression of CDC25B affects the proliferation and migration of renal cell carcinoma cells [47]. Up-regulation of CDC25B can protect lens epithelial cells from oxidative stress [48]. Moreover, in this study, the AUC value of CDC25B was 0.832. This indicates that CDC25B plays a vital role in IgAN.
We found that hsa-miR-922 negatively regulates transforming growth factor β receptor associated protein 1 (TGFBRAP1) in the DEmRNA-DEmiRNA network. So far, we have not found a correlation study between hsa-miR-922 and TGFBRAP1 in nephropathy. However, TGFBRAP1 was found to be associated with diabetes and liver damage [49, 50]. Hsa-miR-922 also was found to be associated with liver damage [51]. Therefore, we hypothesized that TGFBRAP1 may play a regulatory role in IgAN progression, and this regulation may be regulated by hsa-miR-922.
MiR-381-3p affects the cellular immune response by targeting the CD1c molecule (CD1C) to regulate the antigen presentation capacity of dendritic cells [52]. Hsa-miR-140-3p can affect the growth of mesangial cells by regulating dachshund family transcription factor 1 (DACH1) and then participate in the regulation of IgAN development [53]. Hsa-miR-140-3p expression is down-regulated in chronic kidney disease and participates in the regulation of multiple biological pathways through targeted mRNAs [54]. In this study, hsa-miR-140-3p was found to negatively regulate CD1C in the DEmRNA-DEmiRNA network. Therefore, we speculated that CD1C may play a vital role in IgAN progression through the targeted regulation of hsa-miR-140-3p.
As a mitochondrial ribosomal protein gene, mitochondrial ribosomal protein S15 (MRPS15) plays a vital role in early embryonic development and cancer [55, 56]. Hsa-miR-296-5p is involved in the regulation of cervical cancer [57], liver cancer [58] and thoracic aortic aneurysm [59]. In addition, hsa-miR-296-5p can participate in host antiviral defense and play an important role in virus infection [60, 61]. So far, we have not found a correlation study between hsa-miR-296-5p and MRPS15 in nephropathy. This article may present the first discovery that hsa-miR-296-5p and MRPS15 are abnormally expressed in IgAN. Moreover, in this study, hsa-miR-296-5p negatively regulated MRPS15 in the DEmRNA-DEmiRNA network. The discoveries of hsa-miR-296-5p and MRPS15 provide new ideas for future studies of IgAN research.
In this study, we found that NFKB inhibitor alpha (NFKBIA) was abnormally expressed in IgAN. NFKBIA is an important inflammatory response gene, and its polymorphism can be used as a biomarker to predict the risk of acute kidney injury in children [62]. Dominant-negative NFKBIA mutation leads to hepatic disease with severe immune deficiency [63]. DEAH-box helicase 32 (DHX32) can induce vascular endothelial growth factor A (VEGFA) expression by enhancing the β-catenin signaling pathway to promote angiogenesis [64]. Previous studies have found that DHX32 may be involved in the differentiation of normal lymphocytes [65]. DHX32 may also be involved in regulating the response of T cells to certain apoptotic stimuli [66]. In this study, DHX32 was also significantly correlated with CD4+ memory T-cells in IgAN. In addition, the AUC values of NFKBIA and DHX32 were both greater than 0.8. Therefore, we speculated that NFKBIA and DHX32 play an important regulatory role in IgAN. Identification of NFKBIA and DHX32 provides potential directions for further research on the molecular mechanism of IgAN.
Although the above findings have opened up new directions for the molecular research of IgAN, this research still has certain limitations. Firstly, there is a certain degree of error between the real time-PCR results and the bioinformatics analysis results, so it is necessary to collect samples for further research. Secondly, the specific molecular mechanism of the genes identified in IgAN is still unclear.
Conclusions
In this study, GSEA analysis revealed that TNF-α signaling via NF-κB, apoptosis and MTORC-1 signaling were inhibited in IgAN. Then, 8 important mRNA biomarkers (AKAP8L, ANAPC1, TGFBRAP1, NFKBIA, CD1C, MRPS15, CDC25B and DHX32) were screened based on machine learning. Subsequently, the distribution of 8 immune cell types was shown to be significantly different between normal controls and IgAN by difference analysis. Pearson correlation analysis demonstrated that AKAP8L was significantly negatively correlated with CD4+ memory T-cells, TNF-α signaling via NF-κB, apoptosis, and MTORC-1 signaling. Finally, 5 mRNA biomarkers (ANAPC1, TGFBRAP1, CD1C, MRPS15 and CDC25B) predicted corresponding negative regulatory miRNAs. Therefore, we hypothesized that AKAP8L, ANAPC1, TGFBRAP1, CD1C, MRPS15 and CDC25B play important roles in the progression of IgAN, and the specific molecular mechanism deserves further study. These results provide new ideas for understanding IgAN and potential directions for further research on the molecular mechanism of IgAN.