
Introduction
Smoking is a key environmental factor in inflammatory bowel diseases (IBD), increasing the risk for Crohn’s disease, but – surprisingly – being one of the strongest known protective factors against ulcerative colitis [1]. This effect does not depend on nicotine alone [2] and is hypothesized to relate to the aryl hydrocarbon receptor (AHR), the activation of which is beneficial in colitis [3], with a number of mechanisms that may be involved. Therefore, dissection of the impact of smoking on the immune system is a research topic with potential therapeutic implications in ulcerative colitis.
The use of high-throughput technologies, including methylome and transcriptome profiling, has enabled unprecedented insight into the effects of smoking on human biology. Most notably, the influence of smoking on methylation across hundreds of thousands of CpG islands has been determined in whole blood and also in selected tissues. Nevertheless, our knowledge of the effects of smoking in individual cell types remains scarce. CD14+ monocytes/macrophages were explored in the Multi- Ethnic Study of Atherosclerosis (MESA), where altered methylation of AHRR and F2RL3, previously found in the whole blood, was confirmed [4, 5]. Yet, altered methylation of LRRN3, which provides arguably the strongest smoking-related transcriptomic signal, was not detected in CD14+ cells. Su et al. found that smoking-related changes in methylation levels of a number of smoking-related genes (including AHRR, ALPPL2, GFI1) were most pronounced in granulocytes, but not in B cells [6]. In the same study the colon homing receptor GPR15, associated with smoking in whole blood, was differentially methylated in smokers’ T and B lymphocytes [6] and integrin subunit gene ITGAL (required for LFA-1 formation) methylation was only changed in T cells. A deconvolution-based study of myeloid- and lymphoid-specific changes in methylation attributable to smoking showed a tendency towards hypo- methylation of typical targets in myeloid cells (AHRR, GFI1, ALPPL2) and hypomethylation of GPR15 in lymphocytes, in line with findings from Su et al. [5].
Bauer et al. replicated smoking-induced GPR15 and AHRR gene overexpression [7]. Additionally, they performed RNA sequencing in GPR15+ vs. GPR15– T cells (CD3+) and drew attention to the association of GPR15 gene expression with frequency of smoking-induced GPR15+ T cells [8]. Tsaprouni et al. found that GPR15 overexpression and also that of CPOX (located near GPR15) and AHRR were associated with smoking [9]. Paul and Amundson showed smoking-related increases in GPR15 and AHRR gene expression (2- and 5-fold, respectively) [10]. In a meta-analysis of transcriptomic studies, Huan et al. confirmed the positive association of GPR15 (and also LRRN3, CLEC10A, LEF1) with smoking, but could not replicate AHRR [11]. In addition to Su et al. demonstrating differences in DNA methylation in separated leucocytes, Bauer et al. reported that a single CpG in AHRR in granulocytes was implicated. Both the level of methylation at this CpG and the frequency of GPR15+CD3+ T cells were considered strong biomarkers for distinguishing smokers from non-smokers [12].
Since GPR15 is a homing receptor for lymphocytes into the colon, it is of special importance in the context of the protective influence of smoking against ulcerative colitis. We showed that GPR15 expression in whole blood is associated with smoking in a cohort of patients with IBD (IBD-Character) [13]. A context for the interpretation of this finding was provided by Xiong et al. In their experiments AHR activation could increase GPR15 expression in regulatory T lymphocytes, in cooperation with FOXP3, leading to inflow of immunosuppressive GPR15+ Treg cells into the colon [14].
A large analysis of whole blood transcriptomes underscored overexpression of LRRN3 and GPR15 in smokers [11], and this is indeed a consistent finding across different studies [15]. Notwithstanding, many questions about the influence of smoking on specific immune cell types remain open with regard to a broad range of genes. Smoking-related transcriptomic changes are evident, but their origin remains uncertain. As highlighted by Bauer, work focusing on individual cell types is necessary to understand processes behind changes in the whole blood [16]. Single-cell analysis promises to extend our understanding of the relationship between smoking and immunity even further. However, smoking-related single-cell studies thus far have focused on the airway epithelium [17, 18] and a rationale is needed to fuel such advanced investigations in the context of autoimmunity.
To further our knowledge of smoking-related changes in the immune system, we explored a large dataset from the CEDAR [19] study, made publicly available by Momozawa et al. We aimed to define smoking-related characteristics of gene expression profiles in CD4+, CD8+, CD14+, CD15+, and CD19+ cells.
Material and methods
The complete transcriptomic dataset from the Correlated Expression and Disease Association Research (CEDAR) study was obtained from ArrayExpress (E-MTAB-6667) [19]. Briefly, volunteers were recruited within a colon cancer screening program and a number of tissues and cells were collected, including immunomagnetically separated cells [19]. Only participants classified as healthy with available data on smoking status were included in this reanalysis.
Transcriptomic data processing and differential expression analysis
The data were read using read.idat from limma, with the appropriate manifest file (Illumina Human HT-12 V4 R2), filtering out microarrays having an estimated proportion of expressed probes < 10% (propexpr). Background correction and quantile normalization were conducted using the neqc function. The obtained expression matrix was then subject to batch correction using the ComBat function from the sva package, with batches identified from microarray plate numbers. The log2 expression (plus offset) of most control probes was within the range 4.5-4.6, with the highest control probe value just below 4.9. Therefore, the complete batch-corrected dataset was filtered to include only probes with median expression > 5, reducing the number of probes from 47,323 to 19,932. This also led to exclusion of GPR15. Furthermore, a correlation analysis was conducted as a quality check to detect outlying samples with a median correlation with all other samples smaller than the 5th centile (r < 0.861). These samples were excluded to maximize the cohesion of the dataset. Principal component analysis revealed moderate sample clustering by cell type. Samples with incomplete phenotype data (n = 25) were removed. Data obtained from CD4+, CD8+, CD14+, CD15+, and CD19+ cells were extracted. Differential expression analysis was conducted using limma (lmFit and eBayes) by cell type, compensating for age, sex, and body mass index. P values were adjusted using the false discovery ratio procedure (Benjamini-Hochberg). Differentially expressed genes were subject to fuzzy clustering (squared Euclidean distances) and visualized (cluster and factoextra R packages).
Differential ratio analysis with intermediary inference (DRAIMI)
In order to supplement differential expression analysis and gain insights into genes involved in the observed difference, we performed immune-focused differential ratio analysis with intermediary inference (DRAIMI). DRAIMI identifies top differentially expressed transcript ratios to make it possible to find the most common directly linked intermediators within a protein-protein interaction network. Thus, DRAIMI approaches the transcriptomic data in a new way to facilitate integration of a large external data source and help generate hypotheses about molecular processes. Details of DRAIMI along with an example of its use are provided elsewhere [13].
Genes pertaining to a specific pathway were selected for DRAIMI as required, in this case 2078 genes from the major Reactome immunity pathway, which were present in the dataset. The analysis needed to be targeted because random-access memory required for DRAIMI grows exponentially with the number of genes. A 100-fold bootstrap analysis was performed: 10 smokers and 10 controls were randomly selected, and the gene ratios were compared using the Mann-Whitney U test. Ratios were then sorted by the median p value from the 100 repetitions of analysis, obtaining the most highly consistent results. The top 1000 differentially expressed ratios were then overlaid on the Reactome protein-protein interaction network to infer proteins directly linking the products of genes forming the ratios. An intermediary score was obtained and then corrected for the number of interactions in the protein- protein interaction networks (i.e., a ratio of the number of interactions identified on the basis of top 1000 ratios vs. the number of all interactions of the given protein in the network).
Investigation of the similarity to immune cell transcriptomic profiles
CIBERSORTx is a tool widely used to deconvolute cell types from bulk expression profiling data. LM22 is the main immune cell signature set used with CIBERSORTx. Here, CIBERSORTx was used on transcriptomes from immunomagnetically sorted cells. This was done to identify shifts in transcriptomic profiles that would resemble key characteristics of specific immune cells. As an example, CIBERSORTx profiles of CD4+ cells in one group may show a relative enrichment in transcriptomic characteristics of NK cells. CIBERSORTx was run with quantile normalization. Student’s t-test was used to compare the obtained similarity scores between smokers and non-smokers.
Random forests and elastic net regression: a supplementary analysis
To explore other effects in the available data, we used random forests and elastic net regression as implemented in the packages ranger and glmnet, with five repeats of 10-fold cross-validation (caret) and down-sampling, aiming at maximalization of the area under the receiver- operating characteristic curve. Random forests (n = 101 trees) were grown with mtry values of 1-12, the minimum node size of 2, and three split rules (Gini, extratrees and Hellinger). The elastic net tuning grid comprised 1000 alpha and lambda combinations over 10 alpha values. The varImp function was used to extract information on the relative contribution of variables to the best random forest and elastic net regression models. The cut-off importance of 50 was chosen arbitrarily. Gene ontology analysis was done using the Broad Institute’s Gene Set Enrichment Analysis with the hallmark gene set.
Results
The CEDAR study recruited healthy adult Europeans (median age 54.6 years) with a smoking rate of 21.6% and obesity rate of 15.7% with no other important medical conditions (Table 1). The smokers were younger than controls (p < 0.001), necessitating a correction of differential expression analyses. Whereas 52 genes were found to be upregulated, 42 were downregulated (Table 2, Supplementary Table 1). Most of the differentially expressed genes were found in CD4+ and CD8+ T lymphocytes (n = 72), and CD14+ macrophages/monocytes (n = 20). Notably, no differentially expressed genes were found in CD15+ cells (polymorphonuclear leukocytes).
Table 1
Basic group characteristics. The CEDAR cohort recruited healthy Europeans
| Paąrameter | All | Smokers | Non-smokers |
|---|---|---|---|
| n | 273 | 59 | 214 |
| Smoking | 59 (27.6%) | 59 (100%) | 0 (0%) |
| Age (years) | 54.6 ±13.4 | 49.2 ±11.9 | 56.1 ± 13.4 |
| Gender (female) | 54.6% | 59.3% | 53.3% |
| BMI (kg/m2) | 26.0 ±4.4 | 25.0 ±4.6 | 26.2 ± 4.3 |
Table 2
Number of genes up- and downregulated depending on smoking in each cell type and detailed counts of analyzed samples
CD4+ cells (T lymphocytes, helper)
LRRN3, a signature gene of smoking, was the most overexpressed in CD4+ cells (Table 3). LRRN3 alone could differentiate between smokers and non-smokers with AUC of 0.75 (95% CI: 0.68-0.82). The most underexpressed genes were KLRB1 and IRF1, followed by six other genes, including IL18RAP (Figs. 1, 2). Clustering of differentially expressed genes indicated that two different LRRN3 transcripts were related, but could still be assigned to two different clusters, the first of which also included IRF1, while the second contained IL18RAP and KLRB1 (Fig. 3).
Fig. 1
Volcano plot of genes under- (left) and overexpressed (right) in CD4+ cells (T lymphocytes, helper) from smokers vs. non-smokers. All statistically significant findings are labeled
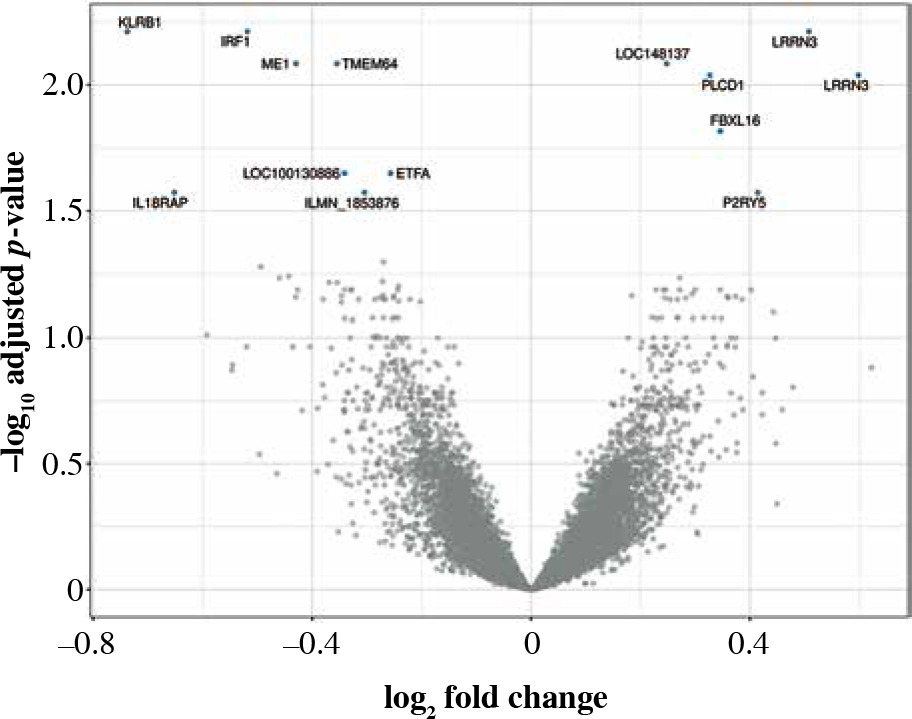
Fig. 2
Box and violin plots of the expression of most strongly differentially expressed genes in CD4+, cells depending on smoking status. Some additional genes with important roles in immunity are also included (il18raP, itGb7, itGal, Cybb). The expression level of CD8+ and CD14+ control probes was approximately 5
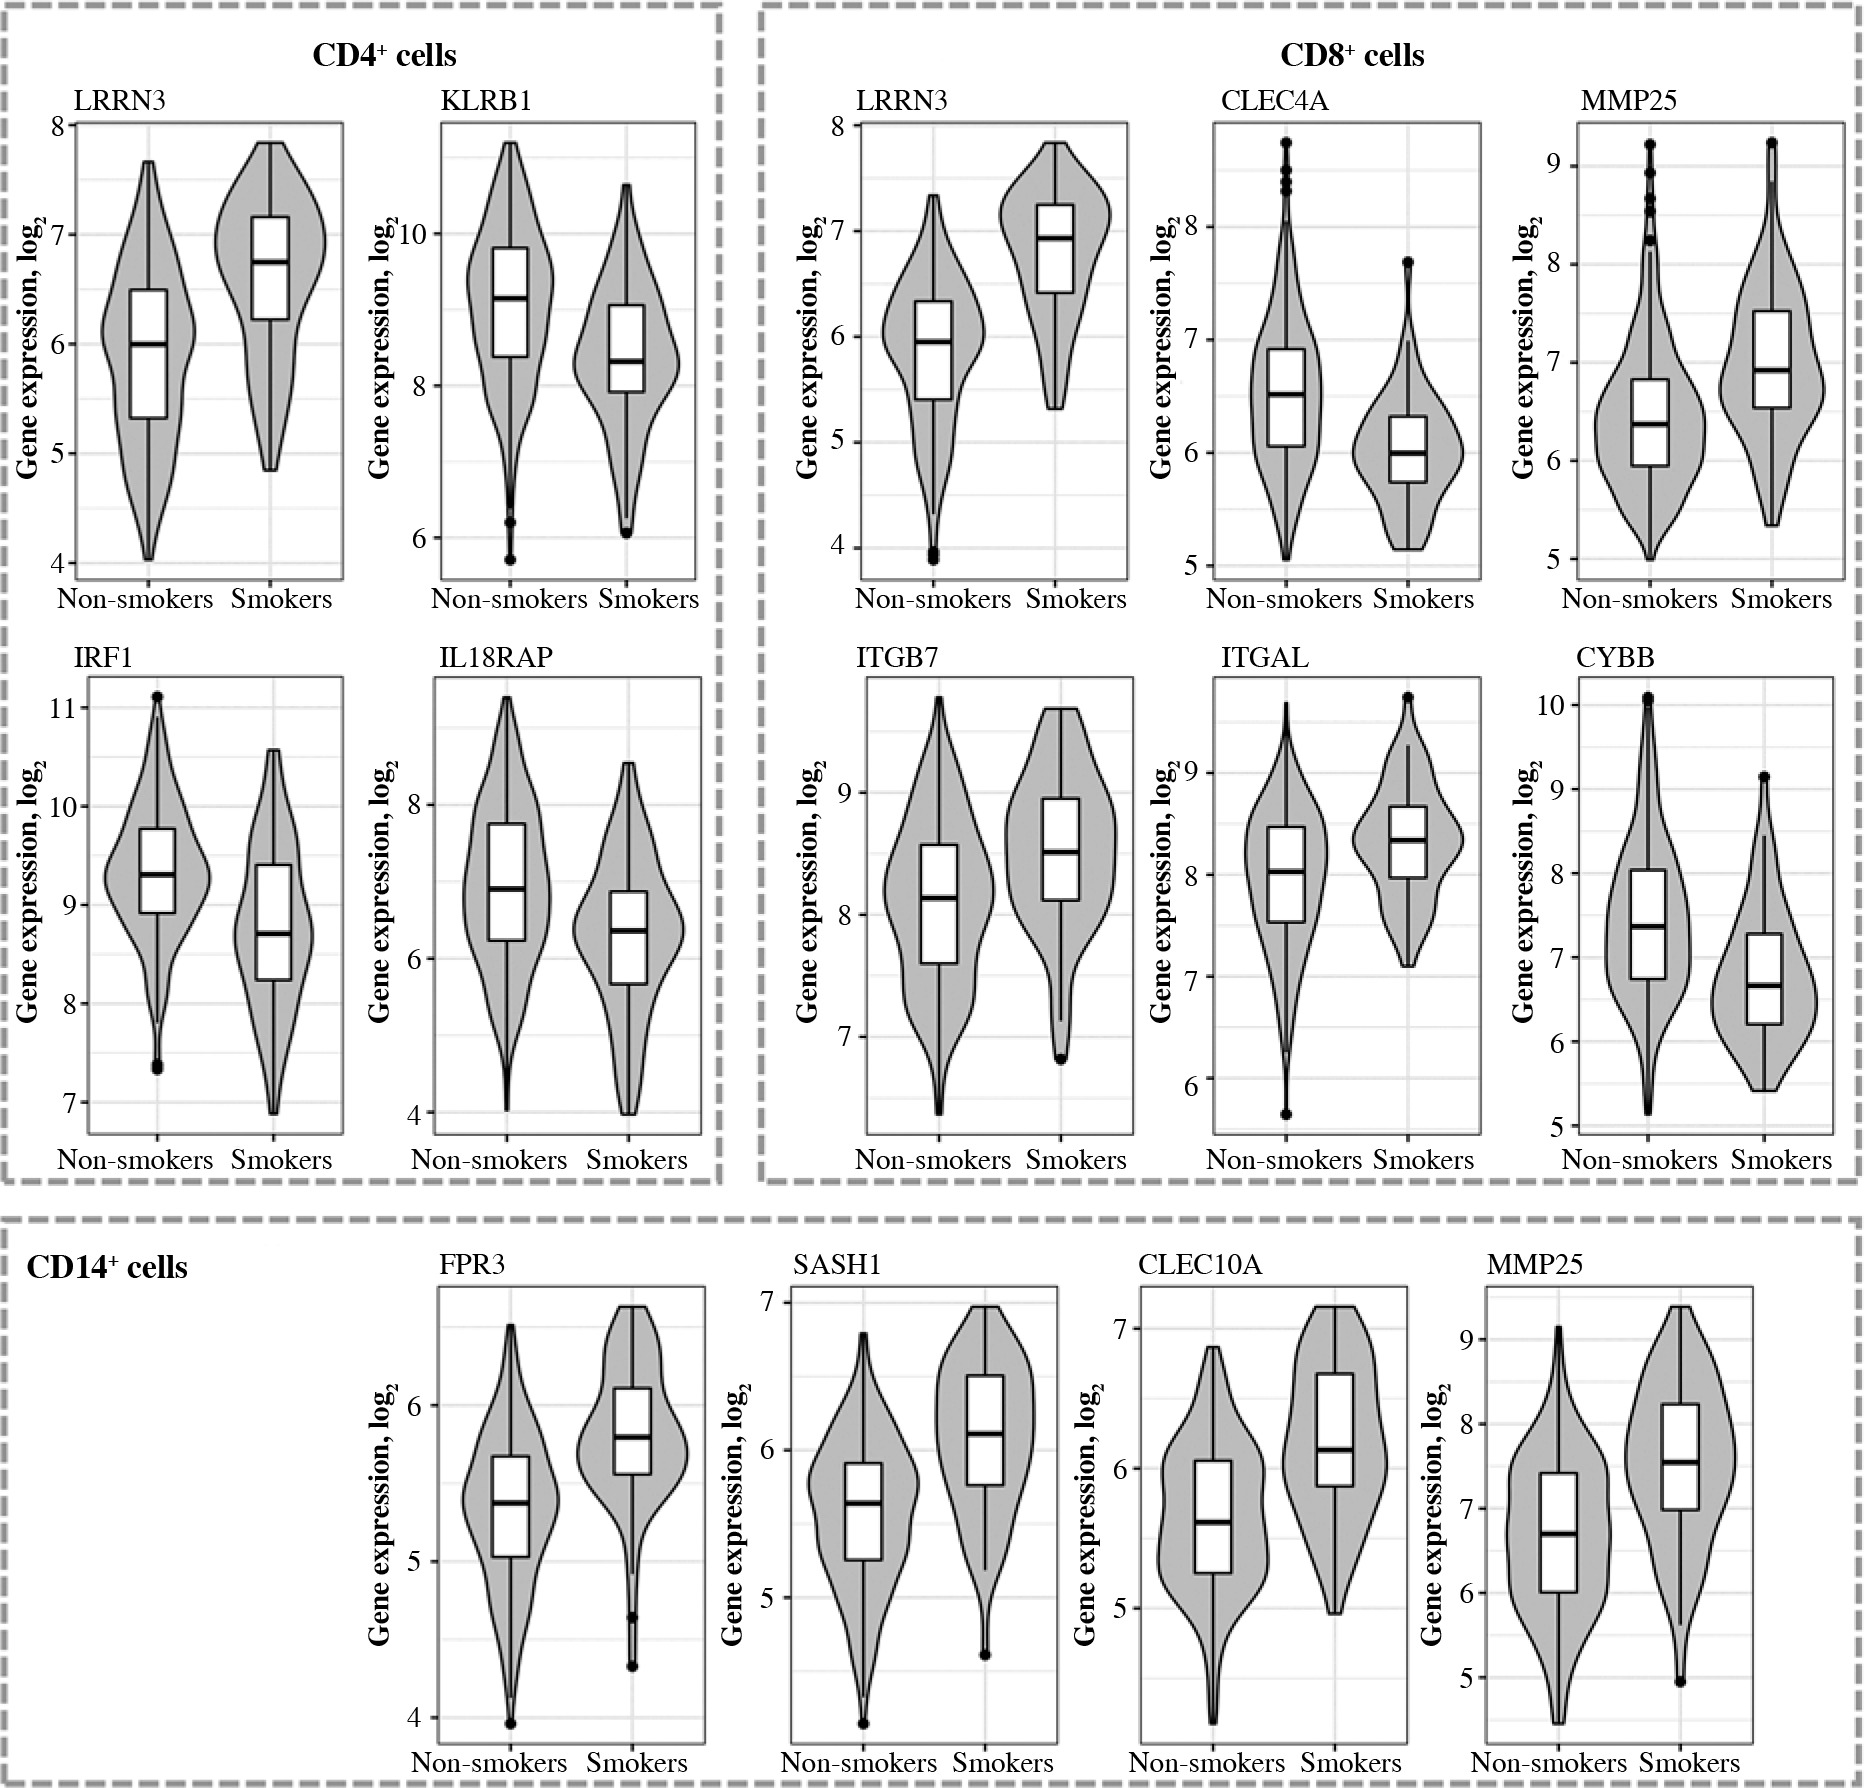
Fig. 3
Fuzzy clustering of genes differentially expressed in CD4+ cells depending on smoking status. The number of clusters was arbitrarily set at 2
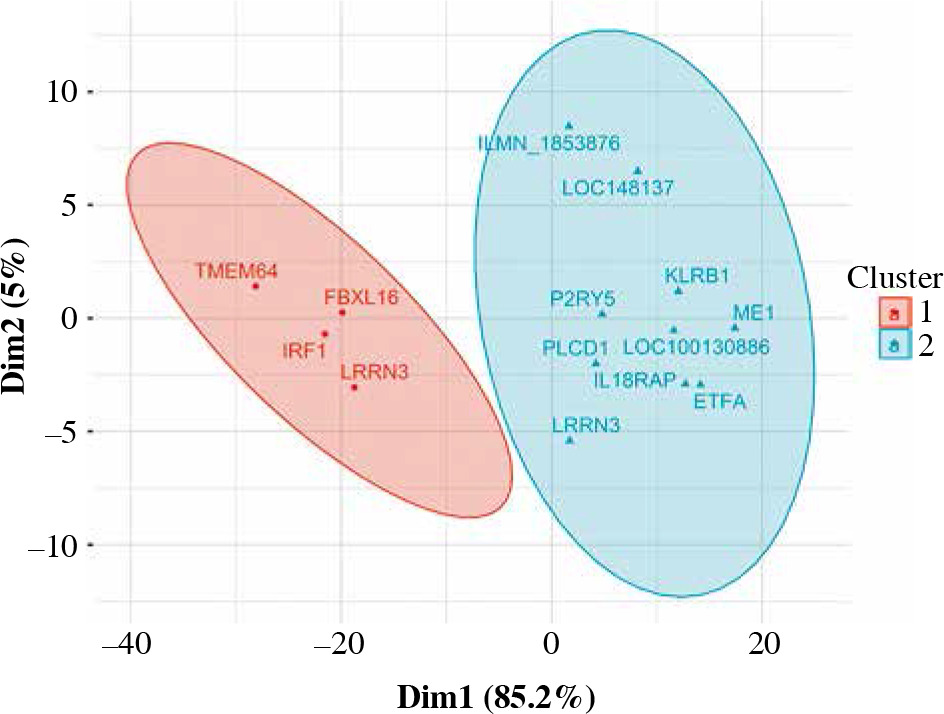
Table 3
Genes differentially expressed in CD4+ cells from smokers vs. non-smokers
Genes differentially expressed in CD4+ cells showed a significant enrichment of GO terms related to interferon α response (pFDR = 0.0186), complement, and inflammatory responses (pFDR = 0.0261), despite a low number of input genes (IRF1, LPAR6, ME1, and IL18RAP were pathway-related). Gene ontology powered by top genes from machine learning hinted at the involvement of interferon α response, IL2-STAT5 signaling, allograft rejection, interferon γ response (random forest), as well as MTORC1 signaling, tumor necrosis factor α (TNF-α), and interleukin (IL)-6 signaling (elastic-net).
DRAIMI indicated hypothetical roles for three groups of genes in mediating smoking-related effects in CD4+ cells: ubiquitin-protein ligases (TRIM21 and TRIM25), HLA genes, and IL-18 (Supplementary Table 2). Analysis of transcriptomic profiles using CIBERSORTx suggested a considerably more cytotoxic profile in smokers, and a relative loss of expression characteristics of Tregs (Supplementary Table 3).
Age-dependent changes of gene expression in CD4+ cells in non-smokers were moderate (absolute R < 0.5), but in smokers some slightly more pronounced associations with age were found including, among others, a C-type lectin CD248 (R = –0.63), LRRN3 (R = –0.62), and the inducer of T-cell apoptosis LGALS1 (R = 0.59; complete results can be found in Supplementary Table 4). LRRN3 correlated negatively with age both in smokers and non-smokers (R = –0.47).
CD8+ cells (T lymphocytes, cytotoxic)
Fifty-eight genes were differentially expressed in CD8+ cells (Table 2), of which the top 10 are presented in Table 4. The full results of differential expression analysis can be found in Supplementary Table 1. LRRN3 was by far the most overexpressed gene and was represented by two separate Illumina probes (Fig. 4). In CD8+ cells, it could identify smokers with AUC of 0.84 (95% CI: 0.78-0.91). The lower expression of CLEC4A in smokers was also detected with two probes. Metalloproteinase MMP25 was overexpressed in CD8+ cells from smokers (Table 4). Two large, overlapping clusters were identified by fuzzy clustering, where some of the genes appeared related: ITGB7 and ITGAL, LILRA2 and CLEC4A, and also LILRA5 and CYBB (Fig. 5).
Fig. 4
Volcano plot of genes under- (left) and overexpressed (right) in CD8+ cells (T lymphocytes, cytotoxic) from smokers vs. non-smokers. Top 20 most significant probes are labeled
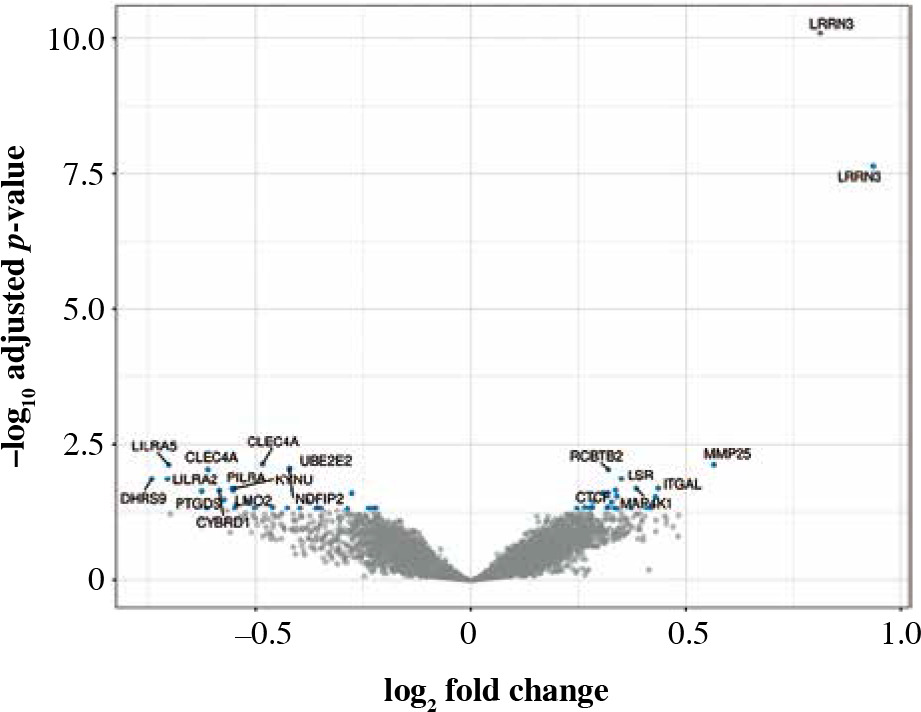
Fig. 5
Fuzzy clustering of genes differentially expressed in CD5+ cells depending on smoking status reveals a continuum within which some genes are moderately grouped. When the number of clusters is set at 2, two main clusters are revealed along dimension 1
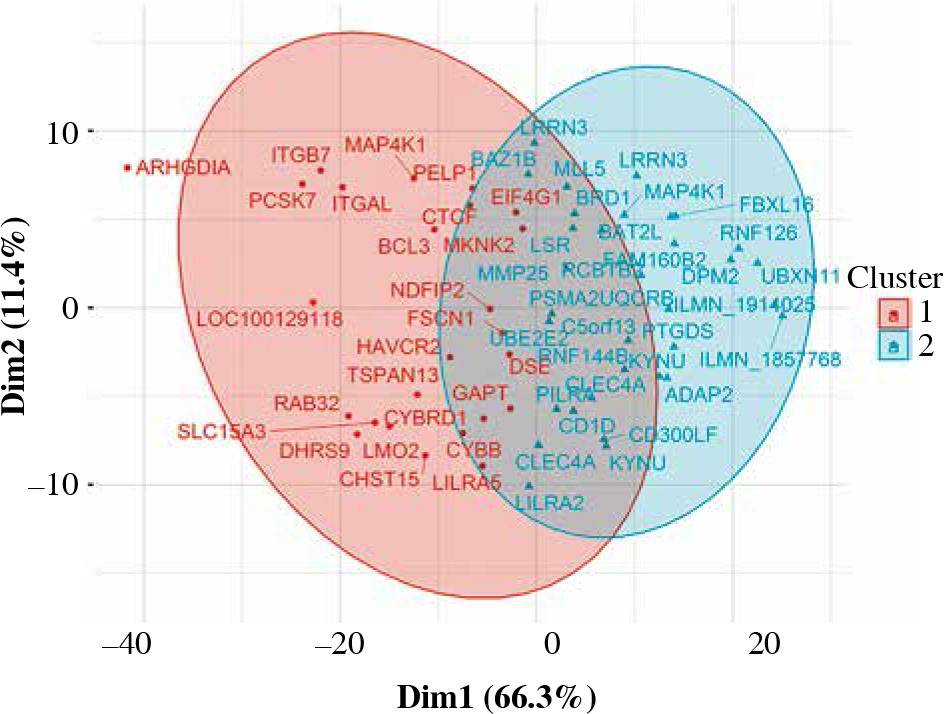
Table 4
Top 10 genes differentially expressed in CD8+ cells from smokers vs. non-smokers
Processes associated with the influence of smoking on CD8+ cells included allograft rejection (pFDR = 5.66 × 10⁻³) and upregulation of KRAS signaling (pFDR = 4.96 × 10⁻²).
Again, also in the case of CD8+ cells DRAIMI highlighted several HLA members, which in this cell type achieved particularly high scores. They were followed by integrins ITGAM, ITGB2 and also a C-type lectin CLEC5A, which we recently showed to strongly predict the need for treatment escalation in ulcerative colitis [13]. A comparison with reference profiles of immune cells suggested the potential presence of monocytes with a cytotoxic phenotype within the investigated CD8+ cell pool [20].
Moderate relationships were found between age and gene expression in CD8+ cells (R < 0.5 in controls). In smokers, the expression of transforming growth factor β (TGF-β) activated kinase TAB1 (MAP3K7IP1) seemed to correlate with age more strongly than in controls (R = 0.58 vs. –0.03). An inverse difference was found for a C-type lectin CLEC7A (NFKBIZ; R = –0.42 vs. 0.07).
CD14+ cells (monocytes/macrophages)
Ninety percent of genes differentially expressed in CD14+ cells were overexpressed (Fig. 6). The most important of those were formyl receptor FPR3 (Table 5), SASH1 and MMP25. The difference in FPR3 expression between smokers and non-smokers was high enough to yield AUC of 0.77 (95% CI: 0.70-0.84). Contrary to CLEC4A reduction in T cells, monocytes/macrophages showed a smoking-related increase in CLEC10A. Interestingly, smoking correlated with increased expression of the low-density lipoprotein receptor gene (LDLR) in macrophages. In cluster analysis, some genes appeared particularly closely related (via the highest membership of cluster 1, > 0.95): ARMC10, SASH1, CLEC10A, TUBGCP5, GFRA2, FPR3, suggesting closely related expression (Fig. 7).
Fig. 6
Volcano plot of genes under- (left) and overexpressed (right) in CD14+ cells (monocytes, macrophages) from smokers vs. non-smokers. All statistically significant findings are labeled
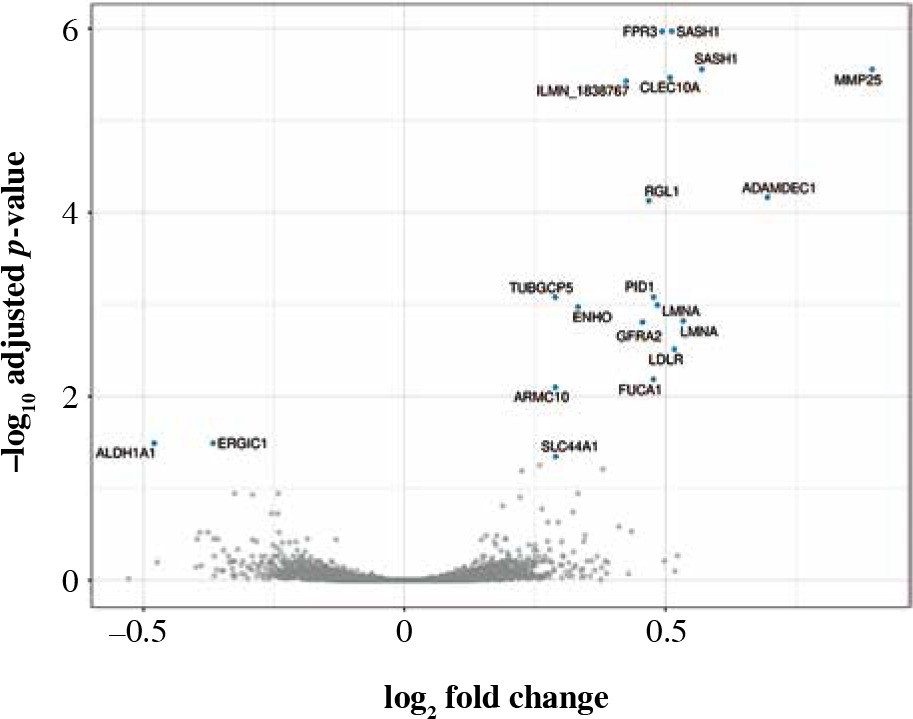
Fig. 7
Fuzzy clustering of genes differentially expressed in CD14+ cells depending on smoking status. Some of the genes from cluster 1 are particularly closely grouped (see discussion)
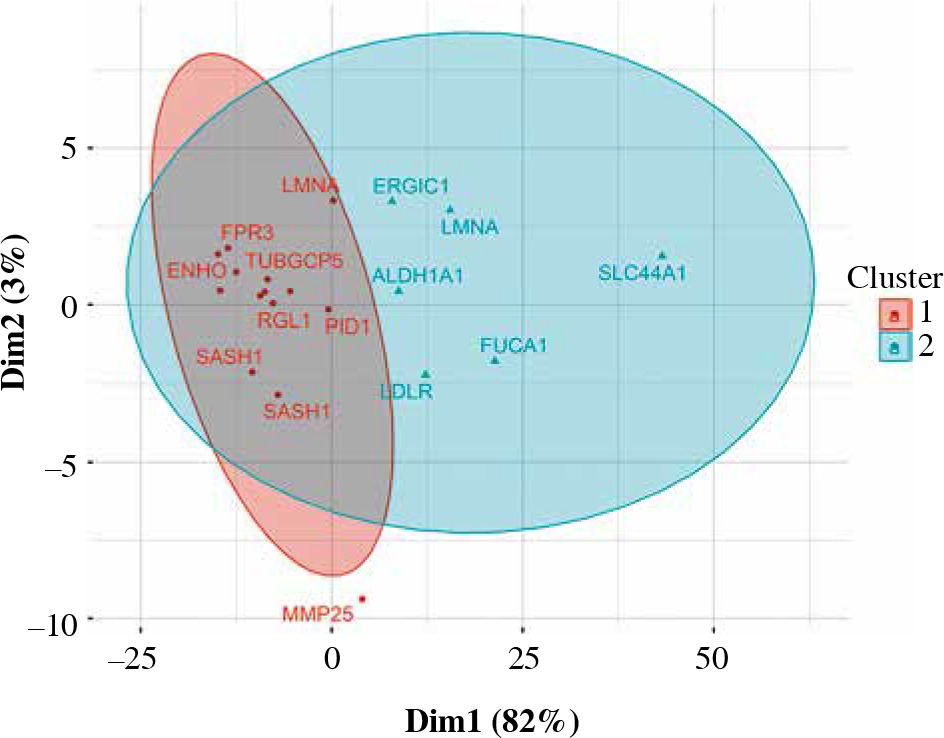
Table 5
Top 10 genes differentially expressed in CD14+ cells from smokers vs. non-smokers
No specific pathways were detected in genes differentially expressed in CD14+ cells, though GO terms for random forest results related to the mitotic spindle, apoptosis, and Notch signaling.
In CD14+ cells, mediator inference suggested possible roles for the adhesion molecule CEACAM8 and the metalloproteinase inhibitor TIMP2. Comparison with reference immune cell profiles indicated that CD14+ cells in smokers might be more pro-inflammatory.
Relationships of gene expression with age in CD14+ cells from controls were weak (R ≤ 0.3). In smokers some associations with age proved stronger, including that of ALDH1A3 (involved in retinoic acid signaling; R = –0.45 in smokers vs. 0.02 in controls), CD40 (R = 0.50 vs. –0.09) and AIM2, which can detect dsDNA to activate the inflammasome (R = 0.34 vs. –0.04).
CD15+ cells (granulocytes)
No genes were differentially expressed between smokers and non-smokers in CD15+ cells. Consequently, no gene ontology analysis was conducted. DRAIMI suggested the involvement of phospholipase PLA2G4A (arachi- donic acid metabolism), followed by STAT6 (and STAT3). Transcriptomic profile deconvolution hinted at possible reduced capacity of these cells for antigen presenta- tion [21].
In CD15+ cells of controls the relationships of gene expression with age were weak (R < 0.3). The inhibitory receptor LAIR1 was more strongly associated with age in smokers (R = 0.44 in smokers vs. 0.01 in controls).
CD19+ cells (B lymphocytes)
Only two genes were overexpressed in CD19+ cells: ATF5 and MGAT3 (Table 6, Fig. 8). Despite a few differences in CD19+ cells, ATF5 alone could potentially help in differentiating between smokers and non-smokers (AUC = 0.69, 95% CI: 0.61-0.76). Immune mediator inference hinted at a potential role of MRTFA, which may promote transcription of pro-inflammatory genes, as well as the adhesion molecule CEACAM6. Comparison with reference expression profiles was inconclusive, consistent with the few transcriptomic differences found.
Fig. 8
Volcano plot of genes under- (left) and overexpressed (right) in CD19+ cells (B lymphocytes) from smokers vs. non-smokers. All statistically significant findings are labeled
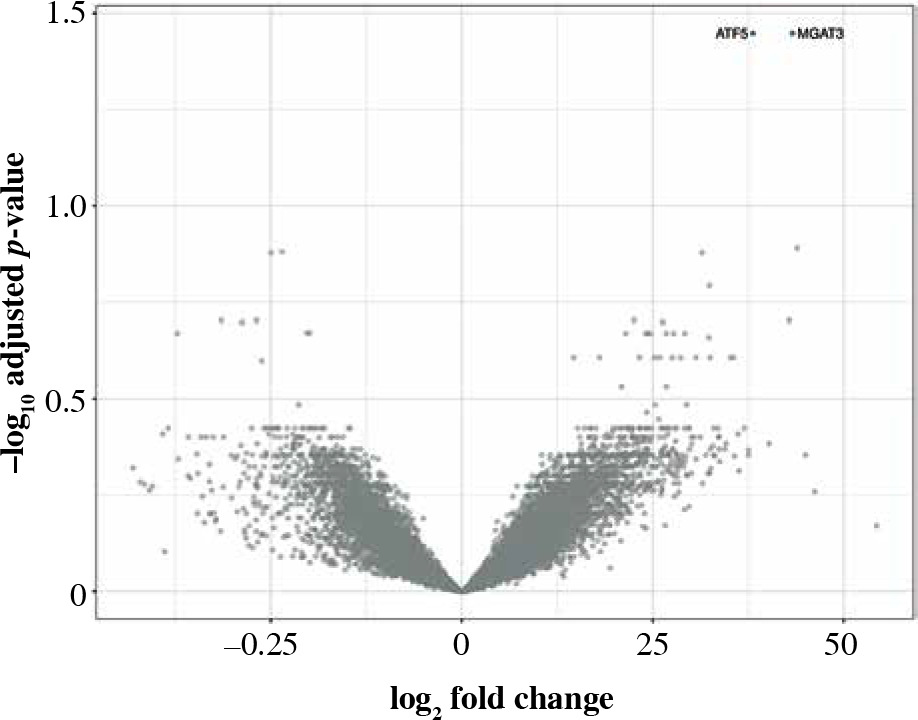
Table 6
Genes differentially expressed in CD19+ cells from smokers vs. non-smokers
| Gene | logFC | p | pFDR | Gene |
|---|---|---|---|---|
| ATF5 | 0.381 | 2.76 × 10⁻⁶ | 0.035 | Activating Transcription Factor 5 |
| MGAT3 | 0.433 | 3.58 × 10⁻⁶ | 0.035 | Beta-1,4-Mannosyl-Glycoprotein 4-Beta-N-Acetylglucosaminyltransferase |
Since in CD19+ only two genes were differentially expressed, gene ontology analysis was conducted using the main results of elastic-net modeling, implicating interfe- ron α responses (pFDR = 1.96 × 10⁻³). Full lists of genes identified by elastic-net regression and random forests as related to smoking in all the analyzed cell types are presented in Supplementary Tables 5 and 6.
In CD19+ cells, the transcript most strongly associated with age in controls was metalloproteinase inhibitor TIMP1 (R = 0.32). In smokers, C-type lectin CLEC9A was more strongly correlated with age than in healthy participants (R = 0.52 vs. 0.09), and LRRN3 was more negatively associated with age vs. controls (R = –0.50 vs. –0.02). Effects similar as for LRRN3 were also found for CD160, LEF1, TXK, ITK and IL18RAP.
Comparison with meta-analysis by Huan et al
The percentage of differential expression findings overlapping with the whole-blood meta-analysis by Huan et al. was dependent on cell type: CD4+ 30.7%, CD8+ 25.0%, CD14+ 68.4%, CD19+ 50% (1 of 2) [11]. The overlapping genes are summarized in Table 7.
Table 7
Differentially expressed genes overlapping between this study and the whole-blood meta-analysis by Huan et al. (as per Supplementary Table 2 at doi: 10.1093/hmg/ddw288). Genes overexpressed (+) and underexpressed (–) in smoking are shown
Discussion
This study reanalyzed data from Momozawa et al. and identified sources of gene expression signatures associated with smoking exposure in CD4+, CD8+ and CD14+ cells from 273 healthy Europeans [19]. In these cell types, CEDAR transcriptomes revealed almost a hundred differentially expressed genes, including some of the best-known actors of immunity (IRF1, IL18RAP, IL4R, NFKB2). Additional insights were gained by the application of auxiliary methods of transcriptomic analysis, such as DRAIMI and immune profile investigation. The results demonstrate the differential effects of smoking on immune cell types and highlight the need for even more fine-grained analysis.
CD4+ cells (helper T lymphocytes)
Circulating T lymphocytes are sensitive to tobacco smoke. CD4+ cell abundance increases with the number of cigarettes smoked per day, as well as with the Brinkman index, which is a measure of cigarette smoke exposure [22]. Smoking enhances Th1 cytokine synthesis and regulates programmed cell death through apoptosis in CD4+ cells [23]. Our analysis characterized the impact of smoking on the CD4+ cell expression profile, exposing the role of LRRN3 (leucine-rich repeat neuronal 3), PLCD1 (phospholipase C delta 1), FBXL16 (F-box and leucine-rich repeat protein 16), and P2RY5 (lysophosphatidic acid receptor 6) as top positive predictors of smoking [24, 25]. These findings coincide with previous reports describing LRRN3-driven discrimination of smoking status [26, 27]. Furthermore, cigarette smoking was associated with increased expression of P2RY5 (lysophosphatidic acid receptor 6), which is a putative tumor and inflammation suppressor [28, 29]. In contrast to Maas’ study [27], our analysis did not confirm the association of gene expression with body mass index.
Negative correlations with smoking were noted for KLRB1 (killer cell lectin-like receptor B1), which together with other findings (CLEC4A, CLEC10A) exposes the importance of lectins in the smoking-induced immune disturbance. Rebuli et al. also describe the downregulation of KLRB1 in cigarette smokers in the nasal epithelium [30]. Furthermore, this gene is involved in the production of essential cytokines by T cells (TNF and interferon γ) in Th1 cells, IL-4 in Th2 cells, and IL-17 in Tregs) [31]. It is interesting to consider that reduced KLRB1 expression might be related to lower counts of CD4+ natural killer cells [32]. Overall, it would be interesting to learn whether the counts of CD4+ cells expressing KLRB1+ are reduced by smoking.
IRF1 (interferon regulatory factor 1) was downregulated by smoking, possibly altering the balance of interferon responses. IL18RAP (interleukin 18 receptor accessory protein) is another noteworthy transcript downregulated in smokers, which plays a role in IBD [33], lupus, and coronary artery disease [34]. The Monica Risk, Genetics, Archiving and Monograph (MORGAM) project links proinflammatory IL-18 synthesis with exposure to nicotine [35, 36], while the loss of IRF1 impairs interferon-γ-mediated cell signaling in monocytes of smokers [37]. Overall, further examination of T helper lymphocytes in the context of smoking and autoimmunity is warranted.
One of the crucial genes in measuring the response of CD4+ cells to smoking, GPR15 (G-protein-coupled receptor 15), was absent from this analysis because of being filtered out due to insufficient expression. Smoking is known to increase GPR15 expression and also to increase the frequency of GPR15+ T helper cells, which are thought to play a role in autoimmunity, especially in the gut because of the colon-homing capacity of GPR15 [14] that may be dependent on AHR.
Our study does not provide sufficient evidence to support or refute the observations of the decreased percentage of naïve CD4+ cells and increased memory CD4+ cells. Smoking and cigarette smoke extract are known to direct CD4+ cell development toward the Th17 phenotype, but we did not find typical Th17 regulators or cytokines to be overexpressed in smokers [38]. Smoking exposure was also seen to promote CD25 expression by CD4+ lymphocytes, but without accompanying growth in FOXP3 expression, indicating the lack of full regulatory competences for which the latter molecule is necessary. In general, the results of this transcriptomic analysis might point towards a reduction in CD4+ NK cells and activation of compensatory production of interferons and IL-18.
CD8+ cells (cytotoxic T lymphocytes)
Evidence on CD8+ cell prevalence in smokers is inconsistent. Most studies report increased frequency of CD8+ T lymphocytes and their activation upon exposure to cigarette smoke [39, 40]. Both Nadigel et al. [41] and Qiu et al. [39] described a higher percentage of activated and cytotoxic CD8+ T cells in the peripheral blood of smokers compared to non-smoking individuals. Conversely, Elisia et al. [42, 43] found no smoking-related increase in the number of CD8+ T cell subsets. Our analysis identified a number of genes that exhibit elevated expression in cytotoxic T cells from smokers.
The top correlation was found for LRRN3. The data also revealed that in smokers CD8+ cells more strongly expressed MMP25 (matrix metallopeptidase 25), RCBTB2 (RCC1 and BTB domain-containing protein 2), and LSR (lipolysis stimulated lipoprotein receptor). Metalloproteinases modulate chemokine activity, thus controlling various aspects of the immune response to inflammation [44]. Specifically, MMP25 can impede the activity of α-1-antitrypsin inhibitor, potentially contributing to the destruction of lung parenchyma.
In the present study, we also identified several negative correlates not previously associated with smoking: CLEC4A (C-type lectin domain family 4 member A), LILRA5 (leukocyte immunoglobulin-like receptor A5), UBE2E2 (ubiquitin-conjugating enzyme E2 E2), and NDFIP2 (Nedd4 family interacting protein 2). Clec4A4 can bind antigens and participates in TLR-mediated activation of CD8α- dendritic cells, which induce a CD8+ T cell cytotoxic response under inflammatory conditions [45-47]. Of note, this might be related to RUNX3, the dysregulation of which in CD8+ cells (via DNA hypermethylation) also contributes to inflammatory diseases [48].
The molecular roles of LRRN3 are underexplored. Because of the strength of effect it may be hypothesized that LRRN3 is directly affected by smoking and that its overexpression brings about some of the final effects of smoking on lymphocytes. Querying the R2 platform (Amsterdam Medical Center) for correlates of LRRN3 in a whole blood transcriptomic dataset from trauma patients reveals that the strongest correlate is lymphocyte enhancer-binding factor LEF1 (R = 0.865, p = 1.45 × 10-52) and that some of the top negative correlates include IL-8 receptor and neutrophil chemoattractant CXCR1, along with IL10RB, STAT3, and transcription factors CEBPD, and NFE2 [49]. This would suggest that LRRN3 is related to T cell function, but more research is needed on this gene, which so strikingly relates to smoking.
In CD8+ cells smoking was associated with exhaustion, but in this study the smoking-related expression profile did not fit the exhaustion signatures [50]. We have also not found any similarity between the exhaustion signature presented by Biasci et al. to prognosticate the course of IBD and the smoking-related differences in gene expression in CD8+ cells [51]. Although the observed transcriptomic characteristics of smokers’ CD8+ cells do not readily fit a functional interpretation, future research may focus on the impact of smoking on CD8+ cell integrins and C-type lectins.
CD14+ cells (monocytes, macrophages)
We found that in C14+ cells tobacco smoking was most strongly associated with the expression of FPR3 (formyl peptide receptor 3), which recognizes N-formylmethionine peptides from Enterobacteriaceae [52]. Smokers present decreased prevalence of Enterobacteriaceae in the cecum [53]. Cigarette smoke generates damage-associated molecules, which interact with pattern recognition receptors upon tissue stress. Damage-associated molecular patterns activate cellular components of innate immunity, such as macrophages [40]. Increased FPR3 could also be explained by factors other than microbiota: formyl methionyl leucyl phenylalanine is increased in smokers and leads to an increase of formyl methionyl leucyl phenylalanine receptors on neutrophils [54]. However, in CD15+ cells in this study the expression of FPR genes was not increased in smokers (nor were any other transcriptomic changes found).
Other genes strongly overexpressed in CD14+ cells of smokers included TUBGCP5 (tubulin gamma complex associated protein 5), SASH1 (SAM and SH3 domain containing 1), CLEC10A (C-type lectin domain containing 10A, ADAMDEC1 (ADAM like decysin 1), RGL1 (Ral guanine nucleotide dissociation stimulator like 1), PID1 (phosphotyrosine interaction domain containing 1), and LMNA (lamin A/C). Notably, SASH1 strengthens signal transduction of the TLR4-NFKB axis. Changes regarding C-type lectins in CD14+ and CD8+ cells may have potential implications for ulcerative colitis [55]. Finally, increased expression of LDLR in CD14+ cells from smokers might suggest mechanisms behind smoking-induced atherosclerosis.
These findings are consistent with previous smoking-related gene studies, which reported upregulation of SASH1, PID1, and MMP25 in peripheral blood monocytes in the MESA study and in another study of smoking in patients infected with human immunodeficiency virus [4, 56, 57]. SEMA6B, which was significant in the MESA study, was not replicated with expression profile-wide statistical correction in CD14+ cells, and P2RY6 was filtered out at the quality check stage. MMP25 was not found to be associated with smoking in the meta-analysis by Huan et al. [11], possibly because this cell-specific signal from monocytes and CD8+ cells proved too weak relative to neutrophils.
CD15+ cells (granulocytes, including neutrophils)
Smoking affects the number of peripheral neutrophils, with smokers having a higher count of circulating granulocytes compared to non-smokers [58, 59]. Studies by You et al. [5] and Su et al. [6] describe hypomethylation of several neutrophil-related genes. To further explore the influence of smoking, we analyzed gene expression in CD15+ cells of smoking- and non-smoking individuals. Gene expression did not differ depending on the reported tobacco smoke exposure. Supplementary random forest analysis suggested possible involvement of SNX24 and TPM2, which play a role in neutrophil biology [60]. Although we know of no studies focusing specifically on CD15+ transcriptomes in the context of tobacco smoking, whole-blood analyses must have been powerful enough to detect any neutrophil-specific signals. Nevertheless, out of the genes known to be associated with smoking, those most strongly associated are shown by multiple lines of evidence to be differentially expressed in other types of cells. In summary, few expression characteristics in CD15+ were linked to smoking in the current study.
CD19+ cells (B lymphocytes)
Chronic exposure to tobacco smoke increases the pool of circulating CD19+ B cells and the abundance of the class-switched memory B subset [61, 62]. In this work, we explored transcriptomic characteristics specific for the CD19 marker and smoking status. The strongest positive correlates included ATF5 (activating transcription factor 5), which is a cyclic AMP-dependent transcription factor, and MGAT3 (β-1,4-mannosyl-glycoprotein 4-β-N-acetylglucosaminyltransferase). ATF5 potentially regulates the cell cycle in a CDC34-related manner [63]. Smokers present higher expression of CDC34 compared to non-smoking individuals [63]. In the context of IBD, it may be interesting that ATF5 has the potential to mediate the effects of IL-1β on CEB/P proteins, which are also transcription factors.
Epigenome-wide association studies of smoking-related methylation changes highlighted sites not only within AHRR (aryl-hydrocarbon receptor repressor), but MGAT3 as well [64]. MGAT3 may impact IgG N-glycosylation [65] and the methylation pattern of MGAT3 loci in CD19+ B lymphocytes also distinguishes forms of IBD [66]. MGAT3 expression can be stimulated by cadherin E and may lead to increased formation of N-glycans [67]. Therefore, the results obtained in CD19+ cells may suggest involvement of the stress response and glycosylation in the response to smoking.
Results and autoimmune diseases
Genes associated with smoking in the current study are not only related to immune pathways, but some of them are also known to be involved in autoimmune and inflammatory diseases. This can be demonstrated using a set of examples from the main results: KLRB1, IRF1 and IL18RAP (CD4+), KYNU, CLEC4A and ITGB7 (CD8+). Variants in KLRB1 were associated with its greater expression in multiple sclerosis, and KLRB1 expression was reduced following treatment with interferon β [68], potentially revealing the impact on NK cells. Variants in IRF1 may predispose not only to IBD, but also to systemic sclerosis [69]; signatures of IRF1 activity can be found in the IBD transcriptome [13]. IL18RAP genetics were associated with IBD, celiac disease, eosinophilia, atopy, and autoimmune thyroid disease; moreover, whole blood IL18RAP expression was associated with the course of rheumatoid arthritis [70]. Of note, IL18RAP lies close to genes encoding IL1 receptors. KYNU (kynureninase) takes part in tryptophan metabolism and may have pro-inflammatory effects in psoriasis, atopic dermatitis and Crohn’s disease [71]. Higher CLEC4A expression was associated with the response to abatacept in rheumatoid arthritis [72]. Finally, ITGB7 encodes part of integrin α4β7, which plays a key role in IBD and is targeted by vedolizumab. Understanding whether any of these genes plays a special role in triggering disease or just belongs to more or less important actors of inflammation remains a current research challenge. This discussion cannot cover all the potential clinical links, including chiefly non-autoimmune conditions, such as premature aging (LMNA), brain diseases (ALDH1A, GFRA2), atherosclerosis (LDLR), dyschromatosis (SASH1) and fucosidase deficiency (FUCA1).
Generalization and limitations
Our study reanalyzed a cohort from the CEDAR dataset by Momozawa et al., who recruited patients within a colon screening program and focused on IBD-related expression quantitative trait loci. The abundance of immune cells was not investigated. Furthermore, interpretation of immune cell markers in our study is unsophisticated to avoid further complicating the results: it must be remembered that immunomagnetic separation does not yield entirely pure populations, and that expression of CD4+, CD8+, CD14+, CD15+ and CD19+ markers is not completely specific for the discussed cell populations; e.g., CD4+ can be expressed by natural killer cells, CD8+ can be found on dendritic cells, and CD19+ is also expressed on plasmocytes. The interpretation must therefore be cautious. This study does not address epigenetic changes such as DNA methylation, potentially underlying gene expression, and protein expression levels or activity, though gene expression and protein abundance often do not correlate. With regard to machine learning techniques, it should be considered that they focus on selection of uncorrelated markers with the highest discriminative value. Therefore, they select one of the expression probes from a group of highly correlated markers, effectively making it the sole representant of a co-expression module. Because only Europeans were included in the study by Momozawa et al., the results cannot be generalized to the global population, and extrapolation to patients with IBD is uncertain. At recruitment vaping was rare and therefore the conclusions from the study also cannot be extended to users of e-cigarettes. Moreover, no details on cumulative smoking exposure, past smoking status or passive smoking were available. Although we found that gender and BMI are not confounders of smoking-related cellular phenotype, we may not exclude other confounding factors. The use of CIBERSORTx in this study is different from the tool’s intended aim and therefore the interpretation of the obtained results was especially cautious. Because of insufficient data in the literature, in the interpretation of the present findings we make use of information derived from various models and sources. These limitations are balanced by a large population and complete expression profiling of immunomagnetically separated cells, which provided unique insight into smoking-related transcriptomic changes in the principal immune cell types.
Conclusions
This study highlights several immune cell-specific correlates of smoking. LRRN3 overexpression, a transcriptomic hallmark of smoking, is driven by CD4+ and CD8+ cells. On the other hand, macrophages and to some extent CD8+ cells of smokers overexpress MMP25, another gene associated with smoking in multiple studies. C-type lectin family members’ expression is differentially affected by smoking in CD8+ and CD14+ cells. The most consistent ontology terms associated with smoking included immunity pathways, many of which are related to interferons.
In conclusion, smoking alters vital immune regulation genes in lymphocyte subtypes, especially CD8+ cells. Further research is needed to understand the role of cell-specific responses to smoking in autoimmune diseases, possibly by examining CD4+, CD8+ and CD14+ cell subpopulations via single-cell sequencing.