
Purpose
Superficial iridium-192 (192Ir) high-dose-rate (HDR) brachytherapy (BT) is an established non-invasive radiotherapy (RT) modality for skin tumors. Surface cone applicators for small skin tumors and HDR-BT catheter flaps for large and irregularly shaped cutaneous lesions are commercially available for many years [1-3]. In anatomical locations that are difficult to access with standard applicators, i.e., facial skin with strong curvature or complex geometry in the region of nose and ear, individually adapted moulds achieve ameliorated target coverage, with sharp gradients and low-dose to healthy tissue [1, 3-11]. Skin cancer of facial regions [12] as well as eyelid carcinomas [13] or intra-oral malignancies [14] have been successfully treated with individual moulds for HDR contact BT. Furthermore, the combination of surgery, external beam radiotherapy (EBRT), and HDR-BT for facial lesions has been explored, reflecting the beneficial implementation of BT within multimodal treatment concepts [15]. Most of the studies have focused on clinical outcomes obtained by using patient-specific moulds without detailed descriptions of associated workflows and analysis of dosimetric conditions.
Water-based dose calculations, following TG-43 guidelines are still the gold standard for clinical BT treatment plans [16]. Nevertheless, dose to non-water equivalent tissue and materials will differ from TG-43 calculated dose. In this regard, the TG-186 report provides guidance considering dose-to-medium in heterogeneous media [17]. Commercially implemented model-based dose calculation algorithms (MBDCA), such as Acuros® BV (Varian Medical Systems, USA) and advanced collapsed cone engine (ACE) of Oncentra® Brachy treatment planning system (Elekta, Sweden), allow for evaluation of setups other than water [18-20]. ACE can use either tissue, applicator or phantom materials manually assigned to regions of interest (ROI) or electron densities derived from Hounsfield units (HU) of computed tomography (CT) data. Radiation transmission through non-water equivalent applicators, such as metal tubes or plastic supporting devices like our moulds, may result in delivering a dose significantly deviating from the calculated TG-43 dose. Some dosimetric studies have evaluated TG-186 calculations of surface mould BT with phantom simulations. Park et al. used a head phantom to compare the dosimetric outcome of superficial BT with a commercial flap applicator and individually 3D-printed surface applicators [5]. The latter achieved better adhesion to irregular body surfaces, resulting in a superior agreement of planned and delivered dose. Rigid and elastic mould materials of 1.04 g/cm3 and 1.07 g/cm3 mass density, respectively, showed adequate dosimetric consistency of ACE calculated and measured dose distributions by means of gamma analysis. Cawston-Grant et al. evaluated a slab phantom setup to simulate scalp treatment [21]. The model demonstrated good agreement of ACE and TG-43 calculations versus film dosimetry, except from an underestimated attenuation of the calculated dose in a bone slab. Boman et al. and Granero et al. analyzed the absence of full scatter conditions in superficial mould treatments, and recommended either model-based dose calculation or using a bolus in some situations [22, 23]. The majority of published reports dealing with individual moulds did not consider model-based dose calculations.
In general, dose calculation of superficial BT is not trivial. It differs from an infinite water model in the manner of reduced backscattering due to ambient air around the patient. In addition, plastic materials of applicators or moulds may lower or higher mass and electron densities than water, thus their intrinsic radiation interactions would also differ from water. Model-based dose calculation algorithms allow quantifying the dosimetric impact of these aspects. To consider heterogeneous tissue and applicator materials, even in case of unknown chemical compositions, Oncentra® Brachy treatment planning system (TPS) supported HU to electron density conversion formalism of Knöös et al. [24].
We present the implementation of patient-individual moulds for 192Ir HDR contact BT of perinasal skin tumors into clinical routine, while focusing on dose calculation. Water-based TG-43 plans for clinical use and retrospective material-dependent collapsed cone calculations were compared. The impact of mould material density was analyzed for robustness of the treatment planning process.
Material and methods
Clinical workflow
Six patients with non-metastatic cutaneous malignancies in the perinasal area were treated with superficial HDR-BT using individual moulds. All moulds were manufactured of biocompatible epithetic plastics, with embedded 6-French plastic BT applicators in cooperation with an epithetic center. Treated pathologic entities were perinasal or periorbital lentigo maligna, basal cell carcinoma (BCC), squamous cell carcinoma (SCC), and malignant melanoma. The patients either refused surgery after oncosurgical assessment, indicating that total resection without mutilating or complex plastic reconstruction was not possible, or they had contraindications for surgical intervention. Total doses of 36-44 Gy were prescribed to the planning target volumes (PTVs) in once-daily fractions of 3 or 4 Gy, five days a week. Table 1 shows patients and treatments characteristics.
Table 1
Patient and treatment characteristics
[i] TD – total physical dose, FD – fractional dose, PTV – planning target volume, Depth – delineated PTV depth, No. of applicators – number of 6F BT applicators embedded in the mould, Spacing – average distance between the applicator’s axes, TL – thickness of the transparent mould layer, RL – thickness of the resin glue layer, BCC – basal cell carcinoma, SCC – squamous cell carcinoma
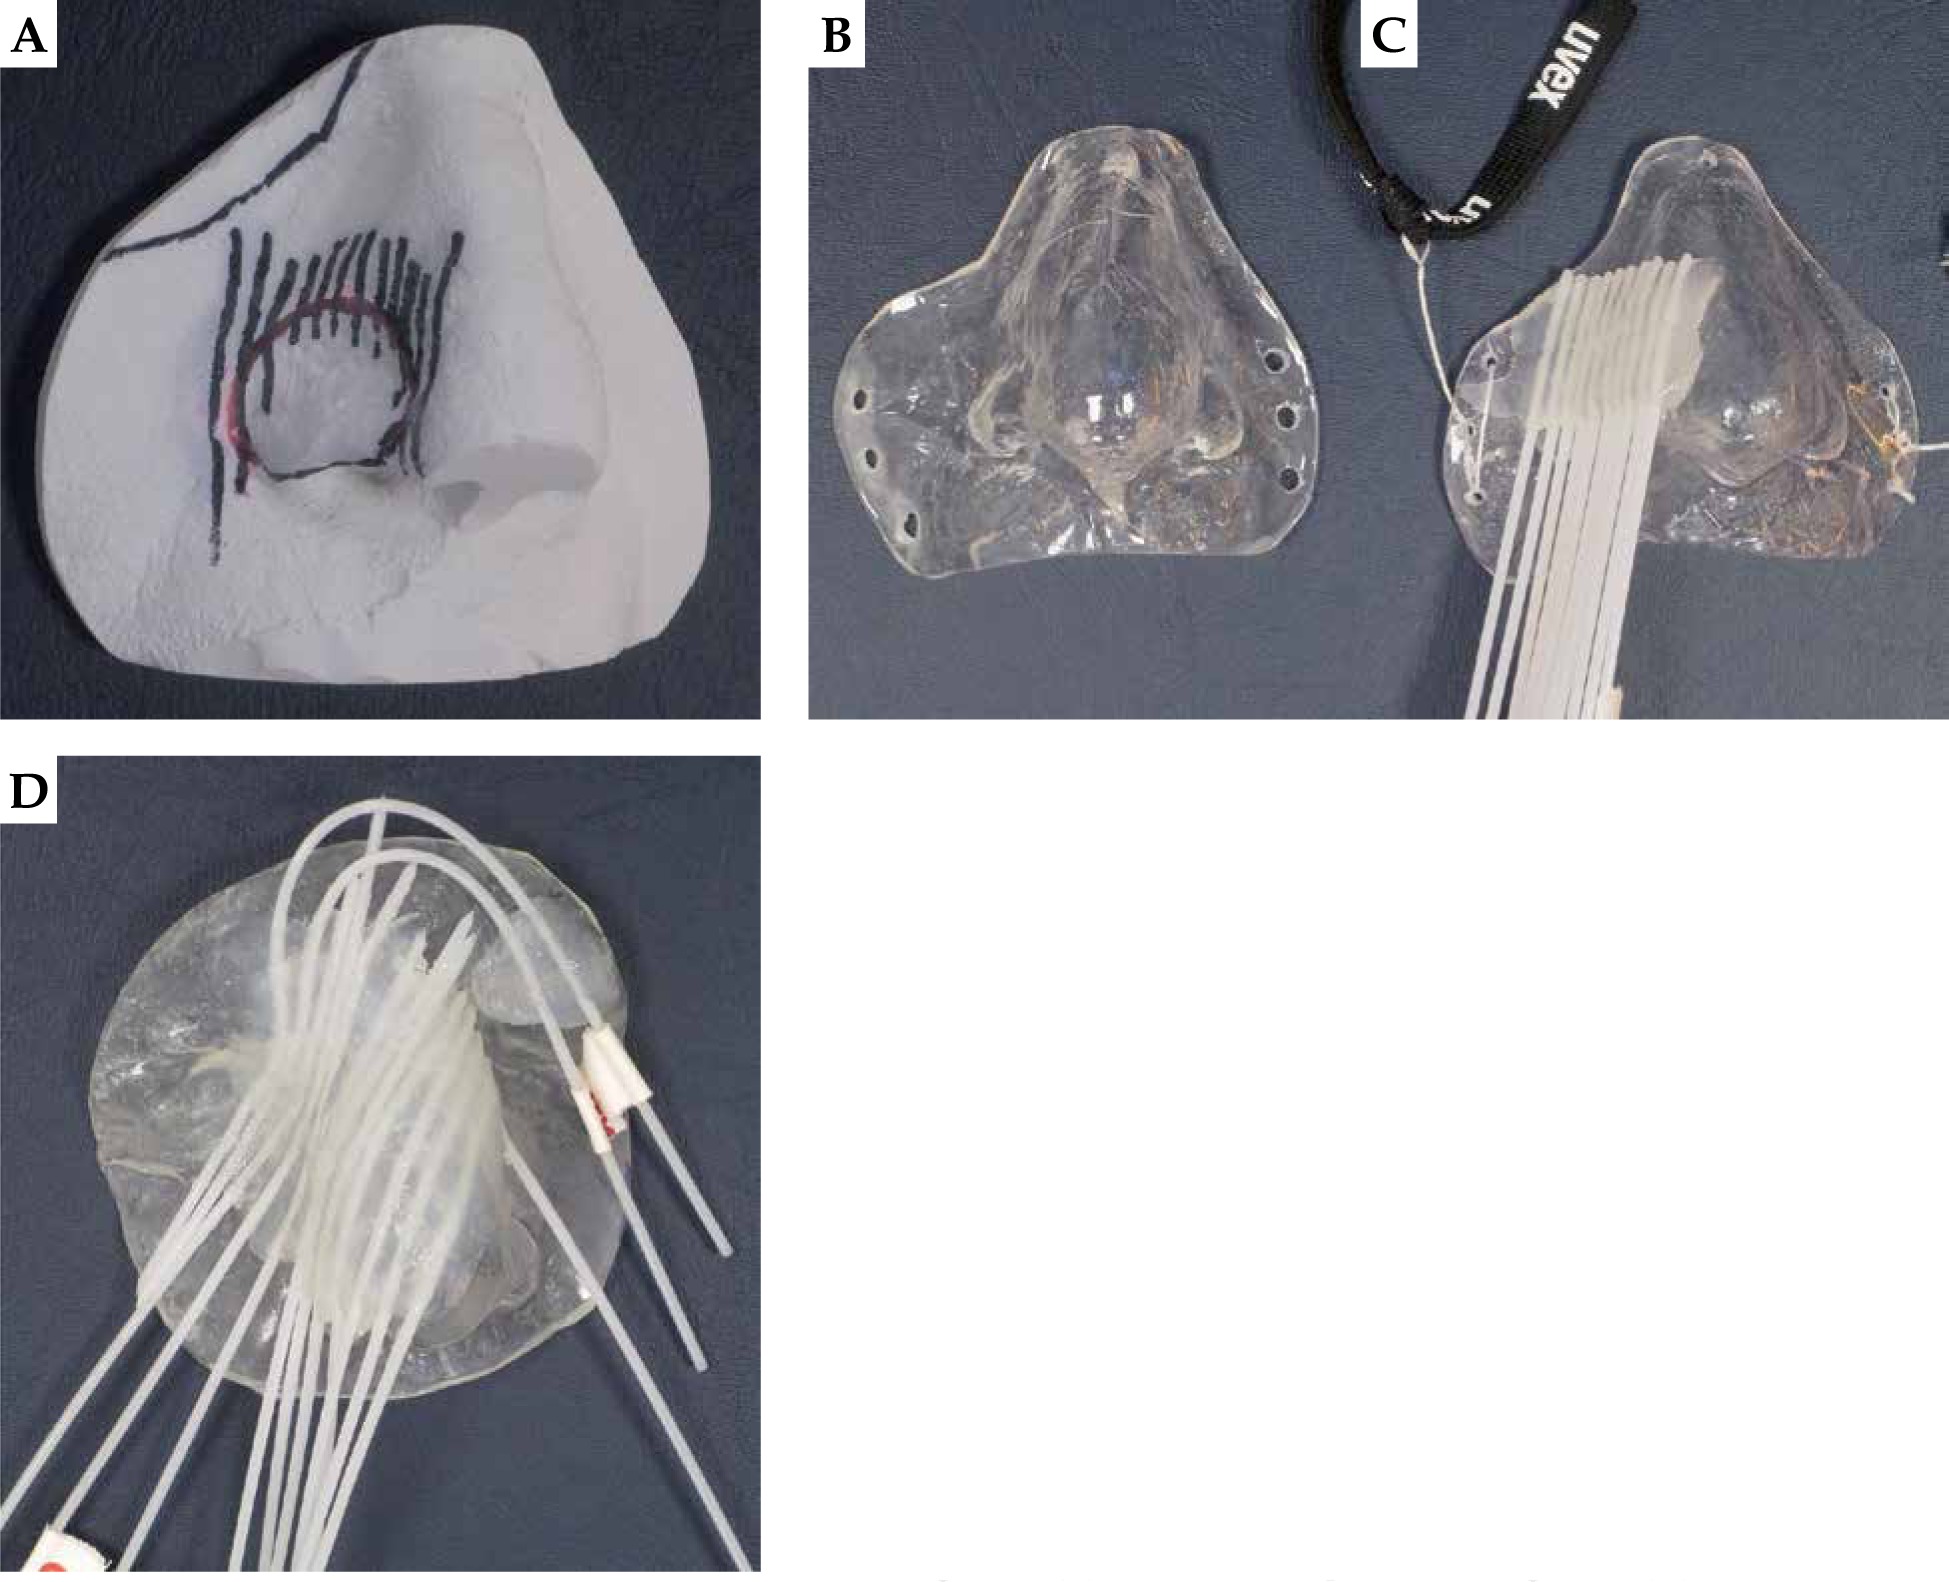
The adaption of each individual mould by an epithetician required successive work steps listed in Table 2. This process typically took one week. Figure 1 illustrates intermediates (A and B) and finalized moulds with parallel (C) and non-parallel (D) applicator arrangement. Six to eighteen applicators were arranged at equal distances according to Table 1, and have covered at least the entire target area. All bending radii of the applicators were large enough for unobstructed transfer of the 192Ir source cable. The reproducible fit of finalized moulds, fixed to the patients with elastic headbands, was carefully checked.
Table 2
Workflow of mould production
| Step | Procedure |
|---|---|
| 1 | Mould target region of the patient with liquid silicone |
| 2 | Plaster cast of the silicone negative to obtain a positive model (Figure 1A) |
| 3 | Form a layer of plastic mould material to the positive plaster cast (Figure 1B) |
| 4 | Glue flexible 6F BT applicators (ProGuide, Elekta, Sweden) on the mould with ultraviolet light curable acrylic resin, resulting in an embedment of the applicators into the final construct (Figure 1C) |
| 5 | Imaging and treatment planning: attach mould, CT imaging, check fit of the mould, prepare the treatment plan |
| 6 | Only required, if initial treatment plan is not satisfactorily covering the PTV: glue additional applicators on the mould (done with two strongly bent peripheral applicators of Figure 1D). Repeat CT imaging and planning process (step 5) |
Treatment planning
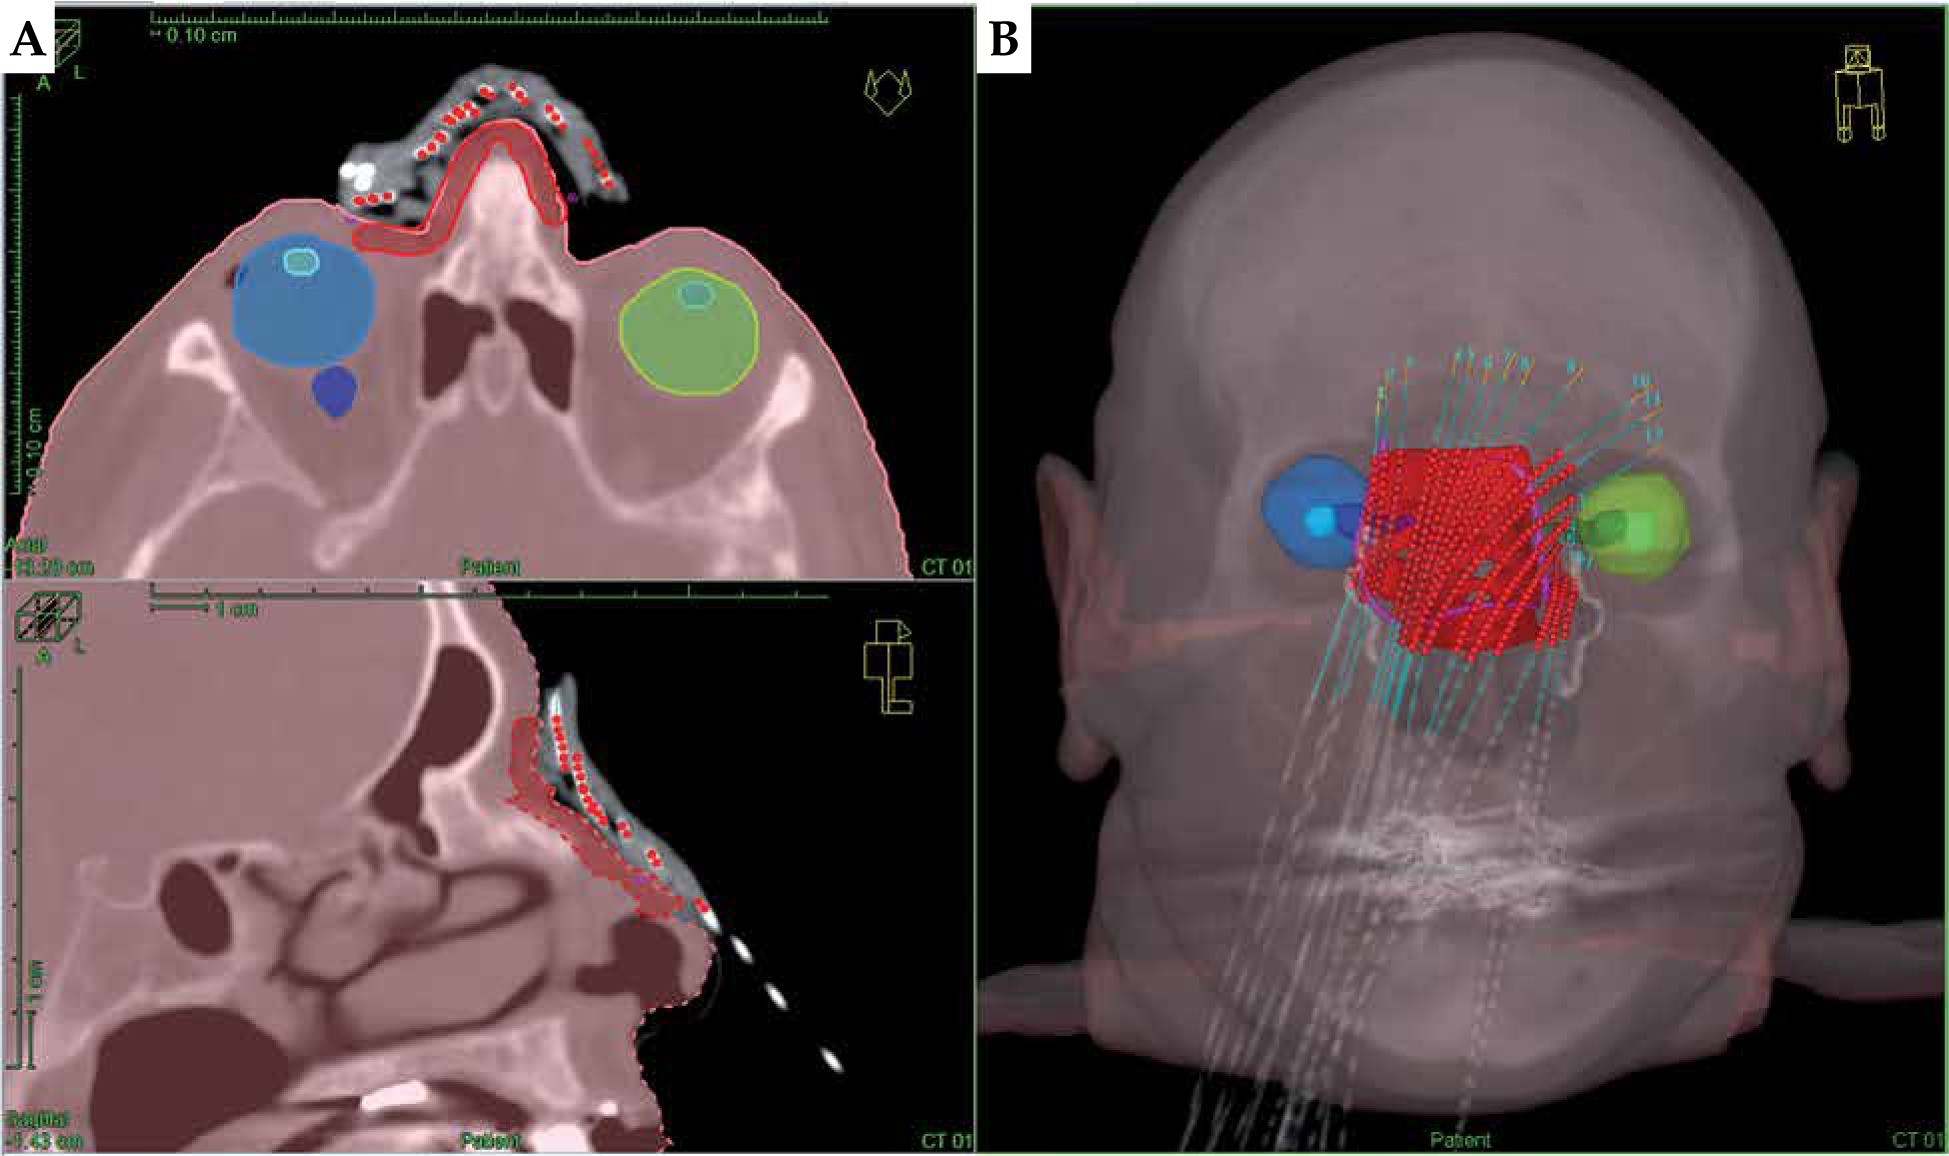
For treatment planning, two CT data sets of each patient were acquired with a Philips Brilliance Big Bore oncology system (120 kV tube voltage, 1 mm slice reconstruction, with a high-resolution head and neck protocol). For the first scan, the patient wore the mould, which had to fit as precisely as during the treatment of each fraction. CT markers (ProGuide, Elekta, Sweden) were inserted into the applicators for better visualization of BT source paths. For the second CT scan without mould, the lesion surface comprising a 5-10 mm safety margin was marked with a tin wire for PTV localization. Both CT data sets were imported into TPS and were fused. In accordance with Devlin et al. [25] and Fogarty et al. [26], the marked PTV was delineated in TPS covering 4 mm to 5 mm depth. Required organs at risk (OARs), including at least the eyeballs and eye lenses, were delineated for the planning process as shown in Figure 2.
Fig. 2
Planning CT of a patient with extensive cutaneous squamous cell carcinoma (SCC) of the nose wearing an individual mould fixed by elastic head straps (patient No. 4). The PTV (red) and critical structures (both the eyeballs and lenses) are delineated and projected along with the calculated dwell positions in axial and sagittal view (A) as well as in the 3D reconstruction (B)
Plans were optimized with hybrid inverse planning optimization (HIPO) [18, 27], considering two PTV-related dose objectives: minimum dose objective to the entire PTV volume was defined as 100% of the prescribed fractional dose, with a relative importance (min. weight) of 3 in the total objective function. Maximum objective was defined as 150% of the prescribed fractional PTV dose, with a lower relative importance (max. weight) of 1.
If the target coverage was unsatisfactory, these parameters were moderately adapted, and dose distribution was finally corrected by interactive graphical optimization [18]. For OARs, we have considered at least the established dose restrictions for conventional fractionation schemes [28], i.e., < 10.0 Gy to the lenses and < 45 Gy to the eyeballs. For the patients whose PTVs were near the eyes, maximum dose objectives of 0.4 Gy per fraction to the eye lenses and 2.4 Gy per fraction to the eyeballs with a relative importance (max. weight) of 1 were used for plan optimization. All treated patient plans were calculated according to the TG-43 protocol.
Model-based ACE dose calculations
TG-186 dose calculations with the ACE algorithm were retrospectively compared with TG-43 results. ACE allowed quantifying dosimetric effects resulting from the absence of full scatter conditions, non-water equivalent tissue compositions, and mould material densities. All presented TG-186 results of Tables 3 and 4 and Figure 3 were recalculated with the original TG-43 plan dwell positions and times used for Table 5 to allow a direct comparison of both algorithms. Plans were not re-optimized. ACE calculations were performed with the predefined “standard” accuracy level, which provides clinically acceptable quality with moderate computing time [18, 19]. Detailed accuracy validations of ACE were published by Ma et al. [20].
Fig. 3
Comparison of cumulative DVHs for TG-43 data, TG-186 data with body and mould contours vs. total CT field of view defined as water and HU-based ACE calculation. External patient’s contour, mould and PTV contours as well as HU values refer to CT images of patient No. 2
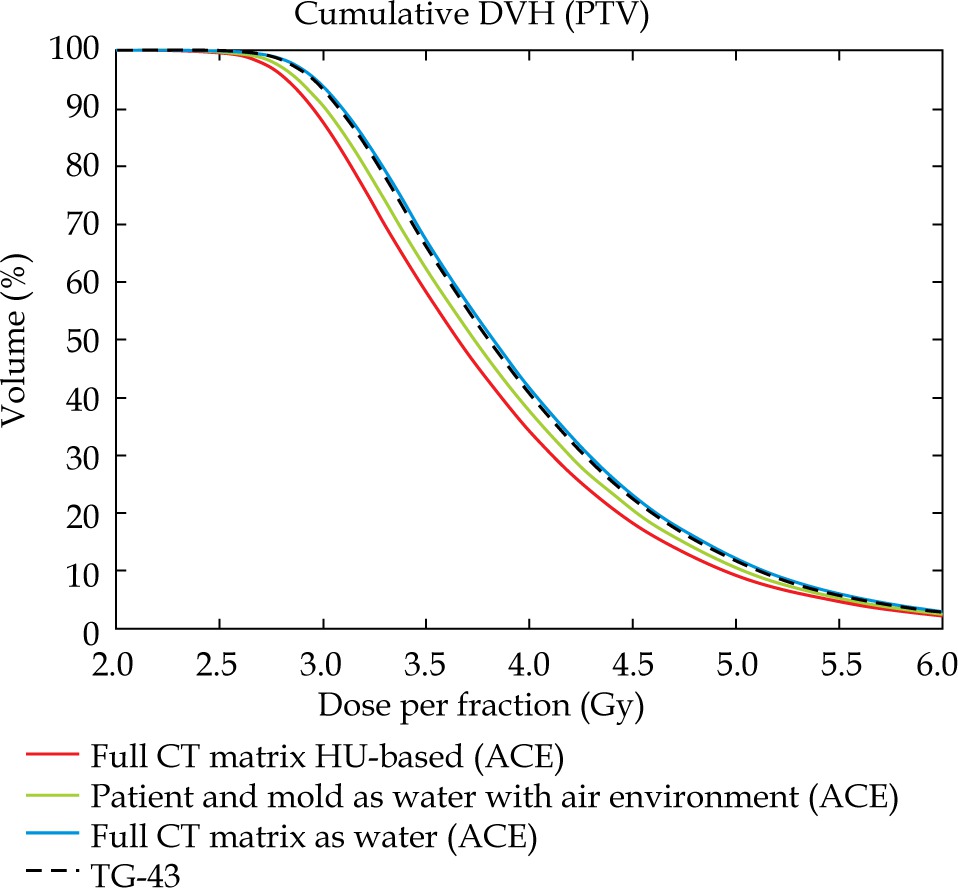
Table 3
TG-186 dose
[i] TG-186 dose values for PTV and OARs’ doses for ipsilateral (IL) and contralateral (CL) eyeballs. All ROI densities were assigned HU-based. Mean values and standard deviations (SD) of all cases are listed below. The two bottom lines show the mean (Δmean) and maximum (Δmax) relative differences of TG-43 and TG-186 dose calculations for identical re-calculated plans for all cases in percentage
Table 4
Mould material impact to planning target volume (PTV) dose
Table 5
TG-43 dose
Mould material characterization
Mould material densities have to be considered for accurate ACE dose calculations. However, mass densities and exact chemical compositions of the patented plastic mould materials were not available. Therefore, all ACE data presented in Table 3 was calculated with mass and electron density matrices derived from HU numbers. HU-based density allocation was applied to mould ROI and all tissue ROIs.
The Oncentra® TPS internally converts HU values to electron densities according to equation (Eq. 1) of Knöös et al., with parameters: A = 3.30 and B = 3.40 for HU values below 150, and A = 3.65 and B = 1.22 for HU values of 150 or higher [24].
ρB= (A + B • HU • 10–3) • 1023(Eq. 1, [24])
Each voxel of the calculation matrix enclosed by the external patient contour is automatically considered with its local HU-derived density. Voxels outside the external contour are treated as air.
Alternatively to the HU-based assignment, densities of delineated ROIs can be replaced with predefined homogeneous tissue or applicator materials. This option allowed us to analyze the impact of systematic mould density modifications to the PTV dose in a series of ACE calculations. Five selected discrete materials were assigned to the delineated mould volume of the patient with the thickest transparent mould layer (patient No. 2). The resulting relative changes to the PTV dose are presented in Table 4.
Scattering conditions
Reduced backscattering through extracorporeal air is characteristic for superficial BT treatments. An example case (patient No. 4) was modified to demonstrate the magnitude of backscattering in ACE TG-186 calculations. In a first scenario, all voxels inside the external patient contour were replaced by water (1.000 g/cm3 mass density for calculation), and every voxel beyond the patient and the mould was replaced by air. In a second scenario, the whole CT data matrix was defined as uniform water, i.e., the calculation was adapted as close as possible to TG-43 conditions. The DVH comparison of both scenarios, supplemented by additional TG-43 and HU-based ACE calculations, is shown in Figure 3.
Results
Dose value representation of patients’ plans
The dose value representation of the water and model-based outcome analysis of all patient plans is compared in Tables 3 and 5. The left columns of Table 5 represent relative TG-43 doses delivered to the PTV as a percentage of the prescribed dose. Relative doses delivered to 90% and 98% of the PTVs (D90 and D98) were found between 92.2-102.5% as well as 65.7-93.9%, respectively. V100 and V150, representing the volume covered by the 100% and 150% of the prescribed dose, were 87.1-93.1% and 7.4-41.7%, for the six patients, respectively. The PTV-oriented planning goals, i.e., D90 ≥ 100%, V100 ≥ 90%, and V150 ≤ 30%, were largely met.
The right columns of Table 5 list TG-43 doses obtained for selected OARs. The dose to 2 cm3 (D2cm3) of the ipsilateral eyeball was calculated between 5.5 Gy and 14.5 Gy, and between 2.8 and 7.7 Gy for the contralateral eyeball. The maximum doses to the ipsilateral and contralateral lenses ranged from 6.5 Gy to 24.8 Gy and from 2.8 Gy to 10.3 Gy, respectively. All patients’ individual doses to OARs are primarily related to their distances from PTV and were optimized as low as possible without violating PTV coverage. With that in mind, the dose to the ipsilateral eye lenses of three patients could not be restricted to the intended tolerance dose of 10 Gy. Hence, the patients were instructed to look at a contralateral object during BT treatment to lower the delivered dose to the ipsilateral lenses further below the precalculated values.
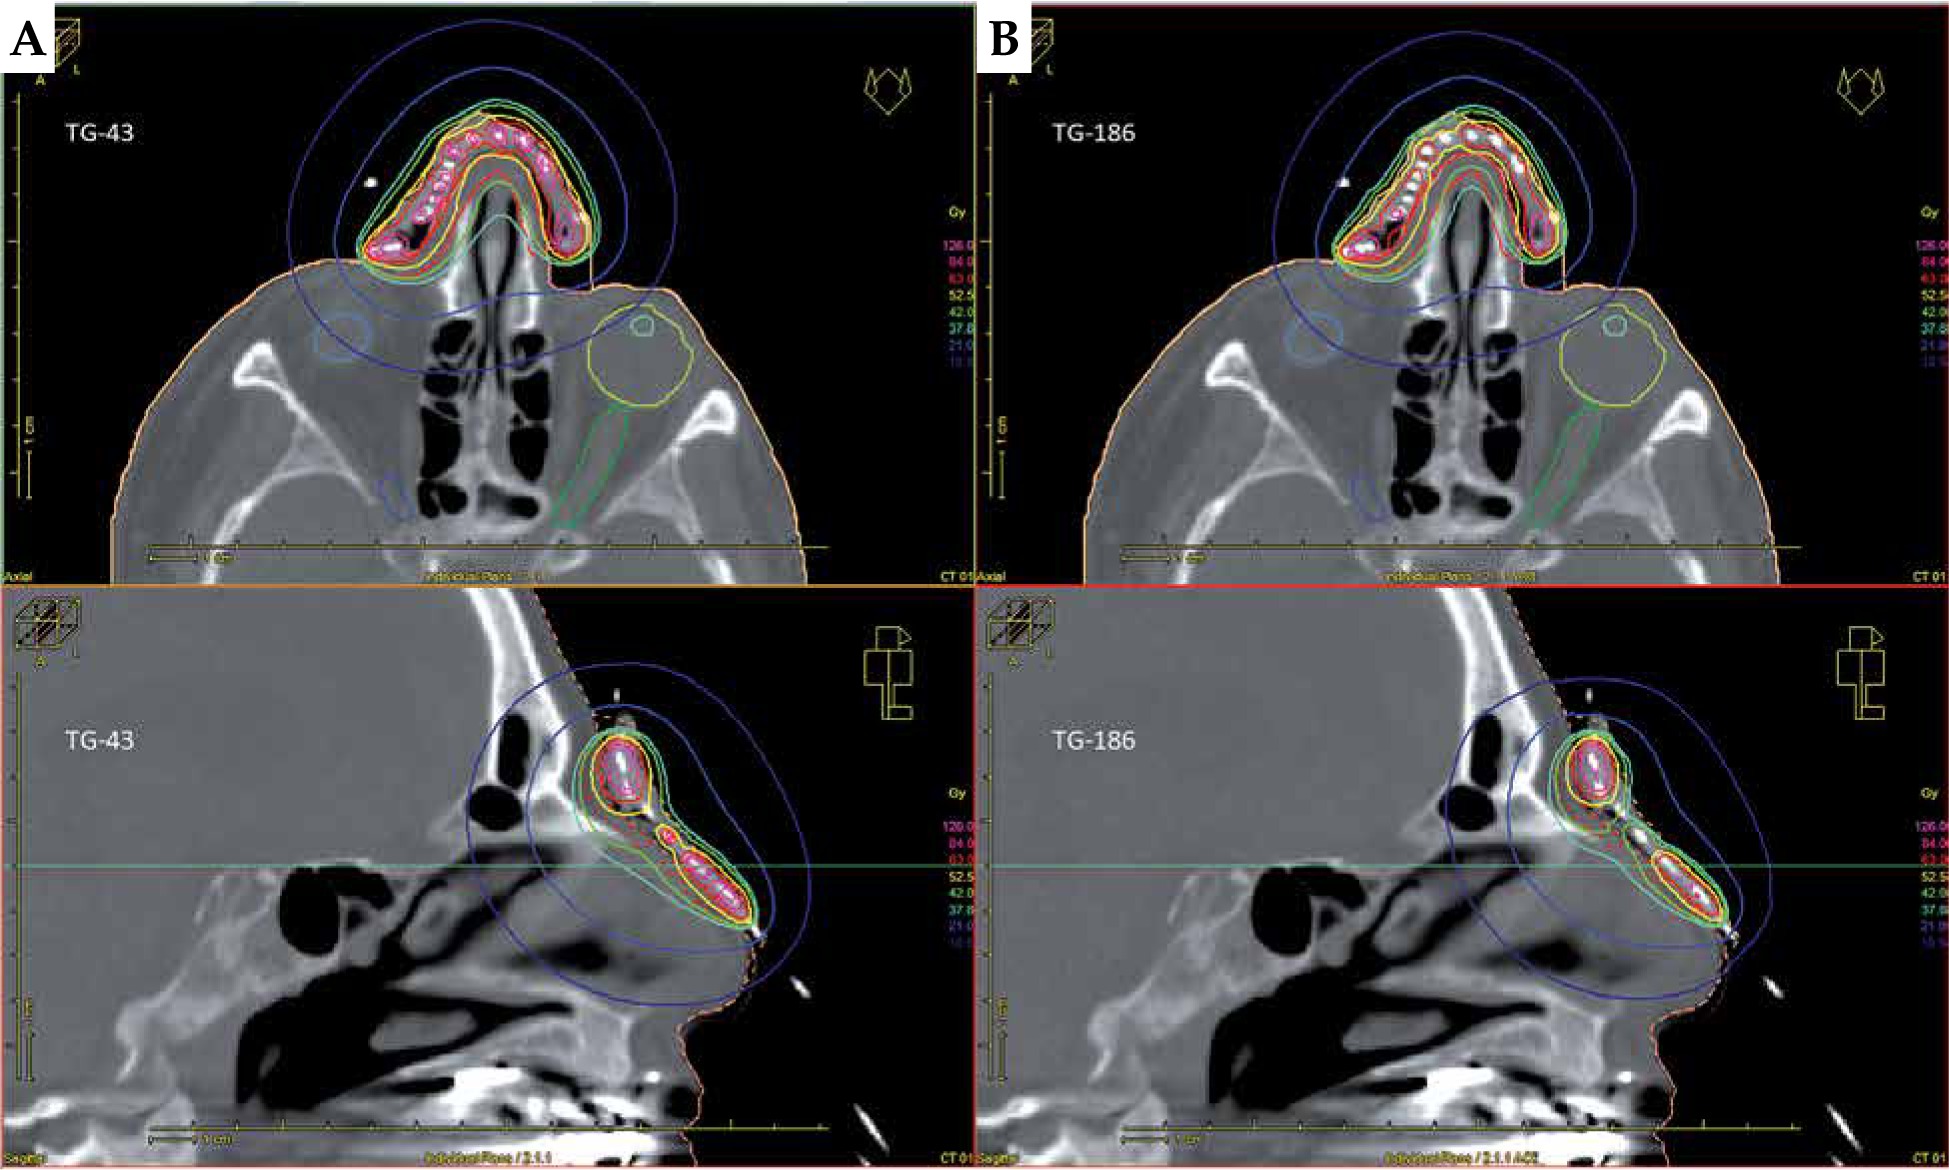
Table 3 summarizes ACE dose volume data. The values were lower for all PTVs, and lower or equal for all OARs. D90 of PTVs decreased by –0.1% to –6.4% compared to the TG-43 results. Total maximum doses to the ipsilateral eyeballs and lenses changed by –0.2 Gy to –2.4 Gy, and by 0.0 Gy to –2.1 Gy in the TG-186 calculations. Figure 4 shows the transversal and sagittal isodose visualizations obtained for patient No. 4, with TG-43 (Figure 4A) and HU-based TG-186 ACE data (Figure 4B).
Fig. 4
Planning CT of a patient with extensive cutaneous squamous cell carcinoma (SCC) of the nose (patient No. 4). Prescription dose was 42.0 Gy to the PTV of 6.8 ml at 4.0 mm depth in once-daily fractional doses of 3.0 Gy delivered using 17 applicators. Transversal and sagittal visualizations are compared for TG-43 (A) and HU-based TG-186 ACE (B) calculations
Dosimetric impact of mould material density
The PTV dose dependence on variable mould material densities was evaluated for patient No. 2 who had the thickest transparent mould layer (3 mm) and one of the largest mould volumes (16.7 cm3) of all the patients. This mould volume was successively assigned to five appropriate materials from the TPS material library, starting with 1.00 g/cm3 mass density for water, up to 1.26 g/cm3 for plastic material. Table 4 presents the resulting relative changes of PTV-related dosimetric parameters, all referenced to the water results. With increasing mass density of the assigned material, the PTV dose slightly lowers due to decreasing radiation transmission.
The right column was calculated with original HU-based mould density assignment. This data fits in-between values obtained for mass densities of 1.12 g/cm3 and 1.18 g/cm3. This result complies with the mean HU-associated mould densities derived from all patient CT data sets, i.e., 138 ±7 for homogeneous sections of the transparent layers, and 169 ±8 for the hardened resin. According to Equation 1, TPS calculates with average electron densities of 1.14 and 1.17 relative to water, respectively. For the organic plastic materials listed in Table 4 and for the used biocompatible mould materials, it can be assumed that the relative electron densities to water were almost equivalent to the relative mass densities to water. Dosimetric effects of the thin CT markers to the HU-based results could not be observed.
Effects of backscattering
The dose volume histograms (DVH) shown in Figure 3 illustrate the effect of reduced scattering through extracorporeal air in ACE calculations. Cumulative DVHs of a PTV were compared for different mass density scenarios assigned to an exemplary patient geometry (patient No. 2). The green curve represents ACE dose to the PTV with all voxels of the patient’s outline, including the mould defined as water and all other voxels beyond this volume defined as air. The black dashed curve shows the classical TG-43 calculation, and the blue graph illustrates the ACE calculation of a TG-43-like scenario with any voxel of the entire CT matrix including environmental air defined as water.
The first ACE calculation considering environmental air results in a left-shifted curve with –1.7% lower median dose than for the TG-43 calculation (green vs. black dashed curves). For the second ACE calculation with the entire CT matrix defined as water the median PTV dose just differs by 0.6% from the TG-43 dose, thus the blue curve almost coincides with the dashed curve. In the latter scenario, both calculation engines were compared under nearly equivalent conditions and the residual deviations are in line with the dosimetric validation of ACE by the manufacturer [18]. The red curve finally represents the HU-based ACE calculation of the same patient. Its corresponding median dose is –2.6% lower than for the water and air scenario and even –4.3% lower than for TG-43 dose, indicating that there is less scattering and/or stronger radiation attenuation in the HU-based scenario.
Discussion
Iridium-192 HDR contact BT with patient individual moulds was successfully implemented into our clinical workflow to treat cutaneous lesions in the facial region. Lesions difficult to treat with EBRT due to size or locations close to OARs can be safely and efficiently treated with this approach. The dose and prescription concepts of our dosimetrically analyzed series are in line with recent clinical reports and international patterns of practice survey results [3, 7, 10, 11]. At a median follow-up of 165 days (range, 96-449 days), all patients showed complete clinical response with treatment plans described in this study. All patients developed an erythema in terms of acute radiation dermatitis grade 1, which completely resolved within 30 days after treatment completion. Within 90 days after treatment completion, no greater than grade 1 late toxicity was documented. Depending on high individual doses to the eye lenses, some of the patients could develop cataracts in the future.
The primary objective of this study was to evaluate the robustness of treatment planning with superficially adapted plastic moulds, with classical and advanced dose calculation algorithms. To quantify the principle limitations of water-based TG-43 dose calculations with regard to superficial target volumes, the TG-43-based treatment plans were recalculated using TG-186 collapsed cone dose with HU-based density allocation. Concerning the most important planning goal, i.e., achieving complete D90 coverage of the PTV, the average relative changes of all recalculated TG-186 patients’ plans were –3.5%, with a maximum difference of –6.4% for patient No. 4. Larger relative deviations that could become clinically significant were observed for V100 and V150 (down to –16.7% and –30.0%). The TG-43 dose volume parameters of the OARs (eyeballs and lenses) were generally higher than equivalent ACE results. Compliance with established OARs’ dose restrictions for clinically used TG-43 plans, would most probably limit toxicity and side effects to an acceptable level.
A model calculation, taking into account only the absence of backscattering from environmental air, resulted in a –1.7% lower median ACE dose to the PTV compared to the TG-43 data. Regarding the fully HU-based plan vs. the TG-43 plan, the difference has more than doubled to –4.3%. TG-186 vs. TG-43 related dose variations in the same order of magnitude have been also reported for accelerated partial breast irradiation or chest wall BT series [19, 20, 29].
The evaluation of different predefined mass densities from 1.00 g/cm3 up to 1.26 g/cm3 assigned to the 7 mm thick mould of the example case, had an impact of just 0.5% or less to D90 and median PTV doses. The mould consisting of a 3 mm transparent layer plus 4 mm resin in the applicator area interacted with radiation-like equivalent water depth of 8.1 mm (assuming relative electron densities of 1.14 and 1.17 derived from our CT data). 7 mm thick layers of homogenous polystyrene (relative mass density 1.05) or Hytrel® 7246 (relative mass density 1.26) corresponded to 7.35 mm and 8.82 mm equivalent water depths. The small variations of –0.75 mm and +0.72 mm equivalent water depths with respect to the HU-based data were below clinical relevance, and dose calculation was robust against such variations.
Nevertheless, TG-186 calculations should be included in the planning process to avoid possible underdosing in superficial treatment situations. Model-based dose calculation algorithms consider all electron density-related interactions in the CT voxel matrix, including air gaps between patients and moulds, air in the nasal cavities, specific absorption and scattering in tissue, bone and cartilage, etc., and the differences can be seen in Tables 3 and 5.
The workflow based on externally commissioned mould manufacturing in an epithetic center is feasible for clinical routine. However, the adequate positioning of BT applicators as the most important part of the final construct strongly depends on result-oriented communication between physician, medical physicist, and epithetician. In our experience, this can be a weak point with impact on dosimetry and treatment initiation in case of time-consuming mould modifications. In order to correct this weakness, we propose a workflow that allows planning of applicator arrangement through TPS-based anatomy-oriented treatment pre-planning. Hence, position, number, and orientation of embedded applicators can be ab initio adapted to clinical intention. Pre-planning of source paths would have a direct benefit to the dose distribution in terms of conformity, due to an iterative optimization prior to mould adaption. Jones et al. successfully produced 3D-printed moulds based on patients’ individual pre-plans [30]. In our sight, pre-planning could be the most important process optimization of individualized mould-based BT treatment from the physicians as well as from medical physicists’ points of view.
Conclusions
Individual patient-adapted moulds for HDR contact BT represent a reproducible RT modality for conformal target coverage. CT-based treatment planning is essential for this technique. Model-based dose calculations (TG-186) should complement TG-43 dose calculations in superficial BT treatment situations for verification purpose and quality improvement.
HU-based collapsed cone re-calculations of PTV coverage resulted in averagely lower D90 and V100 values than corresponding TG-43 data. Collapsed cone doses of organs at risk were also lowered. Nevertheless, the calculations were robust against small uncertainties in mould material allocation.


