
Purpose
Over the past decade, high-dose-rate (HDR) cervix brachytherapy has benefited from more widespread use of 3D image-based treatment planning techniques, completed mainly with the use of computed tomography (CT) and/or magnetic resonance imaging (MRI). A shift from applicator-based optimization methods to anatomy-based inverse optimization has resulted from these developments [1,2,3,4].
In HDR inverse planning, the optimization algorithms may produce highly non-uniform dwell times. These long dwell times often occur near or at the ends of the activated dwells position in applicators, while the central dwells times can be much shorter. This can become problematic in case of applicator displacement or anatomical variations (as in tumor shrinkage or changes in surrounding anatomy), where large peaks in dwell times can create hot spot that may affect an organ at risk (OAR). In case of changes in applicator/anatomy relative positions from the planned geometry, a further problem may arise, in which cold spots in the target volume may occur due to short dwell times. Therefore, fulfilling plan objectives with less dwell time fluctuations is desirable [5].
In efforts to reduce large dwell time fluctuations, modern brachytherapy treatment planning systems have incorporated a dwell time modulation restriction parameter in their optimization routines. For example, the Oncentra brachytherapy treatment planning system (Elekta, the Netherlands) uses a dwell time deviation constraint (DTDC) in inverse planning by simulated annealing (IPSA) and a dwell time gradient restriction (DTGR) in hybrid inverse planning optimization (HIPO). Both parameters’ assigned values are in range of 0 to 1 (the latter referring to maximum dwell time modulation restriction) [6,7,8].
In the SagiPlan treatment planning system (Eckert & Ziegler BEBIG GmbH, Germany), the modulation restriction parameter used is called the dwell time homogeneity error weight (DTHEW), with the aim of reducing dwell time gradients between adjacent dwell positions in an applicator. The DTHEW parameter accepts user-specified integer values ranging from 0 to 10. The value of 0 represents an unconstrained case and implies no influence from this parameter (therefore, potentially inhomogeneous dwell times), and the value of 10 leads to its greatest effect (potentially, the most homogeneous dwell time distribution).
Such a modulation restriction parameter is an additional constraint in the optimization algorithm and, therefore, can potentially create the task of fulfilling the objectives of target coverage and OAR avoidance more difficult and less successful. Possibly, therefore, the quality of the resulting optimized plan may be compromised by the use of excessive dwell time modulation restriction. There is a limited number of publications on the effects of dwell time modulation restriction on plan quality, most of which have been on prostate cancer brachytherapy. There is no consensus on whether this parameter degrades plan quality or not [2,9,10,11,12]. It can be argued that there is a compromise between a plan that has the best dose distribution for the perfect scenario (static geometry, with no displacements or anatomical changes) and a more pragmatic approach of making the plan more resistant to such positional variations.
As the first step towards establishing a clinically suitable consensus, it is necessary to know how the optimization algorithm behaves with respect to changes in the restriction parameter, and how sensitive the optimized plan quality is to the value of this parameter. In the current study, we investigated the behavior and the dosimetric impact of the DTHEW parameter in inverse planning for cervix cancer brachytherapy using the SagiPlan treatment planning system. There are very limited number of publications on the influence of modulation restriction on treatment plan quality in inverse planned HDR brachytherapy of cervix cancer, one of the most widely used applications in brachytherapy [2,13,14]. To the best of our knowledge, no paper has been published on inverse planning using the new SagiPlan treatment planning system or, more specifically, on the behavior or effects of the DTHEW parameter in the system.
Material and methods
Treatment planning
A set of 10 planning data sets of previously treated cervix HDR brachytherapy patients were used as a representative sample in this study. The current version of the SagiPlan treatment planning system (2.0.2) was used, in which dose calculations are performed based on updated TG-43 protocol of the American Association of Physicists in Medicine [15]. The planning was done for treatment using a BEBIG SagiNova HDR afterloader that uses the cobalt-60 source model Co0.A86 (active source component length 3.5 mm and diameter 0.6 mm). All patients had been CT-planned with inserted BEBIG Fletcher tandem and ovoids applicators without interstitial needles. The high-risk clinical target volume (HR-CTV), sigmoid colon, rectum, and bladder were contoured by a radiation oncologist specializing in brachytherapy and reviewed by an experienced radiologist considering the GYN GEC ESTRO recommendations [16]. The option on the planning system to remove the applicator volume from the HR-CTV was enabled to produce more clinically relevant dose-volume histograms (DVHs).
The patients had received 25 fractions of 1.8 Gy whole pelvic external beam radiotherapy (EBRT), followed by 4 fractions of HDR brachytherapy with a prescribed dose of 7 Gy in 2 fractions per week, assuming a plan for the first fraction of brachytherapy for each patient.
The first step was to set up a suitably high-resolution dose matrix calibration. To that end, in orthogonal workspace, the size and position of the dose matrix in the axial, sagittal, and coronal planes were carefully defined to include all of the contours. The resolution of the dose matrix was obtained by dividing the size of the dose matrix by the number of its dose points. Then, the dose points in three planes were adjusted to achieve a fine resolution of 1 mm in all dimensions.
The next step was to set up the control points. Control points are used by SagiPlan to display/measure the dose level at specific positions to define the dose objectives in automatic dose optimization. According to the manufacturer’s recommendation, to obtain the most accurate dose-volume histograms and other dosimetric quantities, the number of control and calculation points for each contour was set up to 100,000 points, based on the structure defined by the contours. This was to ensure accurately calculated dosimetric quantities, especially for smaller volumes (e.g., 2 cm3 ‘hot spots’).
The HR-CTV was selected as the planning target volume (PTV) and the prescription dose was applied to the PTV. The dwell position separation was set at 3 mm, a typical value used in our clinic, being approximately equal to the source length. The auto-activation of dwell positions was established to be based on the PTV structure with the distance to the PTV surface defined as 5 mm. Therefore, all dwell positions inside the PTV and up to 5 mm outside of it could be activated automatically. The maximum active lengths of the tandem and ovoids applicators in this study were 91.8 mm and 34.8 mm, respectively.
Inverse optimization and the DTHEW parameter
Inverse optimization in SagiPlan (called ‘automated dwell time calculation’) uses the fast simulated annealing (FSA) algorithm [17]. The planner sets the potential range of dwell positions as well as the dose objectives and weights of the PTV and OARs. Then, the algorithm tries to optimize the actual dwell positions and times considering the dwell time modulation restriction in the objective function. SagiPlan allows the user to select one of two methods of calculating the error function in the optimization algorithm, namely, the variance-based and the min/max-based methods. In the variance-based inverse planning, the error function calculates the deviation of the doses from the control points to a specific target dose using the sum of squared differences. This method tries to obtain the most homogeneous dose distribution possible. In the min/max-based inverse planning, the error function is calculated from the doses of the control points with respect to a certain dose range. The error contribution of control points that have doses within that range is zero. Otherwise, the error contribution in nonzero, and its magnitude depends on the dose difference from the minimum or maximum value of the range, as applicable (SagiPlan 2.0 Users’ Guide. Germany: Eckert & Ziegler BEBIG GmbH; 2016).
To select the method of error function calculation to be used in this study, we first conducted a pilot investigation of the variance-based and the min/max-based methods on all 10 patients for the DTHEW value of zero. Each plan was optimized using the min/max-based method, according to dose objectives outlined in Table 1 [18]. For the variance-based optimization, the same maximum dose constraints as in the min/max-based method were used for the OARs, whereas for the HR-CTV volume and surface, the minimum dose objectives were applied. In this study, the total dwell time was considered to have a relatively low importance as a plan quality index; therefore, for both inverse planning methods, the total dwell time error weight was set to zero to remove its effects from the error function. Also, the midway value for the balance between speed and quality (system default) was selected. As the min/max-based method produced slightly better target dose coverage for this patient group, we used this method for the rest of the study.
Table 1
The dose objectives and weighting factors used for min/max inverse optimization
| ROI | Usage | Volume | |||
|---|---|---|---|---|---|
| Min. dose (%) | Min. weight | Max. dose (%) | Max. weight | ||
| HR-CTV | PTV | 100 | 10 | 107 | 0 |
| Rectum | OAR | 0 | 0 | 57 | 2 |
| Sigmoid | OAR | 0 | 0 | 57 | 4 |
| Bladder | OAR | 0 | 0 | 67 | 2 |
It was necessary to study the behavior of the min/max-based optimization algorithm before investigating the influence of the DTHEW parameter on plan quality indices. To find out if there was any randomness incorporated into the behavior of the optimization algorithm, in a typical patient, the inverse optimization was repeated 10 times with DTHEW = 6, while other parameters were kept constant. We also compared doing this between closing the patient plan after each run and starting from an identical initial plan and the alternative, simpler way of setting 10 consecutive runs. Then, in all patients, we studied the effects of the DTHEW parameter on dwell time distribution. Percentage dwell time inhomogeneity was calculated for each value of the DTHEW parameter by dividing the difference between the maximum and minimum activated dwell times by the mean dwell time (separately for each applicator) and then averaging over all three applicators. Moreover, for each value of the DTHEW parameter, the adjacent dwell time gradients were obtained from calculating the absolute values of differences between any two neighboring dwell times in the largest range of potential dwell positions observed in each applicator and in each patient (including zero dwell times).
Next, the influence of the DTHEW parameter on various plan quality indices was investigated. For each of the 10 patients, 11 studies were inverse planned (DTHEW of 0 to 10, with intervals of 1) again using the dose objectives and weighting factors presented in Table 1. To reduce the impact of the existence of some observed randomness in the inverse optimization algorithm on our results, we performed three consecutive runs for each study and selected the run with the highest value of conformity index (COIN).
Plan evaluation
To evaluate the dosimetric plan quality, we used the DVH criteria from the GYN GEC-ESTRO recommendations, and then equated them for the first treatment fraction (Table 2). The physical dose values in external beam radiotherapy and brachytherapy were normalized to an equivalent dose of 2 Gy per fraction (EQD2) by considering the linear-quadratic model for sublethal cell damage repair with α/β of 10 Gy for the PTV and 3 Gy for the OARs [16].
Table 2
The dose volume constraints used for the treatment plans (external beam radiotherapy of 45 Gy in 25 fractions followed by brachytherapy of 28 Gy in 4 fractions)
| Total EQD2 | First fraction | |
|---|---|---|
| HR-CTV D90 | > 85 Gy | > 7 Gy |
| HR-CTV V100 | – | > 90% |
| Rectum D2cc | < 70 Gy | < 4.4 Gy |
| Sigmoid D2cc | < 70 Gy | < 4.4 Gy |
| Bladder D2cc | < 90 Gy | < 6.2 Gy |
As in most of the reported definitions of this index, the COIN calculated in SagiPlan includes two quantities. The first, C1, is equal to V100, which is the share of the organ volume receiving at least the prescription dose. The second, C2, is the volume receiving the prescription dose inside the PTV relative to the total volume of tissue receiving the prescription dose. In an ideal case, both factors should be equal to unity [19].
The SPSS software (version 22) was used for statistical analysis. Mean values and standard deviations (SD) of the DVH parameters for all patients were compared. Distribution of all variables were checked and found to follow the normal distribution. However, statistical significance of the results obtained in the study, the influence of the DTHEW parameter, was tested using the Spearman’s rank correlation coefficient (a nonparametric measure) due to relatively small sample size. The two-sided paired t-test was used for comparing the two methods of inverse planning. A p-value less than 0.05 was considered statistically significant.
Results
Figure 1 shows a comparison between the variance-based and min/max-based optimized plans, with DTHEW = 0 according to C1, C2, HR-CTV D90, and COIN. Table 3 compares the means and SDs of the indices with the two optimization algorithms. While there was no significant difference in COIN (p = 0.948), mean C2 was greater with the variance-based method (p = 0.024), and mean C1 and HR-CTV D90 were higher with min/max optimization (p < 0.001). Therefore, the variance-based method had somewhat poorer target dose coverage.
Table 3
Comparison of the means and SDs of C1, C2, COIN, and HR-CTV D90 between variance-based and min/max-based optimized plans (DTHEW = 0). The median values are also presented in parentheses
Fig. 1
Comparison of various plan quality indices between variance-based and min/max-based optimized plans: A) C1, B) C2, C) COIN, and D) HR-CTV D90 parameter. The DTHEW parameter was set to zero for all the plans
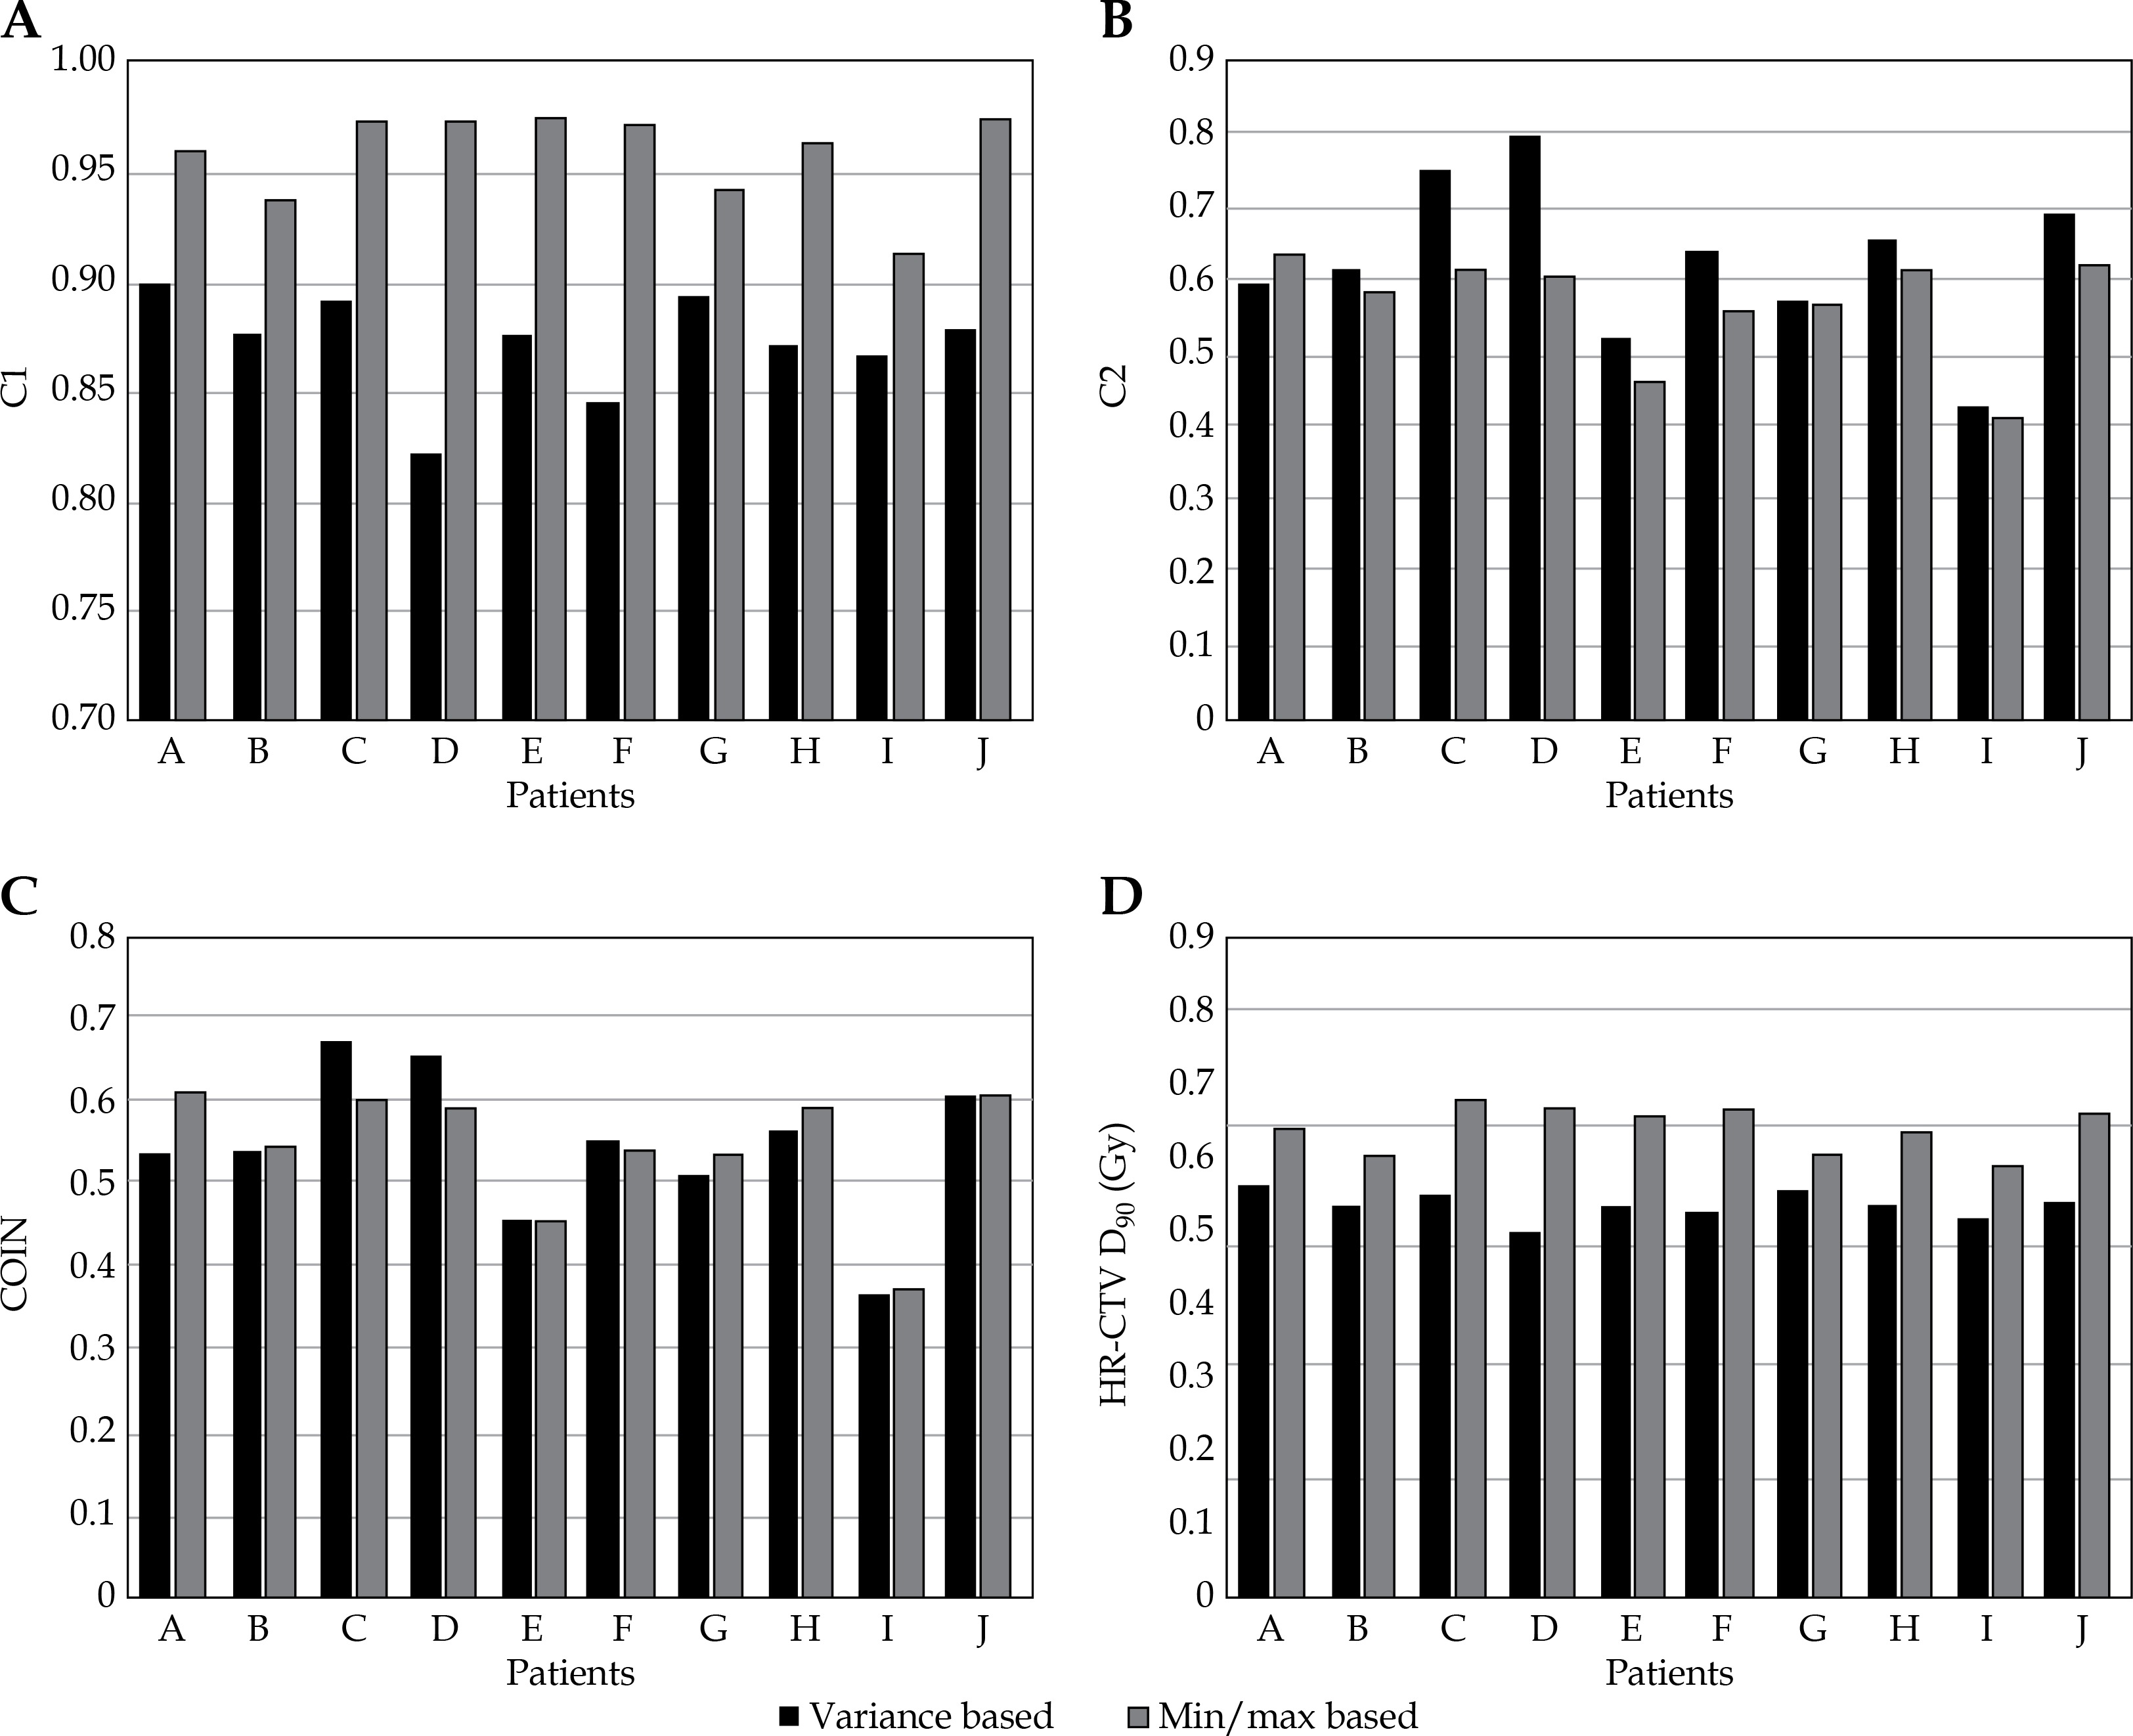
Table 4 shows the magnitude of fluctuations observed in various calculated plan quality indices in 10 consecutive runs of the min/max inverse optimization, with identical input parameters in a typical patient (DTHEW = 6). The displayed error function value is called ‘error points’ in the software. Fluctuations were observed irrespective of whether consecutive runs were set in the same optimization process or if the optimization was applied each time on an identical initial plan. Percentage standard deviations of C1, C2, COIN, and error points among the 10 runs were 2.0%, 5.2%, 6.4%, and 10.2%, respectively.
Table 4
Fluctuations in the computed C1, C2, and COIN values, and number of error points when repeating min/max inverse optimization 10 times in a typical patient (DTHEW = 6)
Figure 2 demonstrates the changes in dwell time distribution by increasing the DTHEW parameter in a typical patient, showing the distribution of dwell times obtained in the tandem and the left and right ovoid applicators separately for DTHEW values of 0, 1, 10, and manual optimization. Dwell positions 1 and 20 represent the distal and proximal potential activated dwell positions among the three mentioned applicators, respectively. A general reduction in dwell time fluctuations is observed with increasing values of this parameter. This figure also shows the isodose lines in the min/max inverse optimization with DTHEW = 0 (E) and DTHEW = 10 (F) in the mentioned patient.
Fig. 2
Distribution of dwell times along the tandem and left and right ovoid applicators in a typical patient in min/max-based inverse optimization, obtained with different values of the DTHEW parameter, plotted using the same axis scales. The corresponding dwell times for a manual optimization is also presented for comparison. The lower two images show isodose lines in min/max inverse optimization with DTHEW = 0 (E) and DTHEW = 10 (F) in the same patient. The dashed lines represent HR-CTV, bladder and rectum, and the solid lines show the 200%, 100%, and 50% isodoses
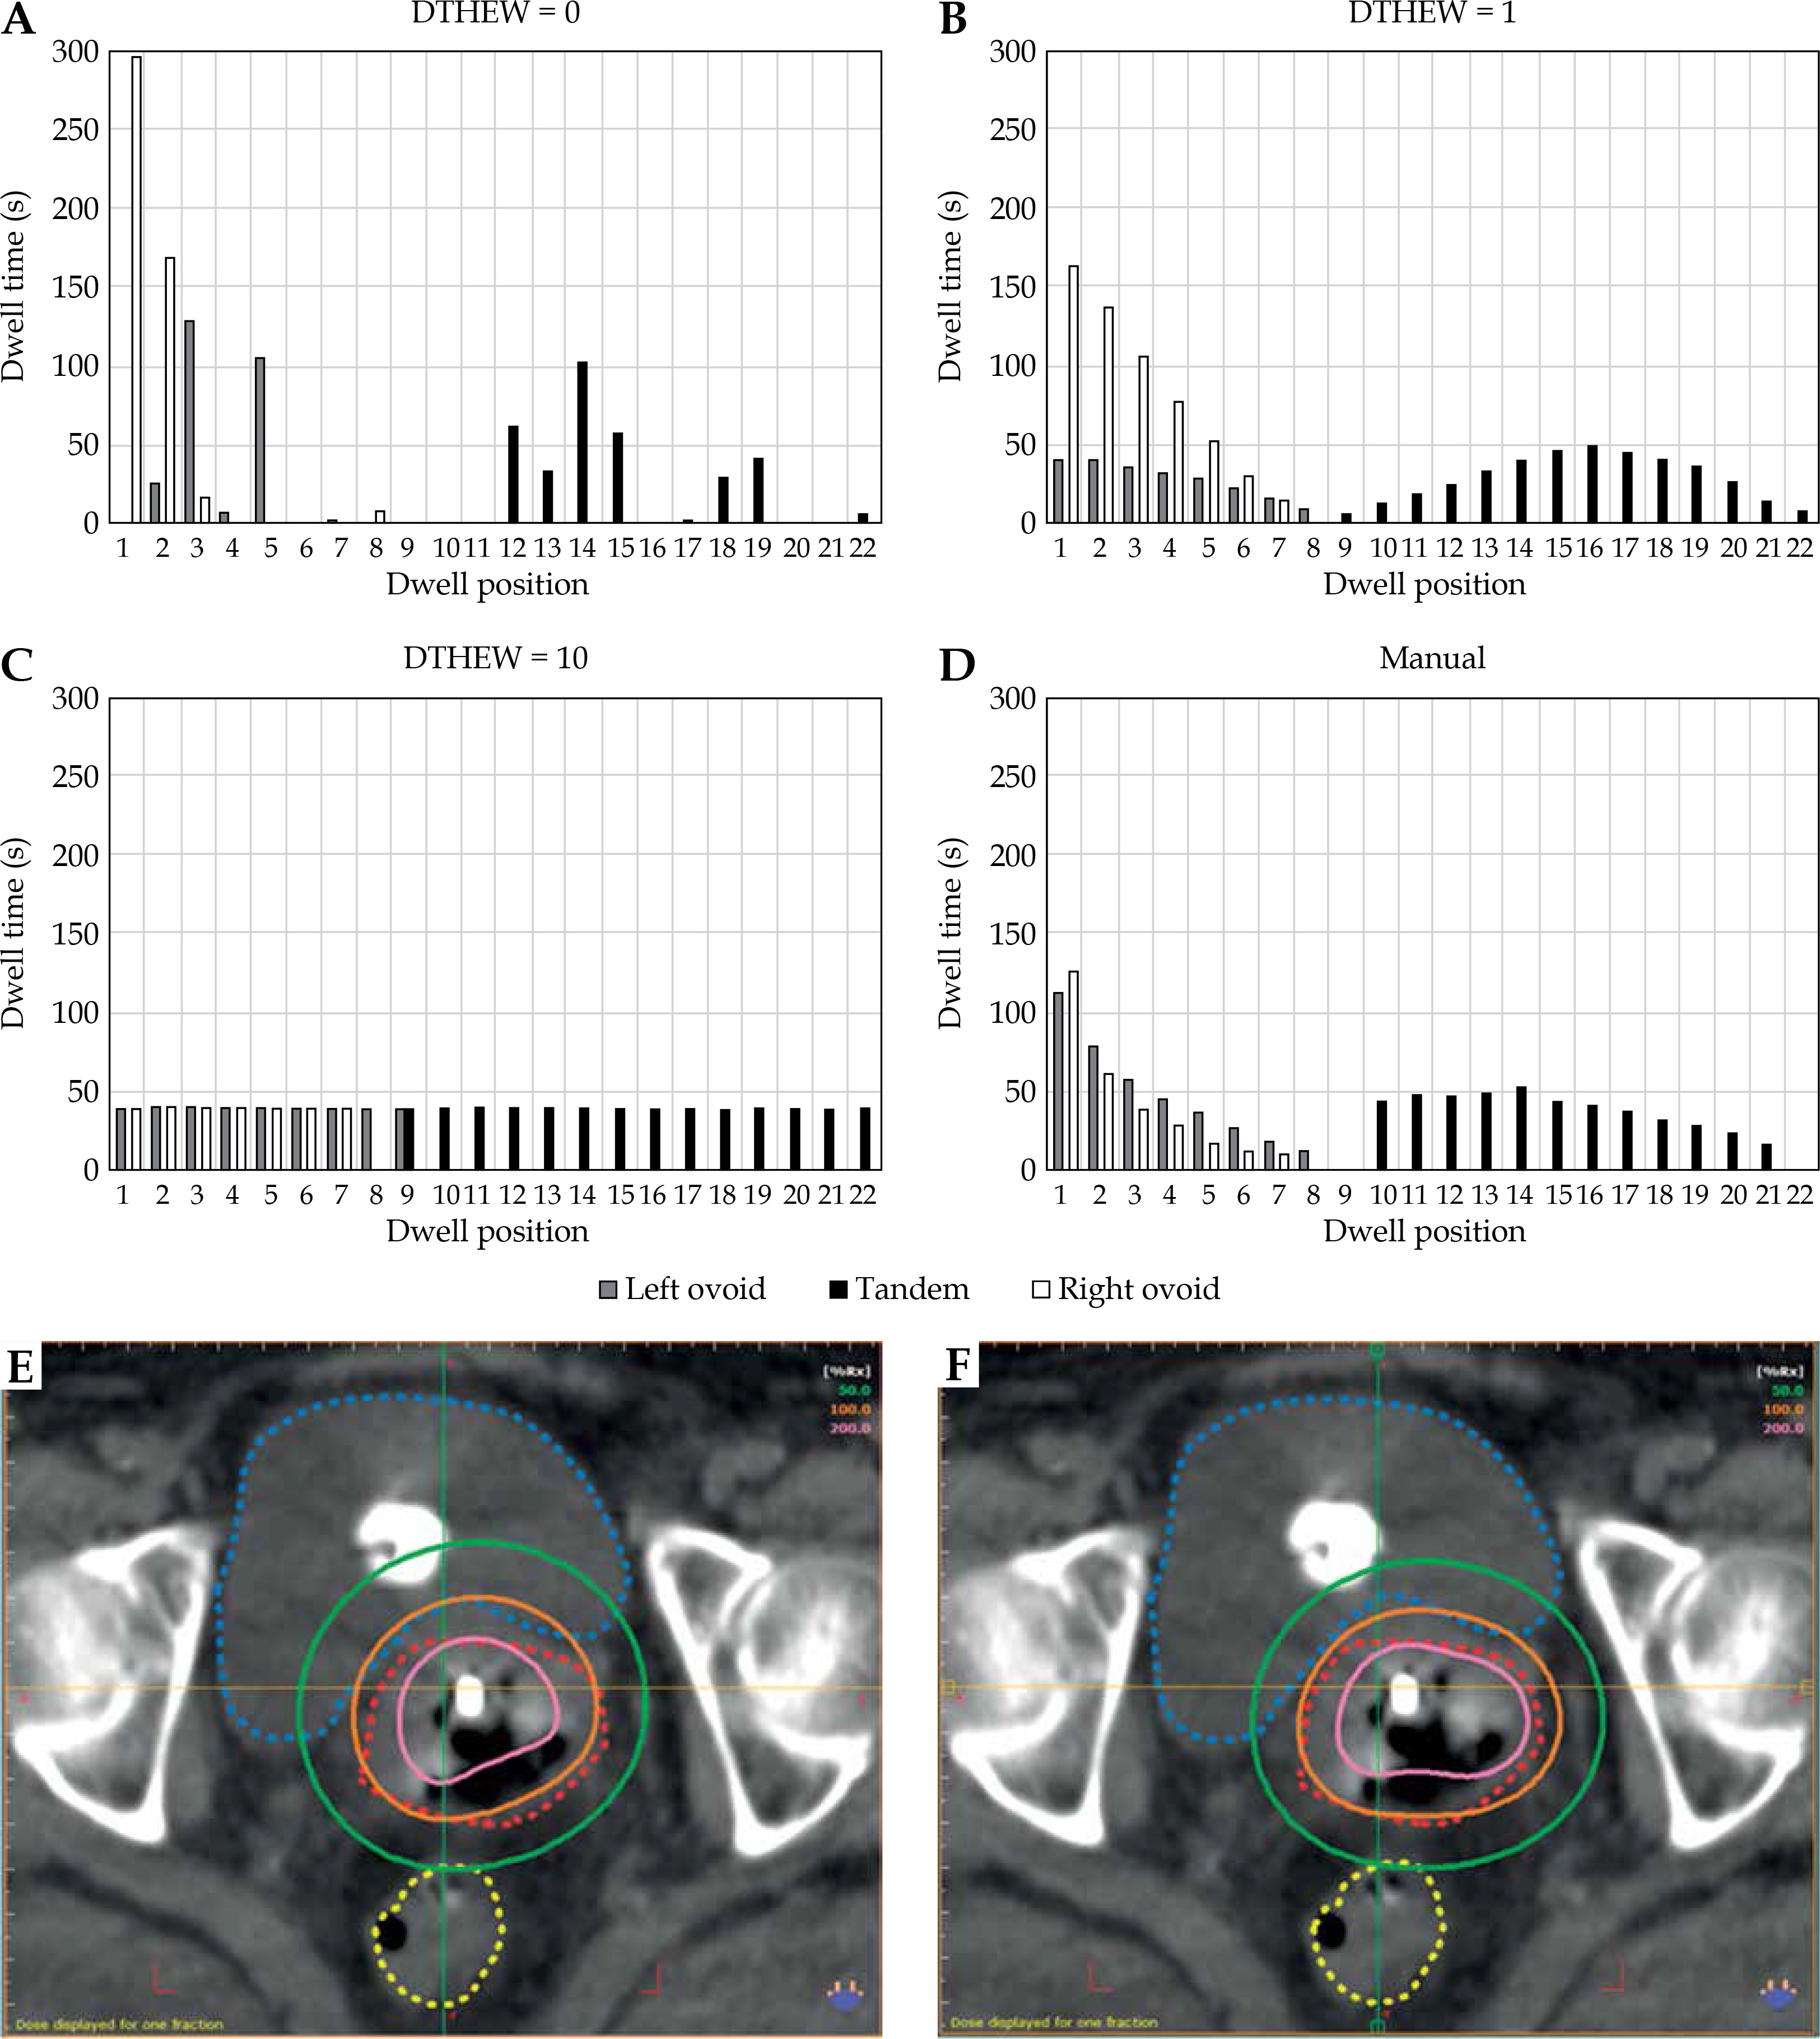
Figure 3 presents the dwell times inhomogeneity, adjacent absolute maximum and mean dwell times gradients, and their averages versus the DTHEW parameter in all 10 patients along the tandem and left and right ovoid applicators in the min/max-based inverse optimization. Increasing the DTHEW value caused a statistically significant decrease in dwell time inhomogeneity (p < 0.001, r = –0.982), absolute adjacent maximum dwell times gradients (p < 0.001, r = –0.945), and absolute adjacent mean dwell times gradients (p < 0.001, r = –1.000) averaged over all patients.
Fig. 3
Dwell time inhomogeneity (A), adjacent absolute maximum (C), and mean (E) dwell time gradient in all patients (A to J), and the corresponding dwell time inhomogeneity (B), adjacent absolute maximum (D), mean (F) dwell time gradient averaged over 10 patients in min/max optimized plans for different values of the DTHEW parameter. The inset graphs present a subset of the same data with limited scale ranges to show the trends and fluctuations better for the non-extreme values of DTHEW, where necessary. The error bars represent one standard deviation from the average of 10 patients
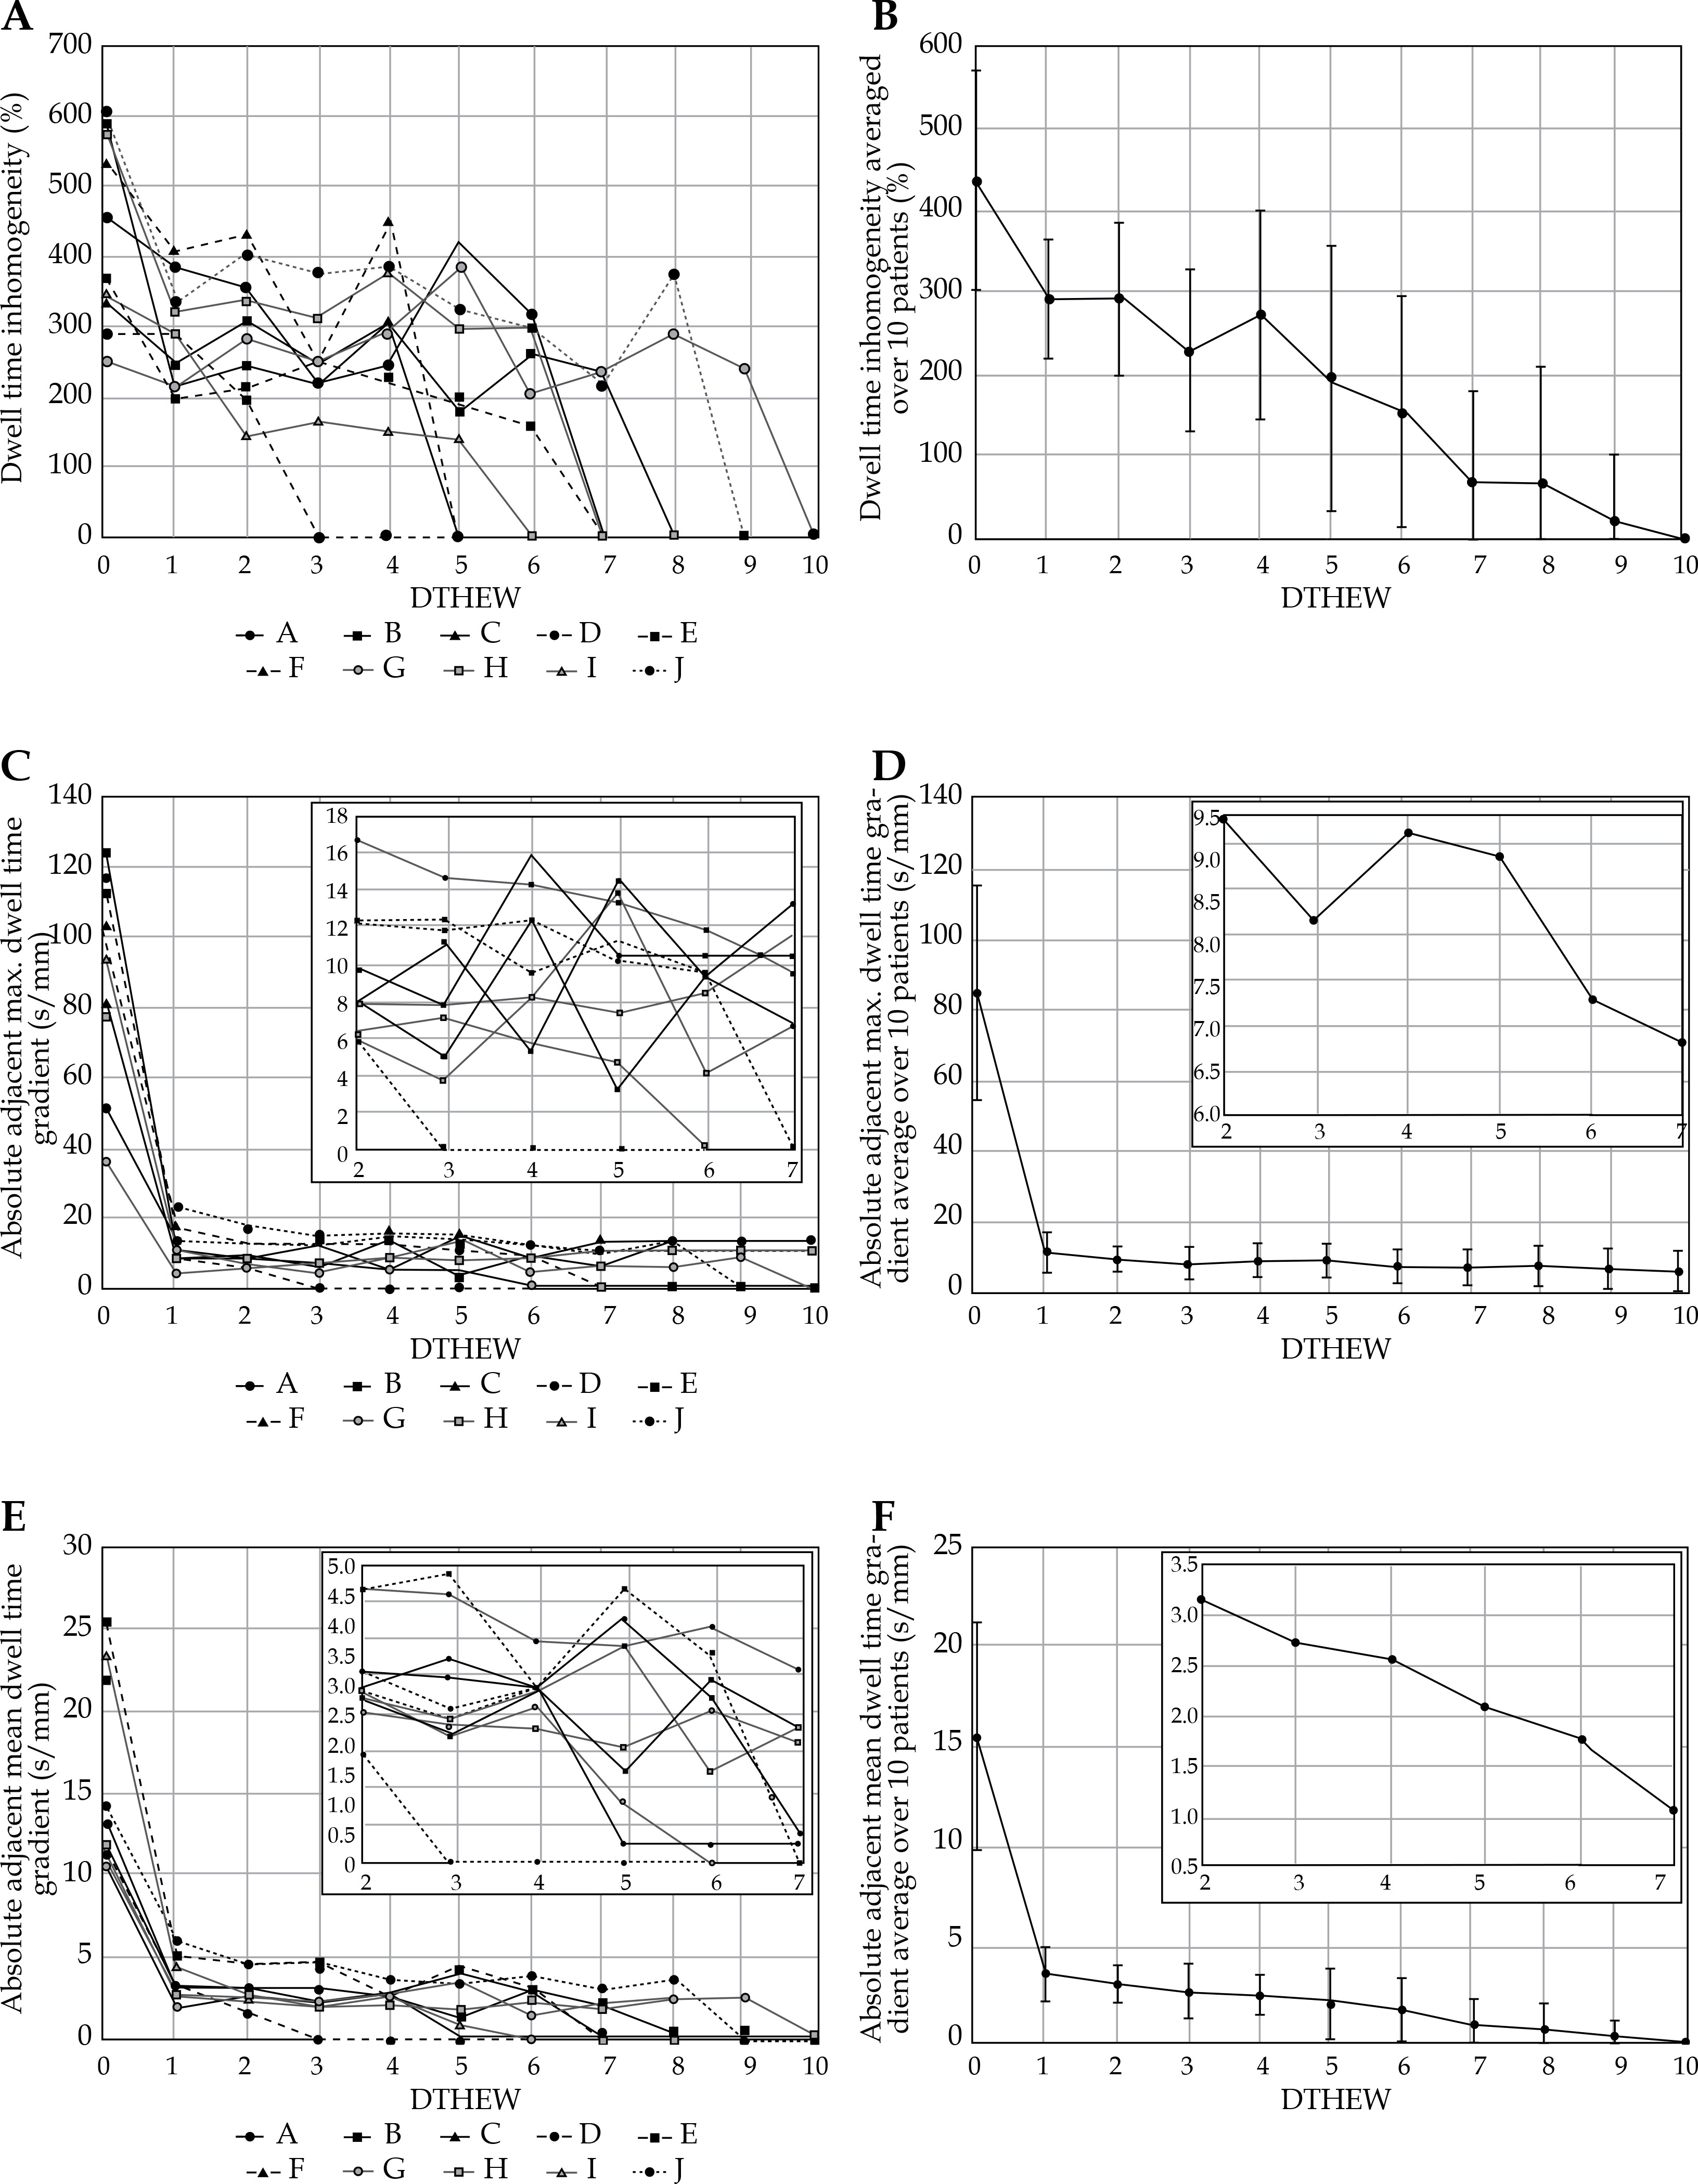
Table 5 summarizes the main statistics on the doses to the target and OARs as well as the total treatment time using the min/max inverse optimization obtained with different values of DTHEW. Mean HR-CTV D90 and mean V100 both show a decreasing trend with increasing DTHEW. The Spearman’s correlation test showed a significant negative correlation between DTHEW and both HR-CTV D90 and V100 (p < 0.001, r = –0.91), and positive correlation between DTHEW and HR-CTV D50 (p < 0.001, r = 0.90). The maximum amount of target coverage occurred with DTHEW of zero. The dosimetric changes in rectum D2cc (p = 0.80) and sigmoid D2cc (p = 0.32) were not statistically significant. Bladder D2cc was the most sensitive to changes in DTHEW, where there was a strong positive relationship between bladder D2cc and DTHEW (p < 0.001, r = 0.99). Despite being excluded from the error function, the total treatment time showed an overall slightly decreasing trend with increasing DTHEW (p = 0.004, r = –0.79).
Table 5
Dependence of the doses to various structures as well as total dwell times on the values of the DTHEW parameter in min/max inverse optimized plans (mean ±SD)
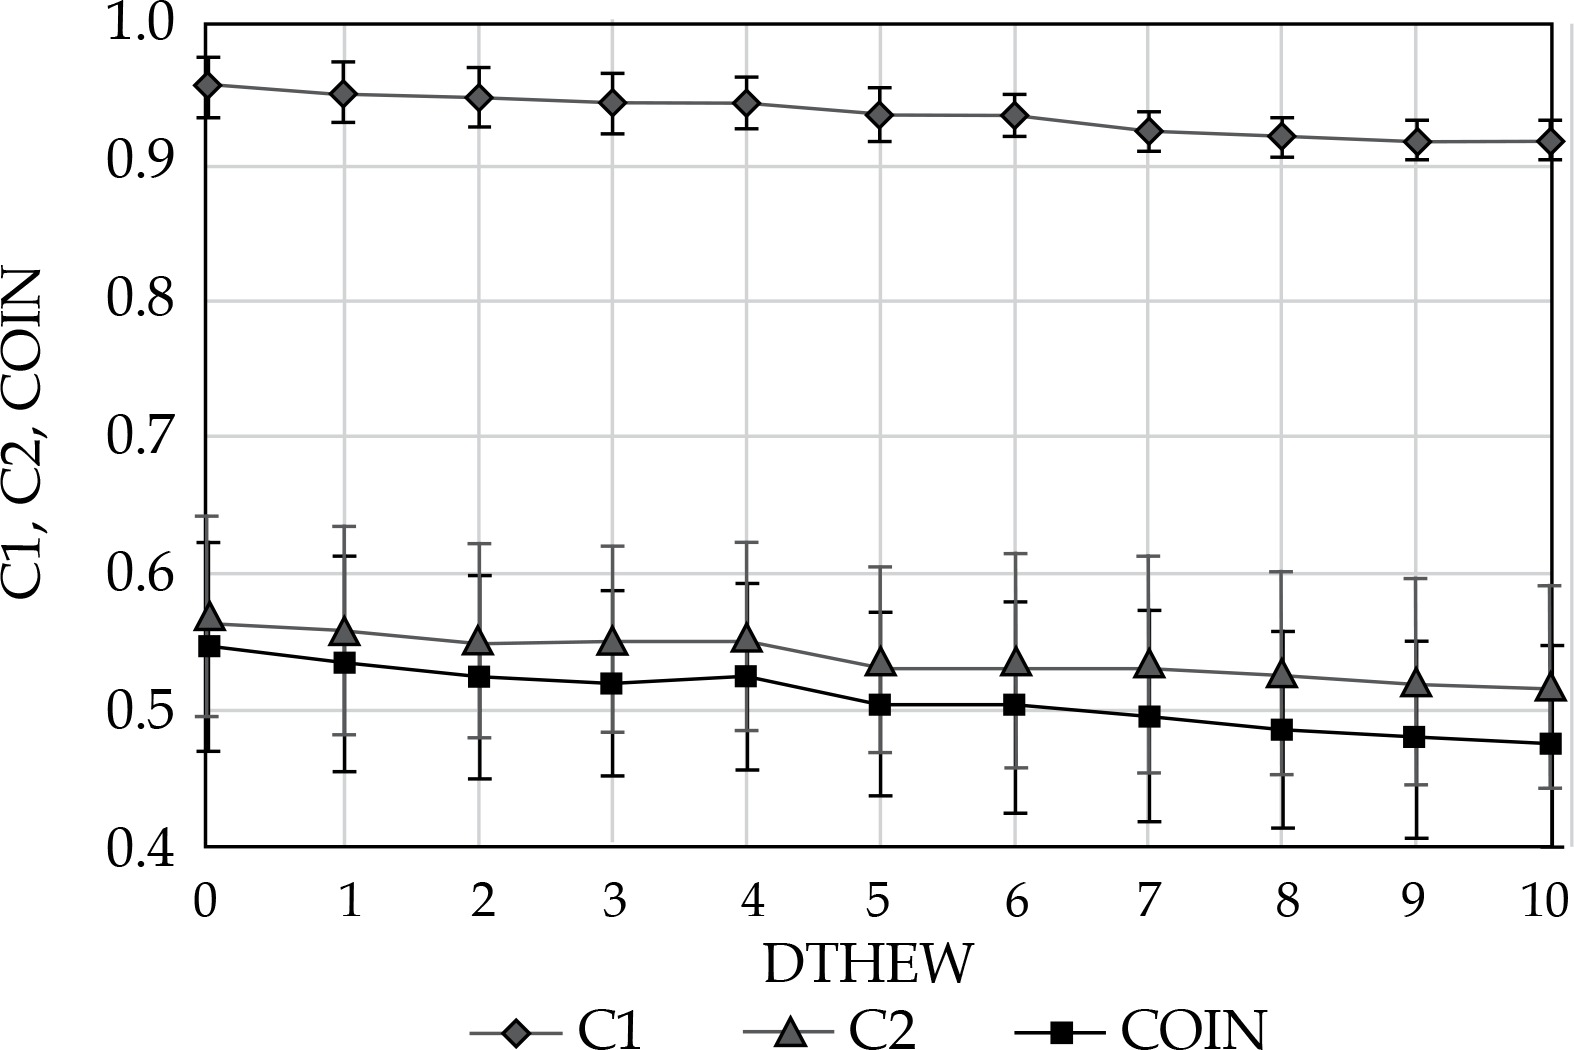
Figure 4 presents a statistically significant negative relationship between C1 (p < 0.001, r = –0.99), C2 (p < 0.001, r = –0.97), and COIN (p < 0.001, r = –0.99) parameters with DTHEW, although the changes in the values of the indices are fairly small.
Discussion
Brachytherapy treatment planning systems allow the user to apply a modulation restriction parameter to limit any large variations of dwell times between adjacent dwell positions. This option helps to reduce the chances of having cold spots in the PTV and hot spots in nearby normal tissues in the event of anatomical variations and applicator displacement. Although some studies have been reported on modulation restriction in IPSA and HIPO optimization mainly on prostate cancer (and a few on cervix) in different planning systems, to the best of our knowledge, this is the first paper reporting on the dosimetric impact of the DTHEW parameter in inverse optimized HDR cervix brachytherapy plans with Fletcher applicators in SagiPlan treatment planning system. Therefore, there is no published study that we can compare our findings with directly. However, we will discuss our results with respect to the limited number of published papers on cervix and prostate using other algorithms on other systems.
Although the focus of this study was not on comparing the variance-based and min/max-based optimization, our pilot study showed some benefits associated with the latter. The comparison between unconstrained variance-based and min/max-based plans shows that, despite producing similar C2 and COIN values, the variance-based method yielded lower C1 and HR-CTV D90 values with statistical significance. The variance-based optimization, as implemented in the SagiPlan system, is faster than the min/max method, which may partly explain its somewhat inferior results. Given the importance of target coverage in cervix brachytherapy, we therefore concentrated on the min/max optimization for the main part of our investigation. A more thorough investigation of the variance-based optimization in SagiPlan and its performance relative to the min/max optimization is indicated.
An element of randomness incorporated into the optimization functions in SagiPlan means that inverse planning leads to somewhat different results in different runs. This happened both when we repeated consecutive runs automatically, using the system setting, and when manually started from the same initial plan. For example, in our typical patient, we found that 10 consecutive runs yielded about 6% SD in COIN values (Table 4). It is well known that inclusion of some randomness in the search in the optimization process can be beneficial in terms of optimization speed and avoiding local minima (e.g., in intensity modulated EBRT optimization) [20,21]. The resulting fluctuations were, however, troublesome in this study, as we aimed to find the best solution for each DTHEW value and avoid being affected by the non-exactness of the solutions. In this study, we selected the default midway value for the balance between speed and quality. Although we did not include the results here, settings favoring quality lead to less fluctuations at the expense of calculation speed.
Another related finding is the lack of a universal agreement between the number of error points (as an indicator of the value of the cost function in the optimization process that needs to be minimized) and a clinically relevant plan quality index such as COIN. As can be seen in Table 4, the minimum number of error point occurred at the 9th run, but the highest COIN value belonged to the 3rd run. Therefore, we can conclude that although conceptually minimizing the number of error points should produce a better plan, the value of a given plan quality index may not agree with that within the 10% or so fluctuations in the number of error points. Our results suggest that, in cases where optimization may prove difficult, the planners may benefit from first removing any nonessential items from being considered in the calculation of error point (e.g., total dwell time) by setting their error weights to zero, and then after setting more than one consecutive run, use the capability of the system to keep the multiple temporary plans to select the best run on clinical grounds (e.g., COIN, HR-CTV D90, OAR D2cc values, etc.).
In unconstrained min/max-based inverse optimization, some of the potential active dwell positions had zero dwell time in the optimized plan (Figure 2). This was compensated by large dwell times occurring at other individual dwell positions. This occurred more for the dwell positions at one or both ends of a line of active dwell positions (e.g., the points nearest to and furthest from the tip of the tandem applicator). This was not the case for the corresponding manually optimized plan, because in such plans, such a pattern of dwell times is not usually selected, and the dwell times are generally more uniform. This behavior of brachytherapy inverse optimization algorithms has been observed and reported previously [6,7,8,22]. For the tandem applicator, for instance, this may be due to the fact that the points in the middle of the target receive dose contribution from several dwell positions either side of this line source, whereas for the points near the tip of applicator, the dose contribution is only from more caudal dwell positions.
In the maximum constraint situation, all the activated dwells positions had the same dwell time. Selecting a nonzero value of DTHEW resulted in increased dwell time homogeneity as well as reducing the mean and maximum adjacent dwell time gradients (Figure 2). The largest step occurred between the unconstrained situation (DTHEW = 0) and DTHEW = 1. However, for greater values of DTHEW, we observed some fluctuations in dwell time homogeneity and gradient in individual patients (as well as the average values in some cases) when DTHEW was changed. This meant that, for instance, increasing DTHEW from 3 to 4 in a patient plan did not necessarily lead to better dwell time homogeneity and shallower gradients. This merits further investigation. In all patients, a DTHEW value of 10 resulted in assignment of equal dwell times to all activated dwell positions. However, in 9 out of the 10 patients, the completely homogeneous dwell time occurred at a lower value of DTHEW (even as low as DTHEW = 3), above which dwell times and plan quality indices remained constant.
The results demonstrated that target dose coverage (HR-CTV D90 and V100) decreased by increasing the value of the DTHEW parameter in min/max optimized plans (Table 5). On average, HR-CTV D90 decreased down to 95% and 92% relative to the unconstrained case by DTHEW values of 6 and 8, respectively. The V100 index was affected less, remaining above 97% and 95% of the unconstrained value up to DTHEWs of 6 and 10, respectively. We mainly focused on HR-CTV D90 rather than D50 because of its stability and common use in plan reporting. We have, however, also added information on HR-CTV D50 for completeness. The correlation between DTHEW and HR-CTV D50 was positive, as opposed to D90, which showed a negative correlation. Trnková et al. used dwell time gradients of 0.5 and 0.2 for tandem and ring applicator and combined intracavitary/interstitial implant, respectively, and reported that dwell time gradient restriction was more important for tandem and ring applicators [23]. Also, for prostate brachytherapy, Balvert et al. reported a decrease in target dose coverage with larger values of DTGR in HIPO optimization [9].
Increasing the value of the DTHEW parameter also negatively affected the COIN index. The best COIN value was obtained with DTHEW = 0 (Figure 3). In contrast, considering prostate brachytherapy studies, Smith et al. using inverse optimization with IPSA found that a DTDC parameter up to 0.4 resulted in an acceptable plan [7]. Movroidis et al. reported that HIPO with modulation restriction value of 0.1-0.2 delivered a higher COIN in HDR prostate brachytherapy [11].
The effects of changing DTHEWs were not the same on doses to the OARs. On average, with DTHEW ≥ 3, doses greater than the 6.2 Gy constraint to bladder D2cc were obtained. However, the received dose of rectum and sigmoid colon D2cc were not affected by the DTHEW values in a statistically significant way. The D2cc of rectum, averaged over all patients, was higher than the constraint of 4.4 Gy, even with DTHEW = 0. This was, however, not the case in all individual patients. Increasing the weight of the rectum dose constraint improved its D2cc dose for those patients but led to unacceptably low doses to the HR-CTV (results not included here). One reason may be that, in our study, the whole cervix was considered as the PTV. This was due to the fact that the plans were not MRI-based, in which case delineation of a smaller target could have been possible with the positive consequence of lower doses to surrounding OARs. Another possible contributing factor may have been the fact that the auto-activation of dwell positions was allowed to extend outside the PTV surface by up to 5 mm, if required by the optimization algorithm. Another possible reason may have been insufficient vaginal packing for the subset of patients with high rectal wall dose. The strategy pursued in this study was to use a single set of objectives and criteria for consistency in reporting. The 10 patient plans had been selected as a representative sample of the cases seen in the clinic and in any case, as this was a comparative study, the overall conclusions remain unaffected.
One of the strengths of this study is that a number of plan quality indices were considered to evaluate the clinical plans rather than using only COIN. There are different reported formulations for calculation of COIN. Moreover, some planning systems do not calculate and display this index. The SagiPlan treatment planning system calculates C1 and C2 and multiplies them to produce COIN. Our findings have, therefore, been compared to studies with the same method of COIN calculation. Another formula applies a third element, C3, to take into account the doses received by the OARs [24]. A general shortcoming of the available COIN calculation methods may be that they consider the two or three elements with equal weight, i.e., the same COIN value may be obtained through various combinations of C1, C2 (and C3, if considered), for example, a good dose conformity (high C2 or C3), but poor PTV coverage (low C1) or vice versa. We, therefore, have stated the C1 and C2 values as well as the COIN and various other indices to provide more information on the dose distribution. Application of a weighting factor for each element has been suggested for COIN [25].
A limitation of our study was the relatively small sample size (10 patients) that may have impacted on the p-values and reduced the power of the study. However, the high values of the correlation coefficient (r) partly compensated this relative weakness. This resulted in statistical significance in most of our reported results (with the exception of rectum and sigmoid colon D2cc dose). Moreover, the retrospective nature of the study meant that additional information or measurements could not be obtained prospectively.
Currently, only a single DTHEW parameter can be applied to all applicators. Individual applicators, therefore, cannot be left unrestricted. Incorporation of such a utility may be beneficial when it is desired to differentiate between tandem and ovoids applicators in this respect [8].
Manual planning has been the conventional method of planning cervix brachytherapy. Manual optimization can be time consuming and its quality depends on the planner’s experience. The focus of this paper, however, was on inverse planning as a useful alternative to manual planning. Although we have not included the results in accordance to the focus of the paper, a pilot comparison of manual and inverse planning on a few of patients showed that the quality of inverse plans was either better or similar to manual plans. This is in general agreement with the previously published findings of inverse versus manual optimization in HDR cervix brachytherapy [13,26,27,28].
Finally, although we have not included the details here, we found that the optimization speed of the system was lowest with DTHEW = 0 and decreased at higher values of the DTHEW parameter (above about 5). This may be explained by the fact that a high DTHEW parameter limits the range of dwell times to be considered in the optimization process and, therefore, the best solution within that smaller range is reached more quickly.
The present study was carried out for an afterloader that uses a 60Co source. Given the predominance of the inverse-square law, the energy of the gamma-rays emitted by different radioisotopes has a relatively small influence on dose distributions in brachytherapy. Only small, often clinically insignificant differences have been reported between cervix plans using 60Co or iridium-192 HDR sources [15]. This is especially true when dwell time optimization is utilized [15,29]. Moreover, cervical cancer patients who were treated with 60Co or 192Ir HDR afterloaders have been reported to have statistically nonsignificant differences in two- and five-year disease-free and overall survival and toxicity outcome [29].
It should be emphasized that this study only considers a static patient plan and tries to optimize it without considering the possible benefits of using a higher DTHEW parameter in terms of robustness against any applicator displacements and other variations. Moreover, the patient selection for this study only included intracavitary tandem and ovoid plans, and excluded any cases requiring additional interstitial needles. Consideration of non-static scenarios and inclusion of interstitial needles are both of interest for further investigation.
Conclusions
Averaged over a group of patients, selecting a nonzero value of the DTHEW parameter results in a general increase in dwell time homogeneity and decrease in mean and maximum adjacent dwell time gradients, especially between the unconstrained situation (DTHEW = 0) and DTHEW = 1. For DTHEW > 1, increasing this parameter does not always result in more homogeneous dwell times or reduced gradients in individual patients. The randomness incorporated in the behavior of the optimization functions can lead to somewhat different plan quality indices and optimization function values in different runs of SagiPlan.
Assuming a static planning and treatment geometry (i.e., ignoring the possibility of applicator displacement and anatomical variations), based on various indices, some degradation of plan quality results from restricting the dwell time homogeneity by the use of nonzero values of the DTHEW parameter in min/max-based optimization of cervix HDR brachytherapy plans using the SagiPlan treatment planning system. In such a scenario, setting the DTHEW value to zero is indicated for the type of patient plans investigated in this study. Studying the influence of the DTHEW parameter under non-static conditions is of clinical interest and underway.


