
Purpose
Cervical cancer is the third most common gynecologic cancer, with over 500,000 new cases per year worldwide, resulting in over 300,000 deaths [1, 2]. The standard treatment for locally advanced cervical cancer is concurrent chemoradiotherapy followed by brachytherapy (BT) that enables dose escalation to target volumes without compromising organs at risk (OARs) [3, 4]. Three-dimensional image-guided brachytherapy (3D-IGBT) yields a precise planning, improves disease control and overall survival (OS), and reduces morbidity compared with two-dimensional brachytherapy (2D-BT). 3D-IGBT is the current treatment of choice [5-7]. Although magnetic resonance imaging (MRI)-based planning is the standard approach, comparable results are shown with computed tomography (CT)-based planning [5, 8]. 3D-IGBT is implemented more commonly with a CT guidance due to logistic and technical limitations in many centers, whereas CT-based IGBT is an alternative option when assisted by pre-BT diagnostic MRI [9].
Current evidence suggests that accurate delineation of target volumes in BT planning directly impacts clinical outcome [10, 11]. Even though there are guidelines for volume definitions in BT planning of locally advanced cervical cancer, target volume delineations may differ significantly in clinical practice, even among the most experienced radiation oncologists (ROs), which in turn may lead to huge dose variations in both target volumes and OARs [12, 13]. In the literature, several studies have reported inter-observer variability (IOV) in MRI-guided 3D-IGBT; however, studies for CT-guided 3D-IGBT are limited [8, 14-16]. Delineation with CT guidance can even cause more variations among ROs than with MRI guidance due to worse visualization of the target and adjacent tissues. The current study aimed to assess IOV in target volume delineation of CT-based 3D-IGBT for locally advanced cervical cancer.
Material and methods
Computed tomography images of ten patients with a biopsy-proven cervical cancer, treated with a curative intent in our clinic between August, 2022 and January, 2023 were used for the current study, and institutional ethics board approved the study (GO 21/276, March 2, 2021).
A thorough gynecological examination was performed before the treatment, and schematic diagram of tumor and vaginal anatomy of each patient was drawn on a separate sheet. Positron emission tomography (PET)/CT and pelvic MRI were the imaging techniques used for staging at the time of diagnosis. All patients received 45-50.4 Gy whole pelvic external beam radiotherapy (EBRT) in 28 fractions using volumetric modulated arc therapy (VMAT) with Elekta Versa HD linear accelerator (Elekta AB, Stockholm, Sweden). Concurrent with EBRT, weekly cisplatin 40 mg/m2 was administered to all patients. In patients with para-aortic lymph node (LN) metastasis, and para-aortic or paracaval lymphatics, in addition to pelvic, fields were also treated up to the left renal vein. When there was PET avid lymph nodes or highly suspicious lymph nodes detected by MRI scan, boost doses to these metastatic lymph nodes were routinely applied. Another thorough gynecologic exam with detailed schematic diagrams was drawn on separate sheets, and new MRI was performed for response evaluation for all patients at the end of EBRT. BT with 28 Gy HDR-IGBT in 4 fractions was delivered to central disease with 192Ir sources using GammaMed Plus iX BT unit (Varian Medical Systems, Palo Alto, CA, USA). Intra-cavitary application was performed under high sedation in the operating room, and all patients underwent a CT scan using Toshiba Aquilion LB CT Simulator (Toshiba Medical Systems, Otowara, Japan) after every insertion with applicators in place. As a CT simulation protocol, 100-120 kVp tube voltage, 300-350 mAs current value, and 2 mm slice thickness were applied. After simulation processes, CT images were transferred to BrachyVision treatment planning system (TPS) version 8.9 (Varian Medical Systems, Palo Alto, CA, USA) via digital imaging and communication in medicine (DICOM) connection.
Forty CT images of 10 patients, who had been treated with standard tandem-ovoid applicators were selected for this study. Original contouring and treatment plans were masked, and new target volume determinations were made based on gynecologic examinations recorded in patients’ files, and MRI scans at diagnosis and just before first BT application. No MRI was obtained before following BT fractions. OARs, high-risk clinical target volume (HR-CTV), and intermediate-risk clinical target volume (IR-CTV) were contoured on planning CTs according to the Gynecological Groupe Européen de Curiethérapie and European Society of Radiotherapy and Oncology (GYN-GEC ESTRO) guidelines. First contouring was done by the most experienced RO, who is a senior professor (RO-ref) [12], followed by other three ROs in a blinded manner. The first RO among them is an associate professor, the second is an assistant professor, and the third is a fellow on BT rotation. Delineations by the RO-ref were used as an index for treatment optimization and comparison of delineations done by other ROs. Following target delineations, tandem and ovoids were subtracted from the contours prior to planning.
Methodology of volumetric comparison and statistical analysis
Each CTV was measured with TPS and expressed in cubic centimeters (cc). Delineations were compared using dice similarity coefficient (DSC) and Hausdorff distance (HD) metrics. Overlap-based DSC described the relative overlap of delineated volumes, index volume (V1), and reference volume (VR), formulated as follows:
D (V1, VR) = 2 (V1∩VR)/(V1 + VR).
It ranges from 0 to 1; a score of 1 indicates a perfect overlap and 0 no overlap; values > 0.6 and > 0.8 are considered good and very good, respectively [17, 18]. Spatial distance-based HD was defined as the longest distance from a point in one contour to the closest point in another contour, and measured how far surfaces of the two contours were from each other [19]. 95% HD (HD95) was the distance that represented the longest surface-to-surface distance among the closest 95% of the points, and the average HD (HDave) was the mean of the longest surface-to-surface distances. We preferred using HD95 and HDave, as the maximum HD can be significantly affected by a few points with very large distances, whereas HD95 is less sensitive to such outliers, since it only considers the closest 95% of the points. The advantage of using HDave is that it provides a more comprehensive measure of similarity between the two sets of points. HDave takes into account all the distances between the points in two sets rather than the maximum or percentile of distances, as in HD95. A higher HD between two contours indicates dissimilarity between two sets, and HD of 0 mm indicates identical volumes.
All statistical analyses were performed using the statistical package for the social sciences (SPSS) software version 21 (SPSS Inc., Chicago, IL, USA). Descriptive statistics were presented as median (range, min-max). Chi-square test or Kruskal Wallis test were applied to compare different groups. Mann-Whitney U test was used to assess the significance of pairwise differences, with Bonferroni correction to adjust for multiple comparisons. A p-value < 0.05 was considered statistically significant.
Results
The median age of patients was 53 years (range, 31-70 years). The histological sub-type was squamous cell carcinoma for all patients. The FIGO 2018 stage was IB2 in one, IB3 in three, IIA2 in one, and IIB in five patients. The median tumor size was 52 mm (range, 35-78 mm) at diagnosis. Five patients were found with parametrial extension and 5 with vaginal involvement. After EBRT and prior to BT, 3 patients achieved complete response and 7 patients partial response, with a median residual tumor size of 16 mm (range, 0-40 mm). The uterus was anteverted in 8 patients and retroverted in 1 patient during every four fractions of BT, whereas in one patient, the uterus position varied between fractions. Tumor characteristics of all patents are shown in Table 1.
Table 1
Tumor characteristics of all cases
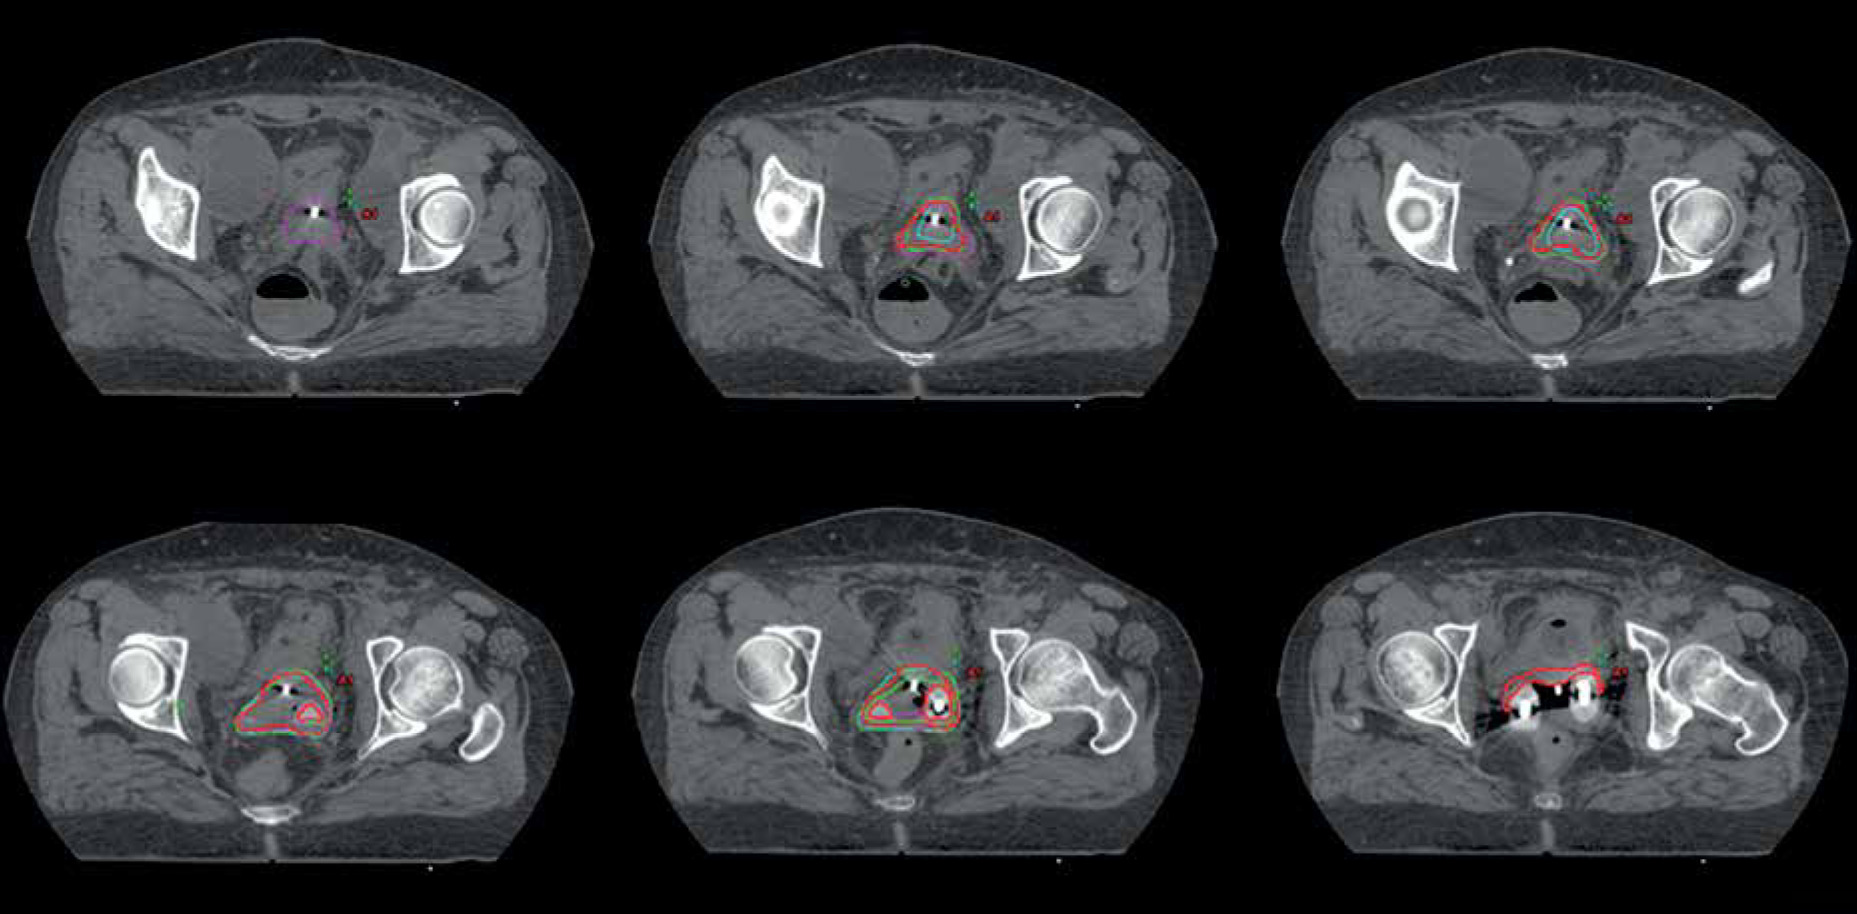
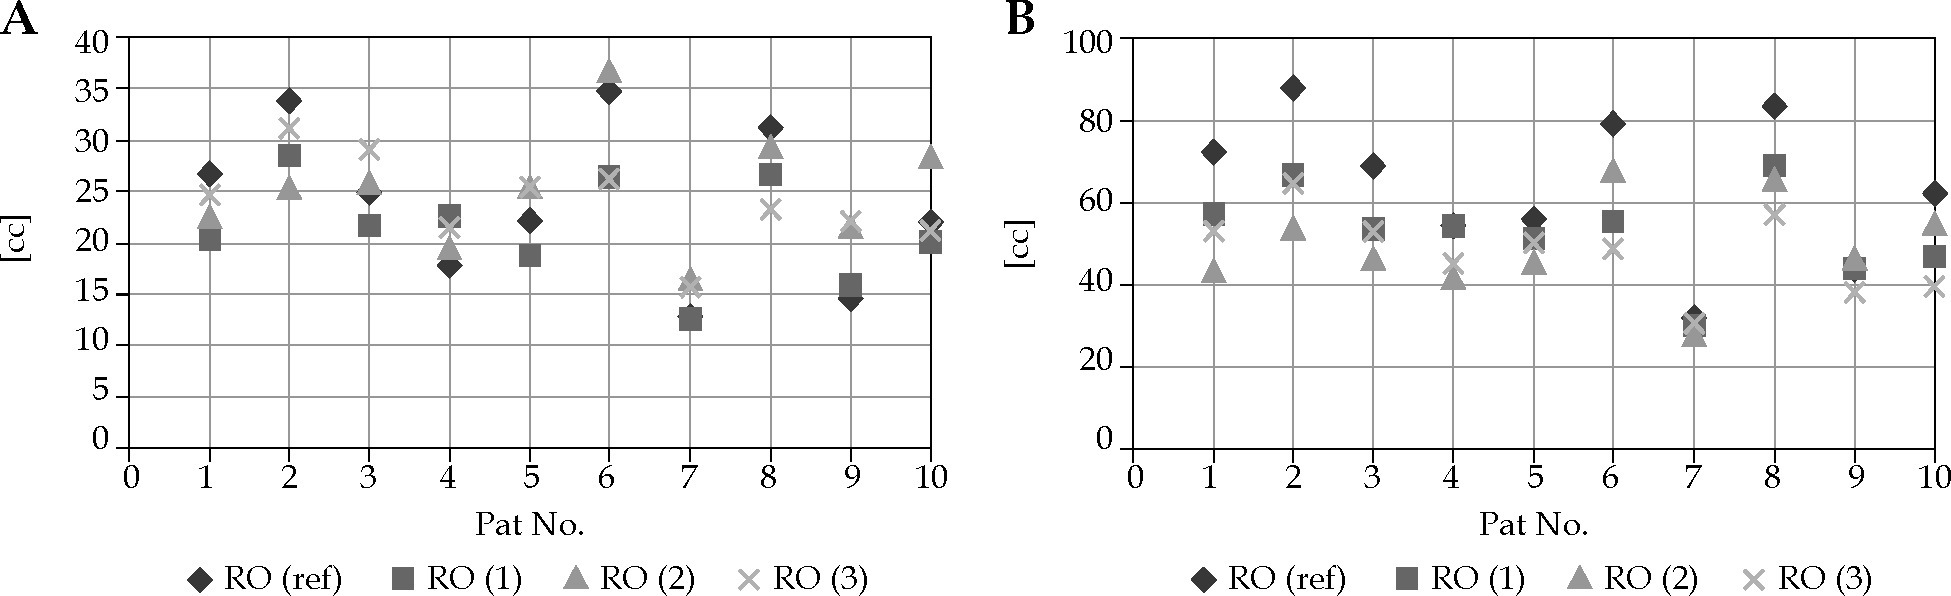
All 4 ROs delineated HR-CTV and IR-CTV on forty CT datasets of 10 cervical cancer patients. The delineation process yielded 16 sets of HR-CTV and IR-CTV for each patient. Including those of RO-ref, a total of 320 volumes were evaluated. Figure 1 shows an example of the contours of all ROs on CT slices of patient no. 3. Descriptive statistics of the volumetric, DSC, and HD measurement results of each RO for both HR-CTV and IR-CTV are presented in Table 2. The volumes of HR-CTV were similar among all ROs; however, a statistically significant difference was found for IR-CTV volumes. Figure 2A, B shows the volumetric distribution of delineations of all ROs for HR-CTV and IR-CTV, respectively. Case-by-case volumetric difference between the ROs was inconsistent (Suppl. Table 1). While one RO had the largest HR-CTV in one patient, she could have the smallest volume in another. However, the RO-ref contours were the largest for all IR-CTVs. The volumes of HR-CTV were significantly different than those of RO-ref in cases no. 1, 6, 8, and 9, while IR-CTVs were significantly different in patients no. 1, 2, 3, 4, 6, 8, and 10. As the number of cases was limited, we could not detect any common characteristics of these cases that could have yielded these differences.
Fig. 1
Representative image of HR-CTV delineations of four ROs (red: RO-ref; magenta: RO-1; green: RO-2; cyan: RO-3)
The median DSC value was 0.73 (range, 0.54-0.85) and 0.76 (range, 0.58-0.87) for HR-CTVs and IR-CTVs, respectively. Overall DSC for IR-CTVs was significantly better than for HR-CTV (Table 2). A good agreement was achieved for both HR-CTVs and IR-CTVs in 97% of all contours when compared to those of RO-ref (Suppl. Tables 2 and 3). The DSC values for eight (5%) HR-CTVs and one (1%) IR-CTV were < 0.6 (but > 0.5), and the median DSC was ≥ 0.8 for 41 (13%) volumes. There was no difference in DSC measurements for HR-CTVs among the three ROs; however, RO-3 provided significantly higher DSC values for IR-CTVs (Table 2).
Table 2
Volumetric, DSC, HD95, HDave metrics, and comparisons between ROs for HR-CTV and IR-CTV
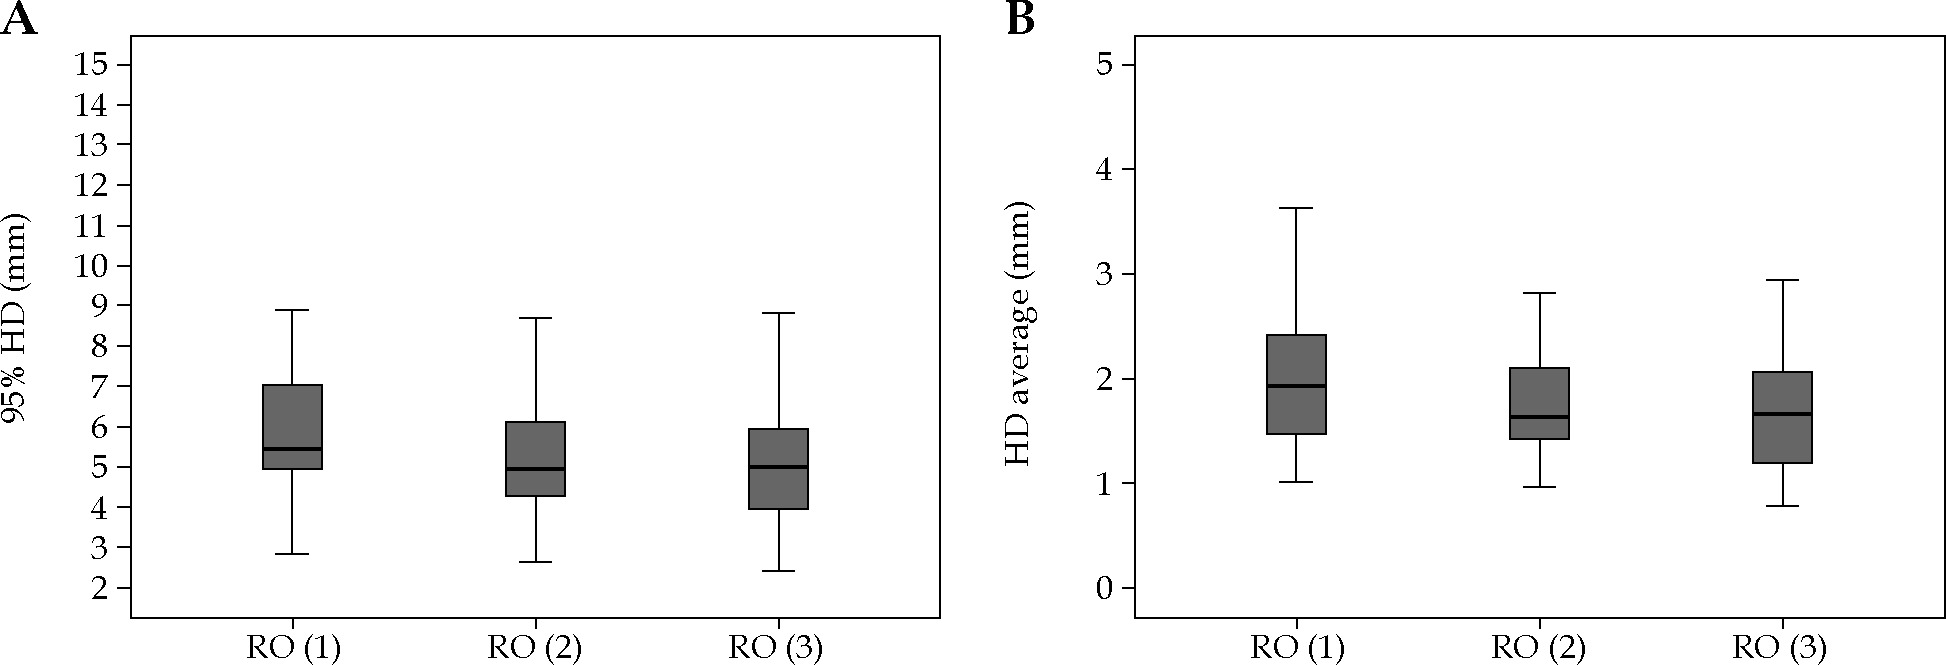
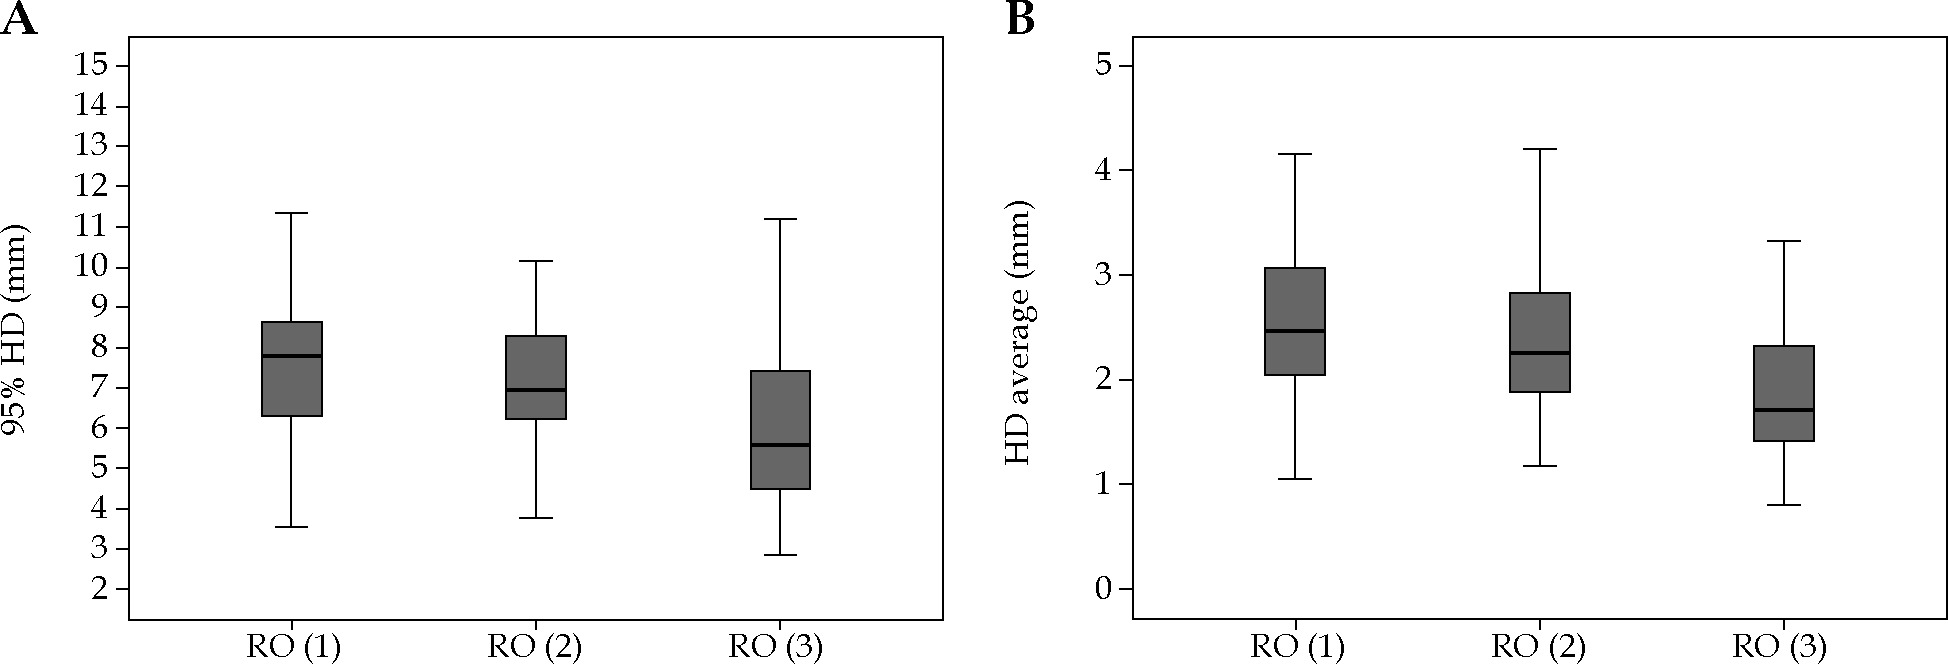
The median HD95 was 5.02 mm (range, 2.42-12.3 mm) and 6.83 mm (range, 2.84-16.9 mm) for HR-CTVs and IR-CTVs, respectively. HD95 was > 10 mm in 13 (4%) volumes (in three HR-CTVs and ten IR-CTVs). The median HDave for HR-CTVs and IR-CTVs was 1.69 mm (range, 0.79-5.39 mm) and 2.21 mm (range, 0.81-5.40 mm), respectively. Similar to the DSC, HD95 and HDave were comparable for HR-CTVs among the three ROs. However, both values for IR-CTVs were significantly lower for the RO-3 compared to the RO-1 and RO-2 (Table 2). The box-plot graphs of HD95 and HDave for the three ROs is presented in Figures 3 and 4 for HR-CTVs and IR-CTVs, respectively.
Although the collective analysis of HR-CTV and IR-CTV comparisons among the three ROs yielded mostly similar results for DSC, the case-by-case analysis showed significant variations for cases no. 1 and no. 6 (Suppl. Table 2 and 3). Overall HD metric comparisons differed among the three ROs, and in case-by-case comparisons, only cases no. 1 and no. 6 were different, similar to DSC (Suppl. Tables 2 and 3). In case number 6, RO-2 had a higher similarity to those of RO-ref for DSC and HDs. On the other hand, in case no. 1, the findings favored RO-3 for DSC and RO-2 for HDs in terms of similarity to those of RO-ref. We evaluated these two cases with the lowest level of agreement in detail to determine the reasons of differences. In case no. 1, the small bowel was adhered to the uterus making it difficult to visualize the borders of the uterus and parametrial fields. On the other hand, case no. 6 had a retroverted uterus and the largest residual disease following EBRT. These findings indicate that the characteristics of each case may impact the level of variation.
Discussion
The aim of the present study was the evaluation of IOV in delineating target volumes in 3D-CT-based IGBT for cervical cancer, and as far as we know, this is the first study on IOV contouring for CT-guided BT. The target volume delineation of the senior author was selected as reference contouring for this study, and all variations of the volume delineations of the 3 remaining ROs were investigated based on this contouring.
We found that the volumes of HR-CTV and IR-CTV were similar among all the ROs. The median HR-CTV volumes ranged 21.3-24.61 cc, with no statistically significant difference among the ROs. The median DSC values for HR-CTV varied between 0.71 and 0.75, again without statistical difference among the ROs. When the DSC values were considered case-by-case, the minimal DSC was 0.56 for RO-1, 0.54 for RO-2, and 0.6 for RO-3. The median DSC for IR-CTV on the other hand was 0.76, with minimum values ranging between 0.58 and 0.87. A good agreement was observed among the ROs, as DSC values were generally high (> 0.7). While there was no significant difference in terms of DSC values for HR-CTV; DSC for IR-CTV of RO-3 was significantly high compared with two other ROs. The probable reason that the best agreement with RO-ref was achieved by RO-3 is that RO-3 was working individually with RO-ref at that time, and the two ROs examined the patient together. However, RO-1 and RO-2 did the delineation based on written notes of RO-ref and RO-3, and did not examine the patients by themselves. The reason why the contours of RO-3 were also smaller than those of RO-ref is probably that RO-3 retrospectively delineated the contours again after some time, so she could only remember certain details of patients’ examinations.
Accurate target delineation is a precondition for RT, since all subsequent treatment planning and delivery steps are based on delineation. Incorrect delineation can lead to a reduced dose delivered to CTV, which may reflect in a decrease in local control rates, worse survival, and increased morbidity [20, 21]. Despite that contouring guidelines help improving consistency among physicians, there may still be considerable delineation differences among them [22-25]. Accurate target volume delineation relies on a comprehensive data interpretation process, which requires understanding of clinical and pathological findings, imaging and operation reports of a case, being familiar with the pathways of tumor spread, and evaluating strengths and limitations of different imaging modalities. In our study, the best agreement with RO-ref was achieved by RO-3, who was an active learning resident of gynecological BT department under the supervision of RO-ref. These results suggest that RO-3 should still interpret the delineation based on guidelines, but experience is also crucial.
Inter-observer variations in target delineation, which represents the greatest uncertainty for most tumor sites, can lead to a systematic error and eventually affect the oncologic outcomes [26]. Most published articles on IOV for cervical cancer RT evaluated the contouring variability for EBRT. These studies showed that target delineation may vary among observers, and can lead to important dosimetric consequences [27-29]. For BT, Petrič et al. [16] examined IOV among ten ROs in six patients treated with MRI-guided BT, and reported no significant difference in terms of topographic, volumetric, or dosimetric outcomes. In this study, the authors compared two reference delineations by calculating volumetric conformity index (VCI) and inter-delineation distances (IDD). For expert consensus (EC) comparisons, the VCI was reported 0.72 and 0.68 for HR-CTV and IR-CTV, respectively, and the IDD for HR-CTV was significantly lower than it was for IR-CTV (3.8 ±3.4 mm vs. 5.2 ±5.6 mm). Although a direct comparison with our study cannot be made, the DSC metric used in the present study was similar to the VCI (i.e., the ratio between the common and encompassing volume) analysis, and the HDave measurement was based on parallel formulations with the IDD measurement (i.e., the mean shortest inter-delineation distance). Although our DSC and HD metrics are close to Petrič et al.’s study results, the main difference in our results was that the IR-CTV compatibility was better than it was for the HR-CTV in DSC analyses. However, similar to their results, we observed larger HD measurements for IR-CTV than HR-CTV. The low IR-CTV agreement may be due to the fact that IR-CTV covers the disease extension at the time of diagnosis that was not present at the time of BT. In another study, treatment plans were made according to individual contours, dose-volume histogram (DVH) parameters were determined, and IOV was analyzed [30]. As a result, a variability of approximately 3 Gy for the dose received by 90% of the volume (D90) for HR-CTV, and 1.2-3.6 Gy for the dose received by 2 cc (D2cc) of OARs were reported. Similarly, in a study by Hellebust et al. [15], investigating the dosimetric IOV impact of delineation in MRI-guided BT, the variations in HR-CTV delineation and subsequent dosimetric calculations showed potential dose uncertainties up to 5 Gy. A significant limitation of the current study is that the dosimetric consequences of IOV were not evaluated. Dosimetric analysis could provide the clinical reflection of IOV more accurately. While interpreting our findings, it should be kept in mind that dosimetric effects of variability are more significant in highly conformal techniques, such as BT and stereotactic RT [31].
In a study by Dimopoulos et al. [14], two ROs delineated gross tumor volume (GTV), HR-CTV, and IR-CTV of 19 patients treated with IGBT. While the GTV and HR-CTV were similar between the ROs in topographical examinations, the IR-CTV was significantly different. Although the same comparison technique was not used, conformity index (CI) with a similar to DSC definition, ranged between 0.5 and 0.7, similar to our study. In another research from Australia and New Zealand, nine ROs and two radiologists contoured HR-CTVs on 3T-MRI images of 10 patients [32]. They also used DSC to compare contours with two different reference contours, and reported a good concordance in the majority of cases, consistent with our results. However, despite this concordance, the authors observed a dosimetric variation of approximately 1.5 Gy when 8 Gy fractions were prescribed, and suggested that this could be clinically significant.
The IOV in our study was lower for the HR-CTVs, but higher for the IR-CTVs. We evaluated two cases with the least agreement in detail to understand that one case had a retroverted uterus with residual parametrial disease after EBRT, while the other had unclear visualization due to small bowel adhesions to the uterus and parametrial fields. These findings suggest that the unique characteristics of each case may influence variation levels. Although retroverted uterus application can be challenging with an increased perforation rate, there is no specific study of importance in defining target volume in the literature.
The impact of IOV in delineation is often greater than set-up errors or uncertainties associated with organ movements, and should be considered while determining PTV margins. Along with other quality assurance steps, the variability in volume definition should also be considered at every center. The reasons for the IOV in contouring are multifactorial, including a lack of training in contouring and evaluation of imaging modalities, no experience or a long break from practice, and lack of ability to interpret individual cases [33-37]. In addition, the patient volume of a center can also affect the level of IOV [38]. Another significant reason for the IOV is the unclear margins of the cervix and parametria on CT. The adequate usage of contouring guidelines and other imaging procedures in addition to planning CT, standardized and continuous training, postgraduate education with contouring workshops, and evaluating the contours of all treated patients weekly during in-department meetings, are among the measures, which can reduce these variations [39].
The main limitation of our study is that determining the index contour based on experience alone may be misleading. In addition, we investigated the problem only with tandem-ovoid applicators, and the rate of agreement among observers may vary in cases where different applicators, such as ring-tandem or interstitial treatment are applied.
Conclusions
Our study is the first to investigate the IOV in cervical cancer CT-guided BT, and our findings demonstrate a favorable coherence in target volume delineation. The use of contouring guidelines appears to ensure consistent HR-CTV and IR-CTV contouring among the observers. However, it is important to note that even with a good concordance between the contours, there may be clinically significant dosimetric consequences. The interpretation of clinical and radiological findings can vary between the observers, and complete agreement is impossible. Given the potential for the IOV to negatively impact the oncologic outcomes and increase morbidity, efforts should be made to minimize such variations. To reduce variability, it may be advised to ensure that experienced clinicians are involved in target volume delineation, who consider these issues when determining margins, and continuous education to fellow clinicians is provided.


