
INTRODUCTION
Bicycle mounted power meters have revolutionised cycling racing and training by allowing real-time measures of a rider’s power output. These bicycle power meters measure the direct force being applied to a component such as the pedal axle or crank arm using strain gauges. However, currently it is not possible to measure the power output of a runner using similar strain gauges. As an alternative, several manufacturers have developed devices to estimate running power using motion sensor units combined with complex power estimation algorithms [1]. One such running device is the Stryd power meter (Stryd Inc. Boulder CO, USA). The Stryd is a 9-gram foot pod that attaches to a running shoe and estimates power, pace, distance, vertical oscillation, cadence, leg spring stiffness and ground contact time (GCT). Stryd also estimates form power, and form power ratio which are estimates of running economy.
Stryd has been evaluated during treadmill running [2–5], track running [3] trail running [6] and walking [6, 7]. Stryd provides reliable measures for power [2–4, 7], though a minimum sampling time of 10 seconds is required at a constant speed [8]. Stryd also appears to offer reliable measurements of GCT [5, 9, 10]. Stryd compared with the OptoGait system exhibited greater precision for GCT at every speed examined [10]. Stryd was found to be valid for GCT during running when compared with RunScribe [5] though may underestimate GCT when compared with high-speed video analysis [5]. In contrast, when Stryd was compared at walking paces with the gold standard Optojump Next [7], Stryd overestimated GCT. While Stryd offers high reliability, bias between different sensor brands including Stryd are frequently noted.
Stryd offers its own website-based calculation of Critical power (CP). CP is a well-described endurance exercise concept: For any individual, time-to-exhaustion is highly predictable and directly related to the power output [11]. CP represents a boundary between steady-state and non-steady state exercise intensity [12] and may be related to skeletal muscle capillarity and proportions of slow twitch muscle fibre type in endurance-trained individuals [13, 14]. Essentially, CP is the highest intensity that can be sustained without accumulating significant fatigue from anaerobic metabolism. However, there is much controversy concerning CP as a threshold measure. CP values depend upon the trial protocols used and the mathematical models employed [15]. There is no accepted reference method for CP determination, however linear CP models that include trials of longer duration (> 10 minutes) are recommended [15]. A large range of exercise laboratory derived thresholds have been suggested to be comparable to CP intensity. These include ventilatory thresholds (VT1 and VT2), the lactate threshold (LT), the maximal metabolic steady-state (MLSS), the onset of blood lactate accumulation (OBLA) and even much higher intensities above VO2peak (see [11, 16, 17] for reviews). Recent evidence suggest differences between CP and such thresholds may be due to discordance between the methods of determination [18]. Other authors have claimed that CP may differ significantly from other thresholds [16] and may be viewed controversially [19] as an independent physiological threshold itself. It has also been suggested that CP is simply a mathematical artefact [17].
To our knowledge, no study has examined the efficacy of the website generated CPSTRYD as a meaningful parameter for runners. It is currently unknown what relationship CPSTRYD has with other validated physiological thresholds including CP nor its ability to predict running performance. We sought to provide evidence to accept or reject CPSTRYD as a method to estimate CP or other thresholds in running. Our primary aim was to compare CPSTRYD with a CP calculated using an established linear power-time−1 model. Specifically, we sought to establish if the two CP models were equivalent. Secondary aims were to establish which lactate or gas exchange threshold is most equivalent to CPSTRYD and to compare CPSTRYD with standard laboratory performance tests as predictors of running performance. If CPSTRYD is equivalent to an established CP linear power-time−1 model and allows training at individual physiological thresholds and / or prediction of running performance, it will provide evidence to accept CPSTRYD as a meaningful parameter for runners.
MATERIALS AND METHODS
Participants
Twenty participants provided written informed consent prior to participation in this study that was approved by the Institutional Ethics Committee. The cohort consisted of males (n = 16), and females (n = 4) and included internationally competitive runners (n = 2), national class runers (n = 3) and competive recreational runners (n = 15). Inclusion criteria of participants were regular running training for the previous 3 months at a minimum frequency of 3 days per week, and currently participating in competitive running events and free from injury and illness.
Laboratory testing with Stryd
All participants were familiar with treadmill running. Participants completed laboratory running tests in an environmentally controlled laboratory to minimise thermal strain [20] (temperature 15 ± 1°C: relative humidity 36 ± 4%) while wearing Stryd. Participants’ heart rate was recorded during all testing with Polar OH1 (Polar Electro Oly, Kempele, Finland). Participants completed all testing using a motorised treadmill (Cosmos pulsar 3p, HP Cosmos Sports and Medical GMBH, Nussdorf Traunstein, Germany). Prior to laboratory testing, participants were instructed to prepare as if it was a competition, to avoid strenuous physical activity and performance altering supplements (e.g. caffeine).
Participants first completed a graded exercise test (GET) to volitional exhaustion. Participants supplied their recent (within 4 months) race times from flat course races. Starting pace was 70% of actual or predicted 10000 m pace as recommended [21]. Mean starting speed was 9.8 ± 1.8 km · h−1. Stage increments were individualized to allow each participant to complete a minimum of five stages. 12.0 km · h−1 was one velocity that all runners maintained for one stage during testing. For this reason, the oxygen cost of running (VO2 L min−1) and Stryd economy estimates (form power and form power ratio) were examined for relationships at 12.0 km · h−1.
The gradient was fixed at 1% in order to simulate on-road conditions [22]. Prior to the first stage all participants completed a 10-min warm-up at a self-selected submaximal intensity. Each stage lasted four minutes with one-minute passive rest between stages to allow for the collection of capillary blood samples. A 5 ul blood sample was collected via finger prick and was measured for lactate using a portable analyser (Lactate Pro 2, Arkray, Japan). LT was defined as the exercise intensity not associated with an elevation in blood lactate concentration above baseline [23]. OBLA was defined as the exercise intensity identified by interpolation across the 4.0 mmol · L−1 lactate point [24].
During testing, respiratory gases were continuously measured with a metabolic cart (Metalyser 3B, Cortex, Leipzig, Germany) calibrated in accordance with the manufacturer’s instruction using Alpha gas standards. All participants maintained a respiratory exchange ratio (RER) < 0.85 at the first stage. All participants reached a stage where they achieved a failure to increase VO2 by 150 mL/min with increased workload and a RER ≥ 1.10.
VT2 was determined using the criteria of an increase in both the VE/VO2 and VE/VCO2 and a decrease in PETCO2 as previously described [25]. VO2peak was determined as the highest 30 s oxygen uptake value recorded. The average treadmill speed over the final 60 s was recorded as peak 1 minute GET.
After a passive recovery of 15 minutes each runner performed a Maximal Anaerobic Running Test (MART) [26]. The MART consists of repeated 20-second sprints on a treadmill with 100 second passive rest periods. The speed of the first run was 14.5 km · h−1 and the inclination 5 degrees. The speed was increased by 1.5 km · h−1 every run until volitional exhaustion. vMART was calculated as the speed of the last completed 20-second run, plus 0.216 km · h−1 for each 2 seconds over 8 seconds of the subsequent uncompleted sprint. An uncompleted sprint of 8 seconds receives no adjustment, an uncompleted sprint of 10 seconds receives a 0.216 km · h−1 adjustment and 12 seconds receives a 0.432 km · h−1 adjustment.
Outdoor running with Stryd
Each participant had a Stryd account set up for them by the researchers and access was shared between the researchers and participant. Participants were required wear Stryd for a minimum of 6 weeks for all their runs. This time frame was chosen from pilot testing on 5 individuals. While CPSTRYD is generated after only a few runs, it continues to update CP which becomes more stable with time. 6 weeks allowed for multiple estimates of CP for each participant. Laboratory testing procedures for each participant was also carried out within this same study period.
In addition to their usual running training, we referred participants to follow the advice given by Stryd for an accurate CP:
Long duration runs of 40–60 minutes at max effort or near max effort (time trial or 10k race) for those that are training for a half or full marathon distance.
Medium duration runs of 10–20 minutes at max effort or near max effort (time trial or 5k race)
A short max effort run that is 3–5 minutes in duration.
Short distance sprints or strides at max effort (10–30 seconds in duration).
To provide measures of running performance all participants were asked to compete at an outdoor 1500 m track race and / or a 5000 m track or flat road race. Participants were asked to race at their maximal effort and to race as close as possible to the period as they were running with Stryd. All events were official athletic track meets or on a measured and verified race courses. Race times were obtained from the individual event websites.
Data analysis and statistics
For each subject, the final 10 s of power at every stage of GET and vMART was analysed for linearity using linear regression.
Following the outdoor running period with Stryd, all power data from each participants Stryd account was downloaded to Golden Cheetah (GC, version 3.5, open source, https://www.goldencheetah.org/). Golden Cheetah was used to obtain details of the number of runs, distance, training speed, duration, and elevation for each subject over this period of training. Golden Cheetah was also used to collate maximum mean power (MMP) for 3, 5, 10 and 20 minutes for each runner.
CPSTRYD from each participants Stryd account was collated. CPSTRYD is an auto-calculated CP from the Stryd app/website and uses an undisclosed power estimation algorithm. CPSTRYD was compared with MMP durations and with for Stryd power at ventilatory threshold 1 (VT1), LT, OBLA, VT2, VO2peak and vMART. CPSTRYD was also examined as a predictor of VT1, LT, OBLA, VT2, VO2peak and vMART using linear regression.
The four MMP durations (3, 5, 10 and 20 minutes) were used to calculate a CP for each subject (CPCALC). CPCALC was calculated using the following linear power-time−1 model.
CPCALC was then compared with CPSTRYD using Deming regression and a Bland-Altman plot to test for systematic bias. A two-one-sided t-tests (TOST) procedure was used to examine equivalence between CPSTRYD and CPCALC. As day to day variation of individual CP measures of ~5% have been previously reported [27], 5% was chosen as a priori acceptable limit to determine equivalence.
Stryd power at VT2 from laboratory testing was examined as predictor of CPSTRYD using both linear and non-linear regression regression and a Bland-Altman plot was used to test for systematic bias.
The two outdoor runs, 1-minute peak speed from the GET and vMART were used as performance measures. Linear regression was used to examine if CPSTRYD or Stryd data at 12.0 km · h−1 could predict these four measures of performance. This was also compared with laboratory results to predict performance.
Distributions were tested for normality with descriptive statistics and the D’Agostino and Pearson omnibus normality test to examine suitability for parametric testing. Comparisons were made with the paired t test.
All regressions were examined with the runs test and graphs of the residuals.
All data were analysed using Prism version 4.0 (GraphPad Version 4.01, San Diego, CA, USA, www.graphpad.com).
RESULTS
20 participants completed laboratory testing procedures (Table 1). For all runners, linearity of Stryd power was excellent (R2 > 0.99) at 1% for GET stage and 5% incline for MART stage (R2 > 0.99).
TABLE 1
Participants and laboratory testing results.
[i] Note: Participant characteristics and laboratory graded exercise testing results are presented. VT1 = first ventilatory threshold, LT = lactate threshold, OBLA = onset of blood lactate accumulation, VT2 = second ventilatory threshold, Peak GET = peak 1 minute from graded exercise test, VO2 = maximum oxygen consumption, vMART = velocity maximal anaerobic running test, SD = standard deviation
The oxygen cost of running (2.92 ± 0.35 VO2 L min−1) at 12.0 km · h−1 had no relationship with Stryd economy measures form power (76 ± 11 W) nor form power ratio (0.30 ± 0.03). Also, there was no relationship between oxygen cost and vertical oscillation (8.7 ± 1.5 cm), cadence (84 ± 5 steps min−1), leg spring stiffness (11.5 ± 2.3 kN m-1) or GCT (235 ± 22 ms) at this same velocity.
Within 6 weeks of laboratory testing runners completed 54 ± 46 outdoor runs with Stryd, covering a distance of 464 ± 423 km in 39 ± 28 hours with an elevation gain of 4862 ± 3376 m. Training speed with Stryd was 11.9 ± 1.9 km · h−1. Stryd data from regular training was compared with Stryd data from laboratory testing which revealed OBLA and VT2 were the closest physiological thresholds to CPSTRYD (Table 2). CPSTRYD was not different (p > 0.05) from peak 20-minute power, power at OBLA or power at VT2. While speed at OBLA was slower (p < 0.01) compared with VT2 (Table 1), power at OBLA was not different (p = 0.07) compared with power at VT2 (Table 2).
TABLE 2
Stryd power from outdoor running compared with laboratory testing.
[i] Stryd power data for 20 runners completing 54 ± 46 runs, covering a distance of 464 ± 423 km with Stryd are compared with Stryd power from laboratory testing. CP = critical power, MMP = maximum mean power, SD = standard deviation, VT1 = first ventilatory threshold, LT = lactate threshold, OBLA = onset of blood lactate accumulation, VT2 = second ventilatory threshold, Peak GET = peak 1 minute from graded exercise test., MART = maximal anaerobic running test,
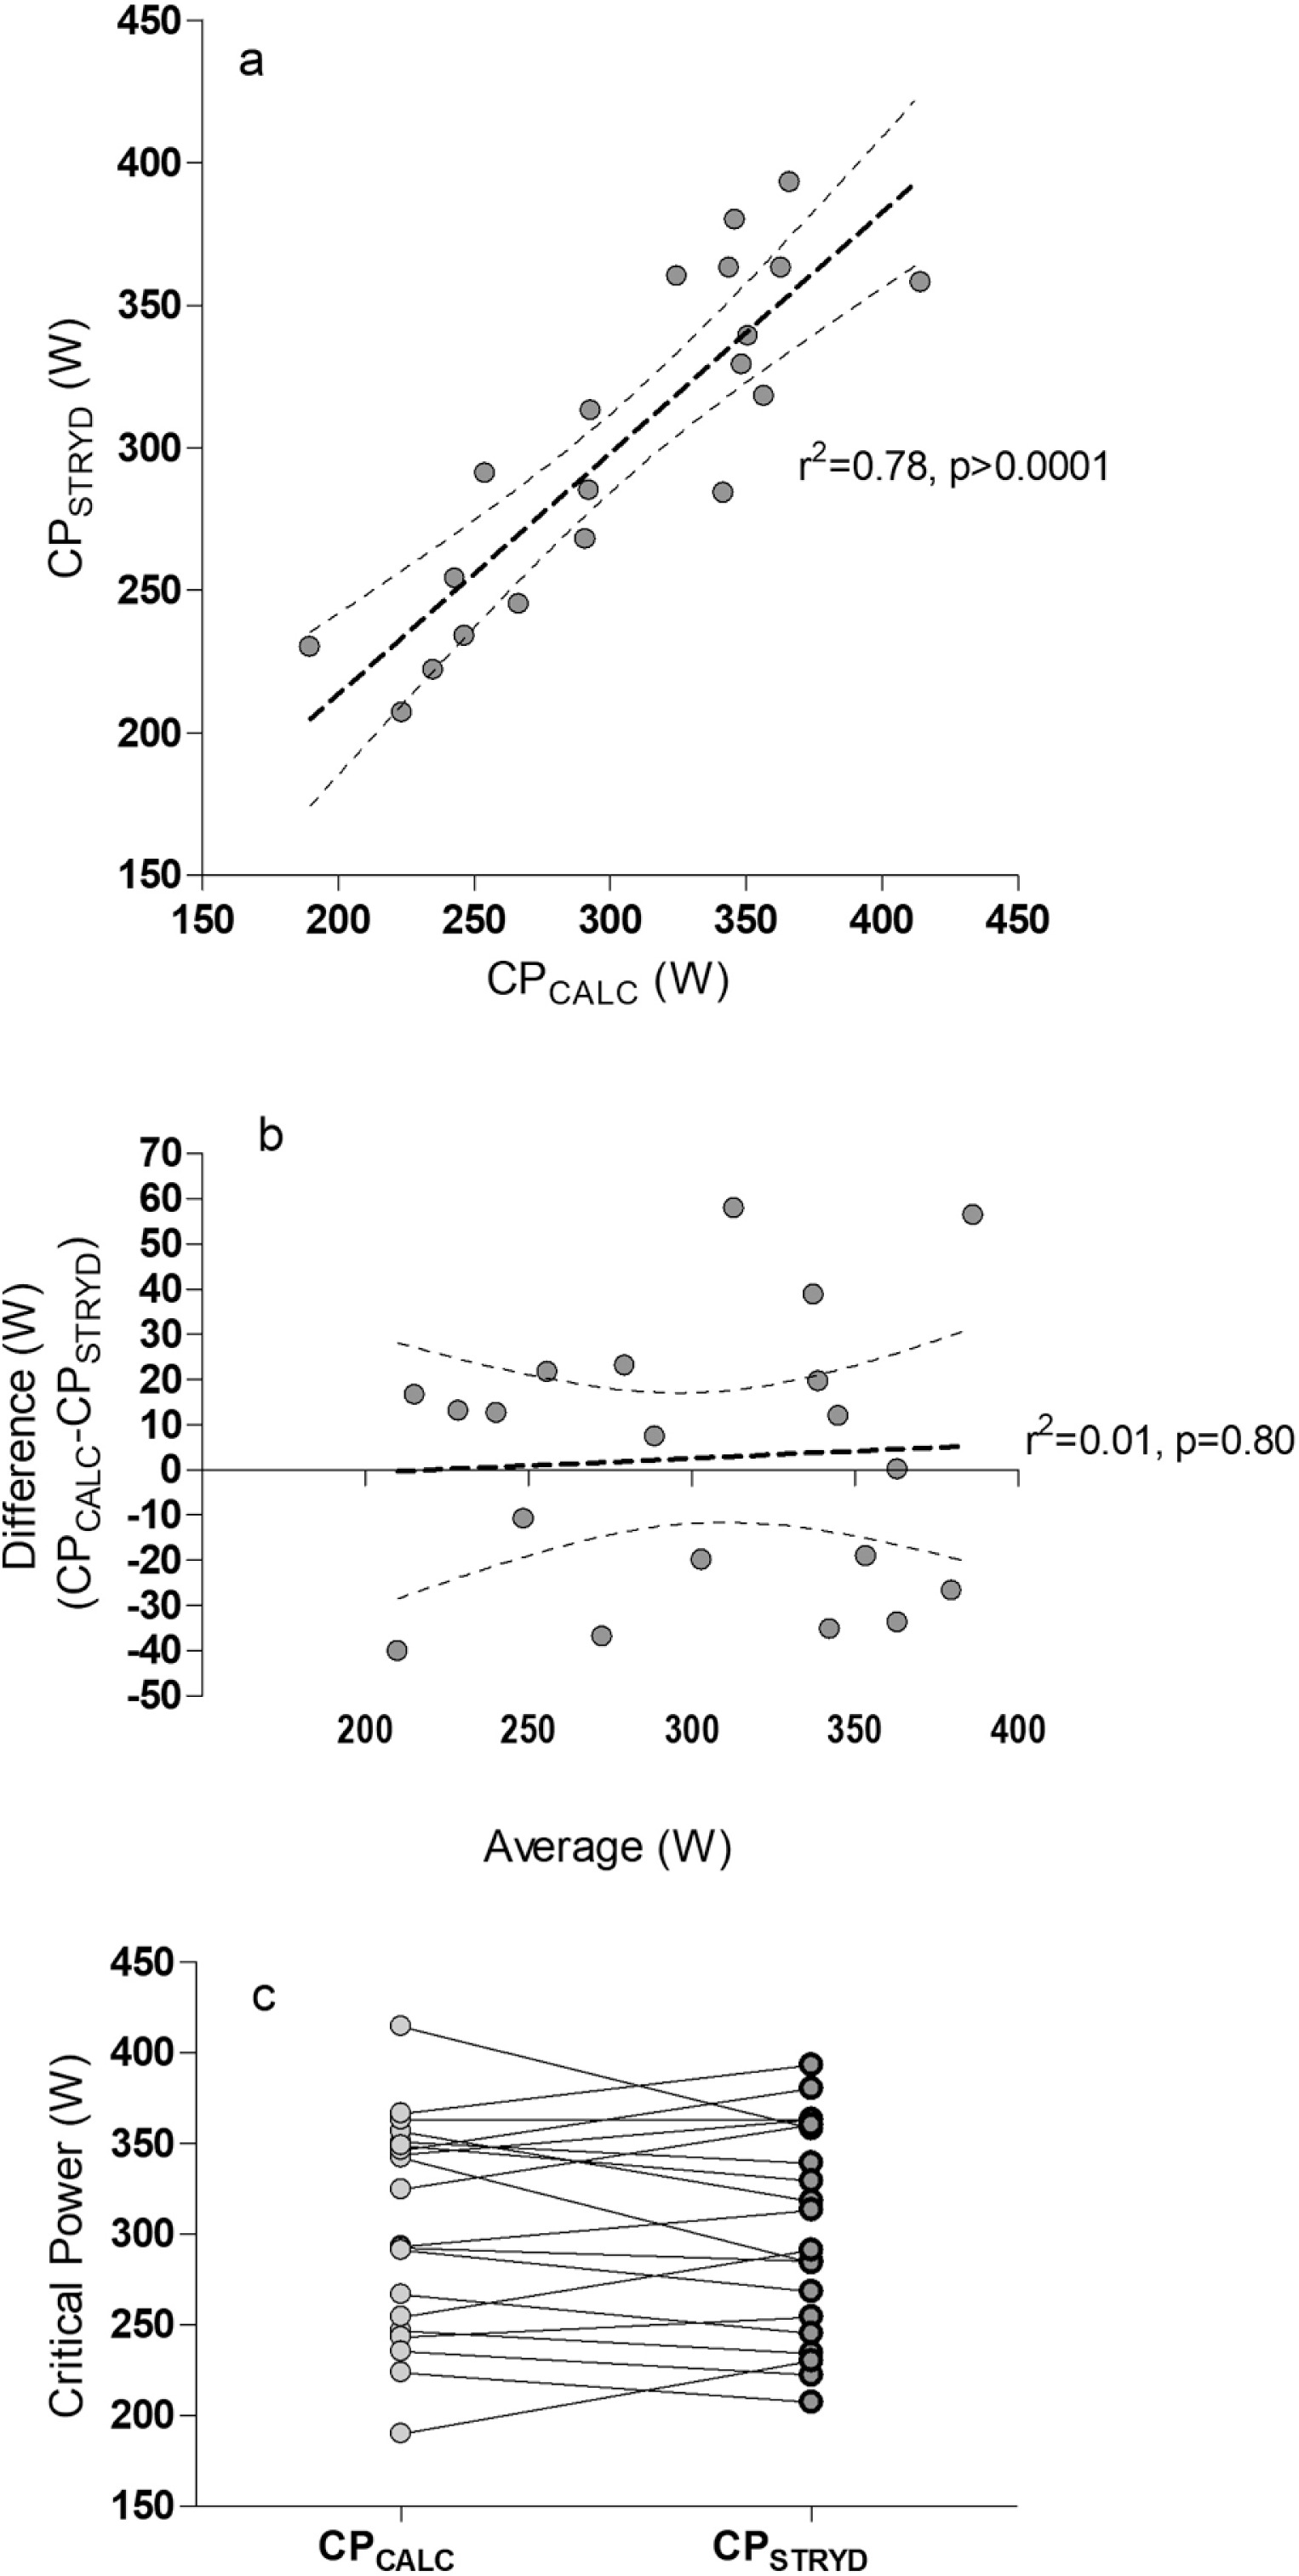
CPSTRYD 302 ± 58 W was not different (p = 0.34) compared with CPCALC 305 ± 60 W (Figure 1a). No bias was evident (Figure 1b). The TOST procedure (CPCALC – CPSTRYD, p = 0.34, Cohen’s d = 0.09 and CPSTRYD – CPCALC, p = 0.66, Cohen’s d = 0.09) confirmed that the two critical power estimates can be considered statistically equivalent (Figure 1c). The % differences between the two measures followed a normal distribution (0.8 ± 9.9%), ranged between -19.1 to 18.5%, 25th and 75th percentiles were -6.8 and 7.9%.
FIG. 1
1a CPSTRYD is compared with vs CPCALC, Deming’s Regression Results: Slope = 0.97 ± 0.13, Y-intercept = 7.48 ± 39.98, SD of the residuals = 30.18, p<0.01. 1b There was no bias evident on the Bland Altman plot. 1c The two measures of CP appeared equivalent. Runs test p value = 0.77.
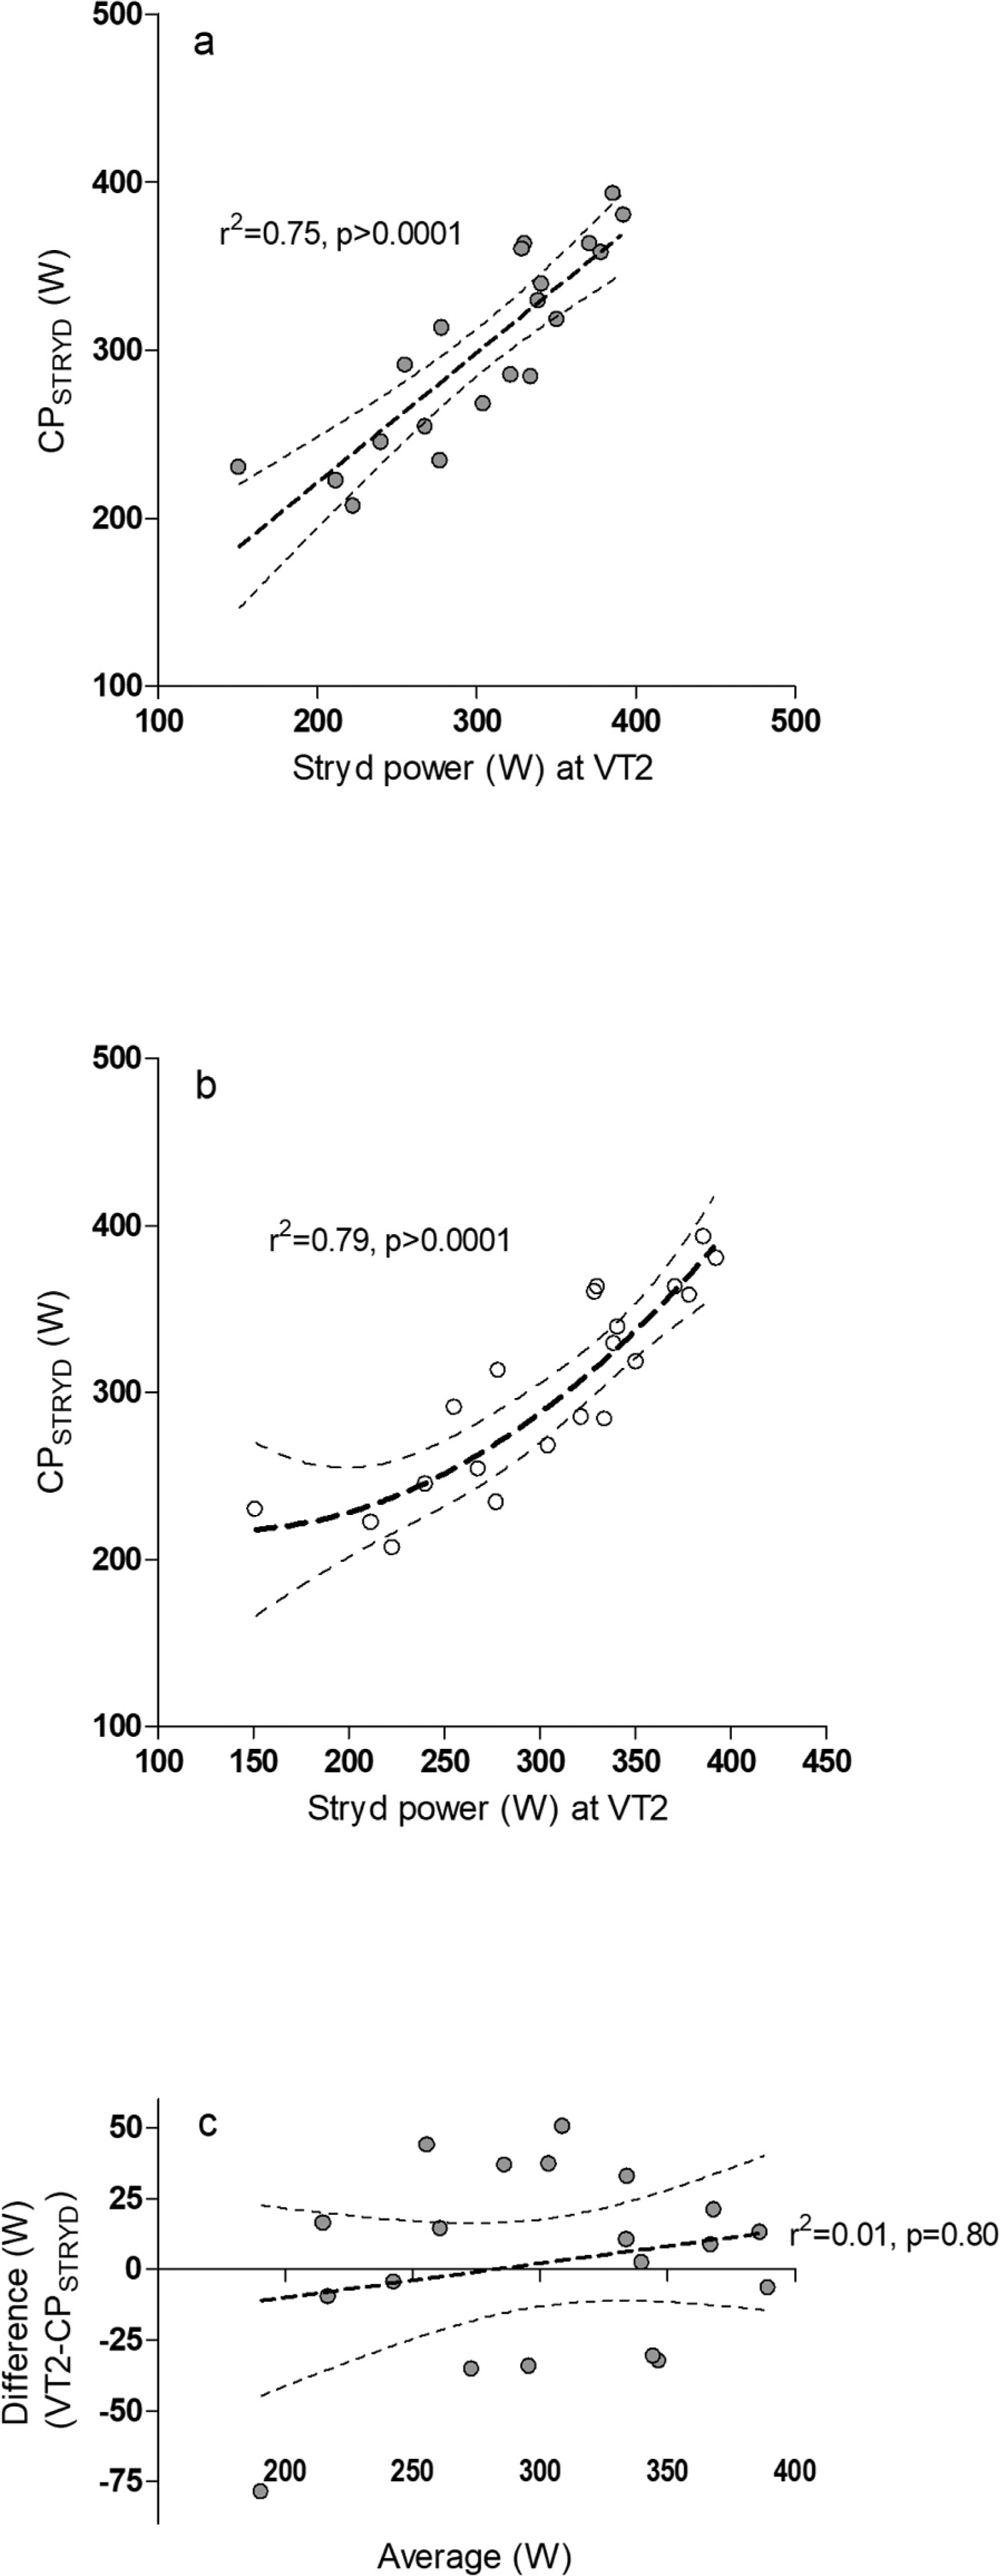
As VT2 had a stronger relationship with CPSTRYD (R2 = 0.75) compared with OBLA (R2 = 0.72), VT2 was chosen as the threshold to directly compare with CPSTRYD. While there was little difference between CPSTRYD and Stryd power at VT2 (figure 2a), the relationship may be best described as non-linear (2b) and individual differences of 20–40 W between CPSTRYD and power at VT2 were observed (Figure 2c).
FIG. 2
Stryd CP is compared with power at VT2 with (2a) Linear regression (Best-fit values: Slope 0.77 ± 0.11, Y-intercept when X=0.0 66.70 ± 32.89, X-intercept when Y=0.-86.35) and (2b) non-linear regression (Polynomial: Second Order (Y=A + B*X + C*X^2), Best-fit values A = 265.2, B = -0.70, C = 0.00) are compared. 2c A Bland Altman plot was used to examine bias and individual athlete differences. Runs test p value = 0.87.
13 participants ran a maximal 1500 m effort (320 ± 62 s) on a track or flat sealed surface within 33 ± 44 days of laboratory testing. 13 participants ran a maximal 5000 m effort (1174 ± 223 s) on a track or flat sealed surface within 34 ± 39 days of laboratory testing. 11 participants performed both distances. 7 participants could not compete at events because of COVID related event cancellations. These two outdoor runs and 1-minute peak speed from the GET and vMART were used as performance measures to compare Stryd data with laboratory tests (table 3).
TABLE 3
Comparing laboratory, Stryd and outdoor running as predictors of running performance.
[i] The best laboratory-based data predictor of running performance is compared with the best Stryd data predictor for four performance measures. Stryd GCT is compared with running economy as a predictor. Each regression was examined with graphs of the residuals and the runs test. Runs test p values are included. PP = Peak Power. OBLA = onset of blood lactate accumulation, CP = critical power, VT2 = second ventilatory threshold,
While the two international class runners in our cohort had the lowest submaximal VO2 at 12.0 km · h−1, the oxygen cost of running was not predictive of performance. In contrast, Stryd GCT at 12.0 km · h−1 had an inverse relationship with performance and was predictive of 1-minute peak speed during GET, 1500 m time and was close to predicting (p = 0.07) 5000 m time. Further analysis revealed Stryd GCT at 12.0 km · h−1 also had inverse relationships with OBLA (r = -0.60. p = 0.04) and was close to significance with VO2peak (r = -0.51. p = 0.05).
DISCUSSION
We found that CPSTRYD generated from regular training over a six week period was equivalent to that calculated using an established CP model. However, individual runner variance between CPSTRYD and other CP models must be a consideration for runners and coaches. CPSTRYD was most similar in intensity to VT2 and OBLA and was predictive of outdoor and laboratory running performance. However, laboratory-based data were superior predictors of running performance when compared with CPSTRYD. In addition, we found that Stryd running economy measures, form power and form power ratio, had little relationship with the oxygen cost of running. In contrast, GCT was inversely associated with performance when comparing runners at the same submaximal speed.
We found CPSTRYD (302 ± 58 W) was not different from CPCALC (305 ± 60 W) estimated from a linear model using four MMP durations. In addition, we detected little bias between the two CP estimates. Day to day CP variation of ~5% has been previously reported for individual athletes [27]. As the differences between CPSTRYD and CPCALC from our TOST procedure was not significant and is less (Cohen’s d = 0.09) than 5% we suggest that the two CP estimates can be considered equivalent. It must be noted that some participants did record differences between the two CP estimates. While physiologically, CP supposedly represents a single boundary for an individual athlete between steady-state and non-steady state exercise intensity [12], different protocols and models are known to affect its determination [15]. CPSTRYD is an unknown unknown proprietary algorithm and the power time durations used in its estimation are not published for commercial reasons. Individual runner variance between the two CP estimates is somewhat an expected finding. Coaches and runners should be aware that any method of determining CP may not be interchangeable with other methods. However, CPSTRYD appears to be an acceptable method of determining CP in running when compared with previously published linear models.
CPSTRYD intensity closely resembles VT2 and OBLA which are thresholds frequently used as guides for training intensity distribution or “polarised training” in endurance athletes [28, 29]. CPSTRYD would thus appear to facilitate polarised training at recommend intensity distributions, without the need for laboratory testing. There may be limitations for using CPSTRYD as a threshold. Our results suggest for participants with lower CPSTRYD values (~220 W), VT2 may occur at a lower intensity compared with CPSTRYD. Also, individual subject differences of 20–40 W (7–13%) between CPSTRYD and power at VT2 were observed. Although CPSTRYD intensity may be similar to VT2, we cannot discount that it may be an independent physiological threshold. Also, it should be noted that we did not determine MLSS which has been suggested as a true representation of the boundary between steady-state and non-steady state exercise intensity [17, 18, 30]. In spite of these limitations, we speculate that individuals who experience an increase in CPSTRYD (W/kg) would also likely improve endurance performance. Although we did not specifically compare changes in CPSTRYD with changes in performance, some runners in our cohort did experience an increase in CPSTRYD over the training period that appeared to coincide with an increase in performance. Further research is required to confirm if changes in CPSTRYD with correlate with changes in performance.
We found no difference (p = 0.07) in Stryd power between OBLA and VT2 (296 vs 304 W), yet running speed at OBLA was slower (p < 0.01) than VT2 (14.2 vs 14.7 km h−1). Similar OBLA and VT2 velocity differences have been reported previously in runners [25]. The fact that velocity and not power was different, might suggest that velocity is a more precise measure of intensity compared with Stryd power. However, even a 1% change in grade substantially changes the energetic cost of running [22], while Stryd power, unlike velocity, accounts for both elevation and wind. We found Stryd power linearity for flat and incline treadmill running was excellent (R2 > 0.99). Thus, we speculate that Stryd power is likely to be superior compared with velocity for any individual runner seeking to measure running intensity where a change in grade result in changes in velocity.
CPSTRYD (W/Kg) was able to explain 73–89% of the variance in running performance for 1500 m, 5000 m and GET peak speed. However, for all three of these measures of running performance, laboratory testing was superior to Stryd CP and explained 91–95% of the variance. Treadmill velocities during GET were the most predictive of performance which is similar to previous research [31]. While the two international class runners in our cohort had lowest oxygen cost at submaximal speed, this was not predictive of any performance in this study. In contrast, Stryd GCT had significant inverse relationships with peak GET speed, VO2peak, OBLA, and outdoor running performance. Lower GCT has been associated with greater economical running in elite runners [32]. While laboratory exercise testing remains the gold standard to predict endurance performance, CPSTRYD is highly predictive of performance and Stryd GCT may also be a useful field-based parameter.
A major limitation from our study was that COVID restrictions prevented a single time trial. Thus, for our outdoor trials, participants encountered varying running conditions that we are unable to control for such as different weather, temperature and courses. Nevertheless, even with this limitation, CPSTRYD was highly predictive of outdoor performance. It must also be noted that our runners could not have feasibility raced one another in any meaningful way. Even a 1500 m track based time trail would result in some participants being lapped more than once. We believe this heterogeneity of our population can also be considered a strength as runners are not a homogenous group and running power will appeal to many runners of different abilities. Predictive measures such as VO2peak are more predictive of performance in heterogenous populations [33]. A homogenous group such as elite runners would be likely to generate weaker relationships with Stryd than we have found. This also warrants further research. One possible limitation is that we did not determine MLSS and this also would be one area for further research. Also, a possible limitation is that while CPSTRYD was statistically equivalent to CPCALC, some participants recorded differences between the two estimates. Coaches and runners need to remain aware that CP estimates are highly influenced by both trial protocols and the mathematical models employed [15]. Even when using the same protocol and model a ~5% day to day variance should be expected [27].
CONCLUSIONS
In conclusion, CPSTRYD generated from outdoor running is equivalent to that calculated using an established CP model. CPSTRYD appears to most similar in intensity to VT2 or OBLA and may offer a useful guide for training intensity distribution or polarised training. CPSTRYD is highly predictive of running performance although laboratory-based data are superior predictors. While Stryd was not predictive of the oxygen cost of running when comparing runners at the same submaximal speed, Stryd GCT is inversely associated with performance and may be a useful field-based parameter. Stryd offers meaningful data for runners including a realistic estimate of CP.


