
Purpose
In brachytherapy, dosimetric challenges are difficult to overcome due to very steep dose gradients, small treatment distances, and the magnitude of variation of the dose deposited across the treatment volumes of interest. As per the joint recommendations of the American Association of Physicists in Medicine (AAPM) and the European Society for Therapeutic Radiology and Oncology (ESTRO) [1], all radiation sources used in high-dose-rate (HDR) brachytherapy practice must have a dosimetry dataset with all relevant parameters available, based on the Task Group No. 43 update (TG43U1) formalism [2], and also provide the consensus data for photon-emitting brachytherapy sources with an average energy higher than 50 keV [3]. Since these data vary with the type of the source, as they are highly dependent on the size of the active core of the source, the isotope distribution, and the encapsulation material and its geometry, it is recommended that specific dosimetric data should be obtained by appropriate methods, either by experimental or Monte Carlo (MC) calculations, which may be used as inputs in the treatment planning system [4,5,6,7,8,9].
However, to the best of our knowledge, there are no data available in the literature that compare the measured radial dose function, g(r), and the anisotropy function, F(r,θ), with the MC calculation of the BEBIG 60Co (Co0.A86) source based on the TG43U1 formalism in a single study. Hence, the present study aimed to compare the measured g(r) and F(r,θ) of the BEBIG 60Co HDR source, using thermoluminescent dosimetry (LiF-TLD100) and Gafchromic EBT2 Film dosimetry in an in-house designed water phantom, with the egs_brachy MC calculated values in a similar geometry. As a prerequisite for this study, we validated the egs_brachy MC code for the BEBIG 60Co source by calculating the dosimetric data set in accordance with the TG43U1 recommendations for an unbounded phantom and compared it with published literature data.
Material and methods
Monte Carlo calculation methods
egs_brachy MC Code
The egs_brachy application was used for Monte Carlo calculations. It is an EGSnrc application which uses the egs++ class library [10,11,12]. The publication by Chamberland et al. [13] provides a general overview of the egs_brachy application, a complete discussion of all features, details on benchmarking and characterization of simulation efficiency, and some sample calculation times for clinical scenarios.
Modelling of the BEBIG 60Co HDR source
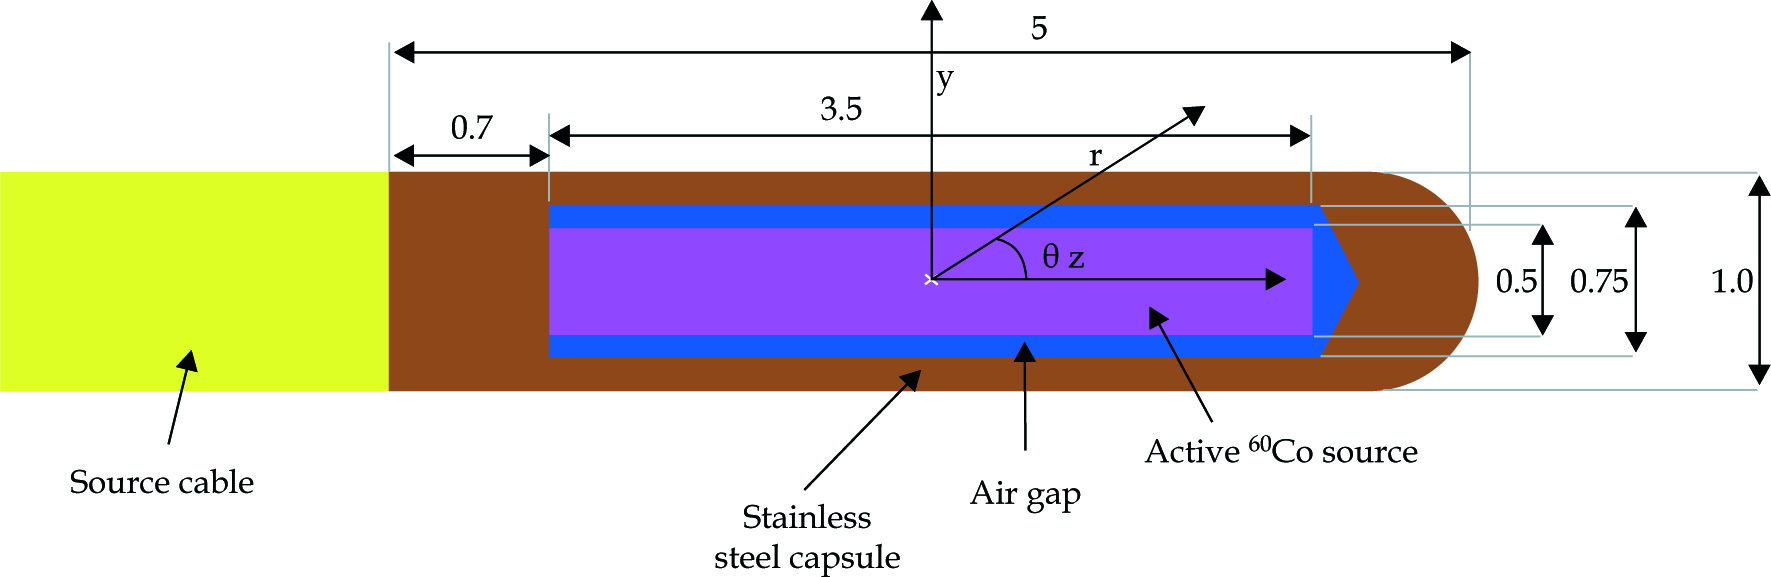
The BEBIG 60Co HDR source (Co0.A86) consists of a pure cobalt (ρ = 8.9 gm/cm3) cylindrical core (diameter 0.05 cm, length 0.35 cm). Radioactive 60Co is uniformly distributed inside this active core. The source core is encapsulated by steel (outer diameter 0.1 cm, inner diameter 0.07 cm). The capsule is 0.5 cm long and has a thickness of 0.075 cm along the long axis on the proximal end to the cable. There is an air gap of 0.01 cm around the axial side of the active core. A stainless steel cable with a length of 5 mm and a diameter of 0.9 mm is attached to the source. The geometric design and material details of the BEBIG 60Co source (Co0.A86) are taken from a published study [9]. The schematic egs_brachy modelled source is shown in Figure 1.
egs_brachy MC calculation for unbounded phantom
To validate the egs_brachy MC calculation for the BEBIG 60Co source, as mentioned above, we calculated the TG43U1 parameters, such as dose rate constant (Λ), g(r), and F(r,θ) for an unbounded phantom and compared the results with the consensus data [3]. For these calculations, we considered a cylindrical phantom with a length and diameter of 80 cm and used liquid water with a density of 0.998 g cm-3 at 22°C, as recommended by TG43U1. The scoring region in the water phantom was divided into cylindrical shells for the varying voxel sizes to minimize its effect with dosimetric data. The sizes of the voxels were chosen as follows: 0.1 mm × 0.1 mm voxels were used for the distance of r ≤ 1 cm, 0.5 mm × 0.5 mm voxels for 1 < r ≤ 5 cm, 1 mm × 1 mm voxels for 5 < r ≤ 10 cm, and 2 mm × 2 mm voxels for 10 < r ≤ 20 cm to provide the adequate spatial resolution. The air kerma strength per history was obtained as 4.2350 ±0.0024 × 10⁻¹³ Gy cm2/history using the approach of Taylor and Rogers [14,15]. To calculate the dose rate constant (Λ), we used the dose to water per history on the reference position (1 cm, Π/2) in the unbounded water phantom, divided by the air kerma strength per history. The radial dose function, gL(r), calculated for an unbounded phantom, in this study, is denoted as g(r)unbou. It was calculated from 0.2 cm to 20 cm using line source geometry functions (L = 3.5 mm). We calculated the anisotropy functions, F(r,θ), for an unbounded phantom in this study, which is denoted as F(r,θ)unbou, using the line source approximation and tabulated at radii of 0.25, 0.5, 0.75, 1, 2, 3, 4, 5, 7.5, 10, 12.5, 15, and 20 cm for the polar angles from 0° to 180° with varying intervals. As per the recommendations of AAPM Task Group 268 on reporting Monte Carlo studies, Table 1 summarizes parameters of the Monte Carlo calculations [2,9,13,16,17,18,19].
Table 1
Summary of the parameters used in the Monte Carlo calculations based on AAPM TG 286 report
| Item name | Description | References |
|---|---|---|
| Code, version, release date | egs_brachy, pre-release version, Spring 2016; based on EGSnrc release 2016 | [13] |
| Validation | Validation of the egs_brachy MC code | [13] |
| Timing | 1,500-6,500 total CPU hours on Intel Xeon 5160 CPUs with clock speeds of 3.0 GHz | |
| Source description | Isotropic photon emission based on the photon part of the 60Co spectrum. Contributions to the dose from the electron part of the spectrum are negligible due to the steel encapsulation. The photons are uniformly distributed in the cobalt core of the source (ρ = 8.9 gm/cm3 cylindrical core, diameter 0.05 cm, length 0.35 cm) | [9] |
| Cross-sections | Photon cross-sections from XCOM database. Atomic transitions from the Livermore Evaluated Atomic Data Library (EADL). Mass-energy absorption coefficients calculated using the EGSnrc application ‘g’ | [16,17] |
| Transport parameters | Photon cutoff energy (PCUT) = 1 keV Electron cutoff energy (ECUT) = 10 keV Interactions modelled: Rayleigh scattering bound Compton scattering, photoelectric absorption, fluorescent emission of characteristic x-rays, electron impact ionization. All other transport parameters use the default values from EGSnrc | [18] |
| VRT and AIET | Dose scoring used the tracklength estimator for situations where electronic equilibrium exists (e.g., > 1 cm away from the source) | [13] |
| Scored quantities | Dose to medium using either the tracklength estimator or interaction (energy deposition) scoring | [13] |
| # histories and statistical uncertainties | 4e9 to 2e10 histories; sufficient to obtain 1σ statistical uncertainties (type A) of 2% or less at a distance of 10 cm from the source | |
| Statistical methods | Uncertainties are calculated with the default history-by-history method used in EGSnrc | [19] |
| Post-processing | The calculated dose distributions were not filtered in any way. TG-43 parameters were calculated using the TG43U1 formalism | [2] |
Experimental methods
Thermoluminescent dosimeters (LiF TLD-100)
The TLD experiment was performed using a fresh batch of lithium fluoride doped with magnesium and titanium (LiF: Mg, Ti) TLD-100 square rods with dimensions of 1 × 1 × 6 mm3. Before each experiment, the TLDs were annealed according to the technique proposed by Booth et al. [20], known as “prereadout” annealing. The response of the TLD rods was analyzed using an automated Harshaw Biocron TLD reader (model 3500) and the annealing was carried out using the Thermolyne Furnace (model 47900). The integrated area under the glow curve for a temperature of 270°C was evaluated to obtain the TL output in nC. The relative responses, termed elemental correction factors (ECF), were determined by irradiating the whole batch of TLD rods with a dose of 2 Gy in 60Co γ-rays from the Theratron-780C telecobalt unit. The ECF were determined five times and the TLD rods that showed a variation greater than 2% (type A) were discarded. The individual calibration factors established in this manner were used to correct the output of each TLD to achieve better precision, of the order of 1% (1σ, type A). The response of the TLD rods per unit dose to water was studied by exposing each group of 5 TLD rods to doses ranging from 10 cGy to 10 Gy in 60Co γ-rays from the Theratron-780C telecobalt unit. The TLDs response with increasing dose was linear up to 10 Gy (R2 = 0.999). The uncertainties in the TLD dose calibration (type B) are found to be 3.5%. The quadrature combined uncertainty for the TLD measurements is 4.2%. All statistical uncertainties on the calculations in the present study have an estimated coverage factor k = 1.
Gafchromic EBT2 film
The Gafchromic EBT2 dosimetry film (ISP Technologies) used in this work has a high spatial resolution and is a highly sensitive dosimetry film which can be used in the dose range of 0.01-40 Gy. In comparison to the earlier radiochromic film models, the EBT2 film shows less energy dependency [21]. The EPSON Dual Lens Perfection V700 desktop scanner was used for scanning the EBT2 films. We followed the film scanning protocol as mentioned by Huet et al. [22]. The TIFF images of films were analyzed with the PTW-VeriSoft (version 6.0.1) software. For calibration, the EBT2 film was cut into samples with sizes of 3 × 3 cm2 and the orientation of the film was marked at the right corner of each film sample. All the films were irradiated with 60Co γ-rays from the Theratron-780C telecobalt unit for the calibration dose range from 10 cGy to 40 Gy. One sample was left unexposed but kept with the other samples for background optical density. All irradiated films were scanned 24 h after exposure. The net optical density calculation was performed according to published literature [23]. The overall uncertainty calculated using a simple quadrature sum of individual components is found to be 3.8%, which includes type A uncertainty due to scanner consistency of 2% and type B uncertainties of dose conversion from optical density in the calibration procedure in terms of film uniformity and fitted dose value process of 2% and 2.5% respectively.
In-house water phantom and slab inserts
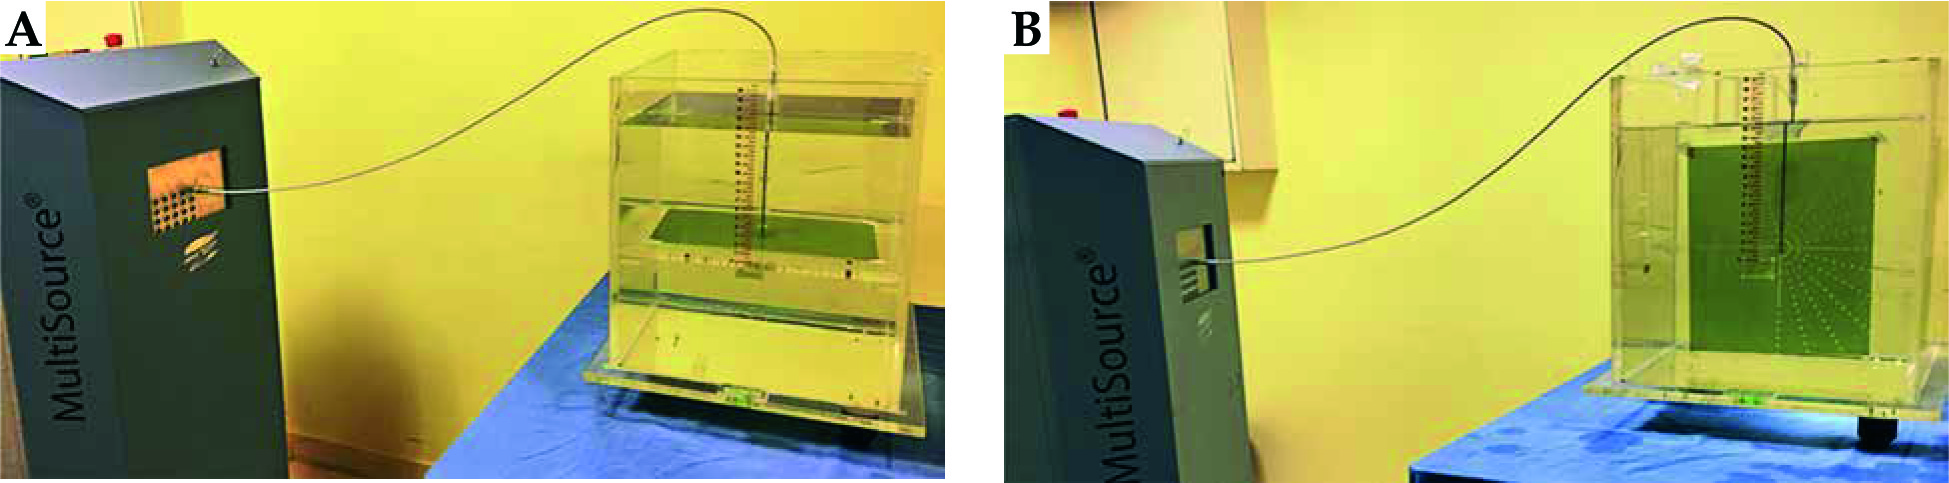
A precisely machined 30 × 30 × 30 cm3 water phantom was designed in-house specifically for the purpose of measuring the radial dose and anisotropy functions. The walls of the phantom were made up of PMMA with 1 cm thickness.
For the measurement of g(r), we fabricated a PMMA slab phantom insert with dimensions of 30 × 30 × 1 cm3, which was carefully machined with an accuracy of 0.1 mm to accommodate the TLD rods and a plastic catheter (2 mm in outer diameter) inside which the source was driven. The holes for the source and the TLD rods were drilled vertically through the plate such that the source centre and the TLD centre were in the same plane. The phantom was designed to have eight TLD rods at each point, from 1 cm to 10 cm, with a suitable design as shown in Figure 2A. The slab containing the TLDs was inserted horizontally in a water phantom and a provision was made to ensure that the PMMA slab containing the TLDs was located at the centre of the phantom, surrounded by the water medium to provide full scattering conditions.
Fig. 2
Design of the precisely machined: A) radial PMMA slab phantom and (B) anisotropy PMMA slab phantom
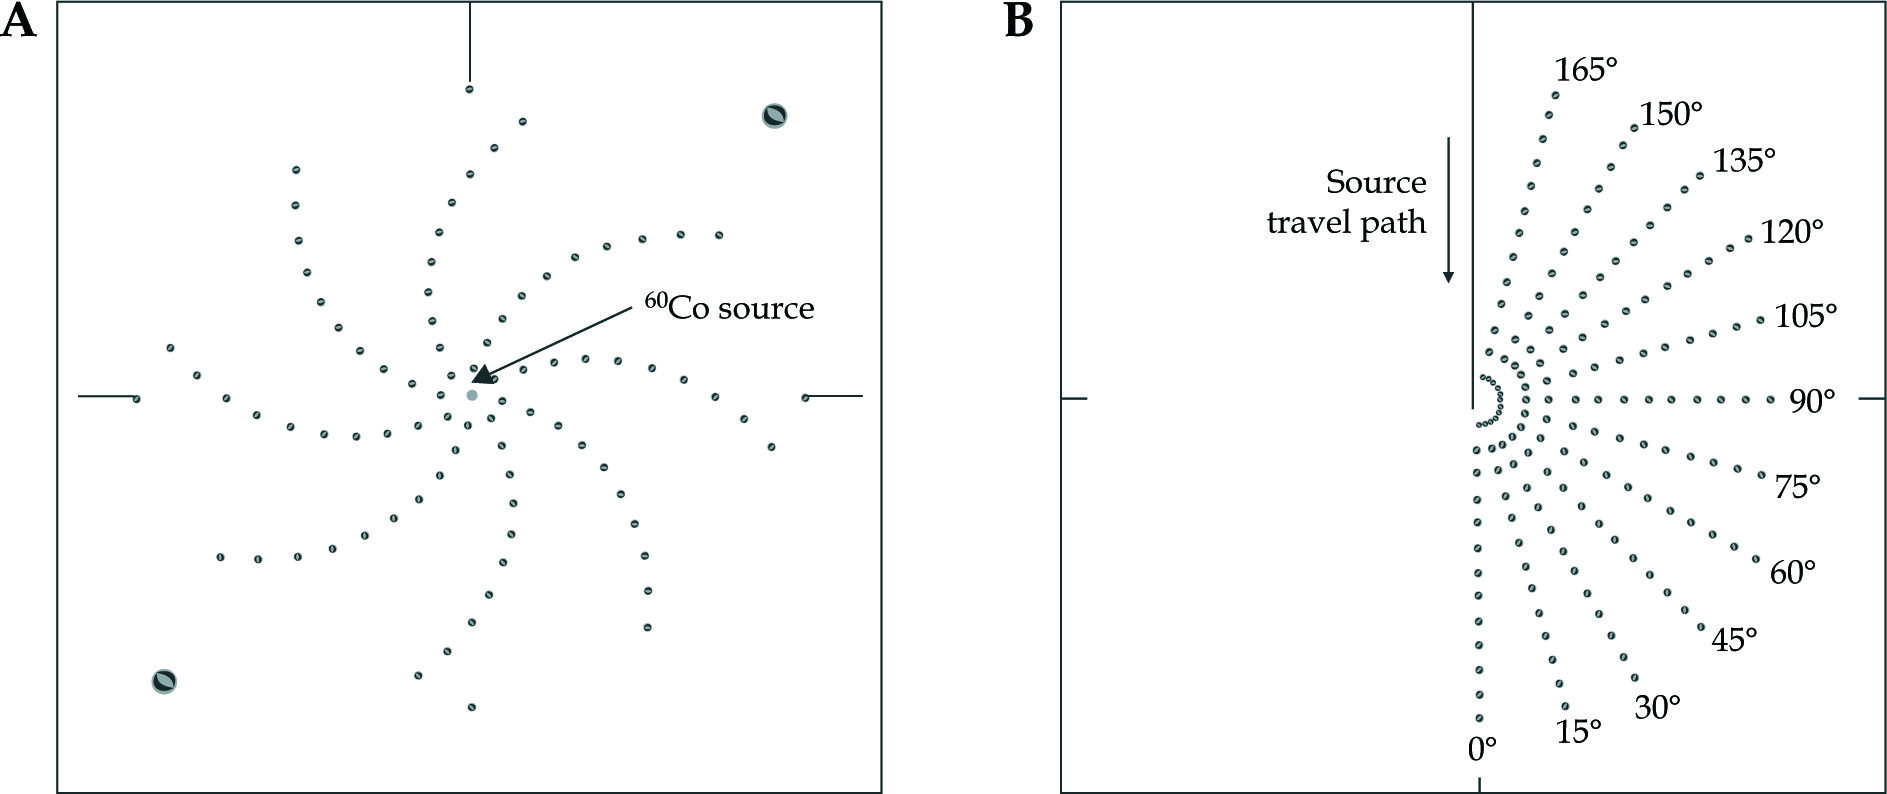
For the measurement of F(r,θ), another PMMA slab phantom insert of 30 × 30 × 1 cm3 dimensions was fabricated in which the holes were drilled vertically through the plate to position the TLD rods. The PMMA slab phantom design was as shown in Figure 2B. The design of the PMMA slab was taken from Meigooni et al. [24]. The slab containing the TLDs was inserted vertically in a water phantom. The centre of the source was at a depth of 15 cm below water level and at a height of 15 cm from the bottom of the phantom. The EBT2 film measurements were done in the same way as above. The accuracy of the source position in the phantom with respect to the arrangement of detectors was verified with a square sample of the EBT2 films.
Measurement techniques
TLD-100 method
The TLD measurements of g(r), denoted as g(r)TLD, were performed at distances ranging from 1 cm to 10 cm with 1 cm increments and at angles of 0°, 45°, 90°, 135°, 180°, 225°, 270°, and 315°. The TLD measurements of F(r,θ), denoted as F(r,θ)TLD, were performed at radial distances ranging from 1.0 cm to 10 cm in increments of 1.0 cm and at angles of 0°, 15°, 30°, 45°, 60°, 75°, 90°, 105°, 120°, 135°, 150°, and 165°. The TLD data at each point in the phantom were taken from the average of three measurements with a reproducibility of better than 1%. Volume correction factors for the finite size of the TLD rods were calculated by Thomason and Higgins [25]. In this study, we used the published values of this correction factor as 1.028 and 1.0 for distances of 1 cm and beyond 1 cm, respectively. In this work, because the TLDs were calibrated in the 60Co beam and exposed to the 60Co HDR source, no energy response correction factor was applied.
Gafchromic EBT2 film method
The scanning procedure of irradiated Gafchromic films was kept the same as mentioned above in the film calibration methodology. To obtain g(r)film, the pixel values were noted at radial distances ranging from 1 cm to 10 cm along the perpendicular bisector of the source at angles of 0°, 45°, 90°, 135°, 180°, 225°, 270°, and 315°, for both unirradiated and irradiated films. To calculate the F(r,θ)film, the pixel values were noted for radial distances ranging from 1.0 cm to 10 cm in increments of 1.0 cm and at angles 0°, 15°, 30°, 45°, 60°, 75°, 90°, 105°, 120°, 135°, 150°, and 165°, for both unirradiated and irradiated films. The energy dependence of the EBT2 film was found to be relatively small, within measurement uncertainties for all energies and modalities; hence, no correction factor was applied. The experimental setup is as shown in Figure 3.
egs_brachy calculation of g(r) and F(r,θ) for a bounded phantom
In this study, we mimicked the in-house designed water phantom, with a PMMA boundary of 30 × 30 × 30 cm3 geometry, used in experimental work, as a rectilinear water phantom which includes a 1 cm PMMA plate at the centre of the water phantom for the calculation of g(r) and F(r,θ), as described in the above sections. For the bounded phantom calculation, we simulated 4 × 10⁹ histories to get 1σ statistical uncertainties (type A) of 2% or less. The voxel sizes were chosen as follows: 0.1 × 0.1 × 0.1 mm3 voxels used for the distance of r ≤ 1 cm, 0.5 × 0.5 × 0.5 mm3 voxels for 1 < r ≤ 5 cm and 1 × 1 × 1 mm3 voxels for 5 < r ≤ 10 cm respectively to provide the adequate spatial resolution. Other than the bounded phantom geometry, all other calculation parameters were kept similar to the unbounded phantom calculation.
Results
Calculated TG43U1 parameters in an unbounded phantom using egs_brachy
The dose rate constant, Λunbou, for the BEBIG 60Co source is obtained as 1.098 ±0.001 cGyh-1 U-1, whereas the dose rate constant (CONΛ) provided by the consensus data was 1.092 ±0.011 cGyh-1 U-1. The radial dose functions, g(r)unbou, calculated for the line source (L = 0.35 cm) are shown in Figure 4 from a radial distance of 0.2 cm to 20 cm with corresponding calculated uncertainties of 0.15% (type A), which is in good agreement with the consensus data with maximum deviation of 0.6%. The anisotropy function, F(r,θ)unbou for the three radial distances are shown in Figure 5, which is in good agreement, i.e., within 2%, with the consensus data up to θ < 175°, and beyond 175°, a maximum variation of up to 10% is found. The statistical uncertainties (type A) are 1.5%, 0.4%, and 1% for θ < 5°, 7° ≤ θ ≤ 170°, and 175° ≤ θ ≤ 180°, respectively for the radial distance of 0.25 cm to 20 cm. The dose rate around the source is presented as along-away data in Table 2, which is in agreement with the available consensus data within 2%.
Fig. 4
Comparison of egs_brachy Monte Carlo calculated radial dose function g(r)unbou for BEBIG 60Co source in an unbounded phantom with consensus data. The approximate statistical uncertainty (type A) in our calculation is 0.15%
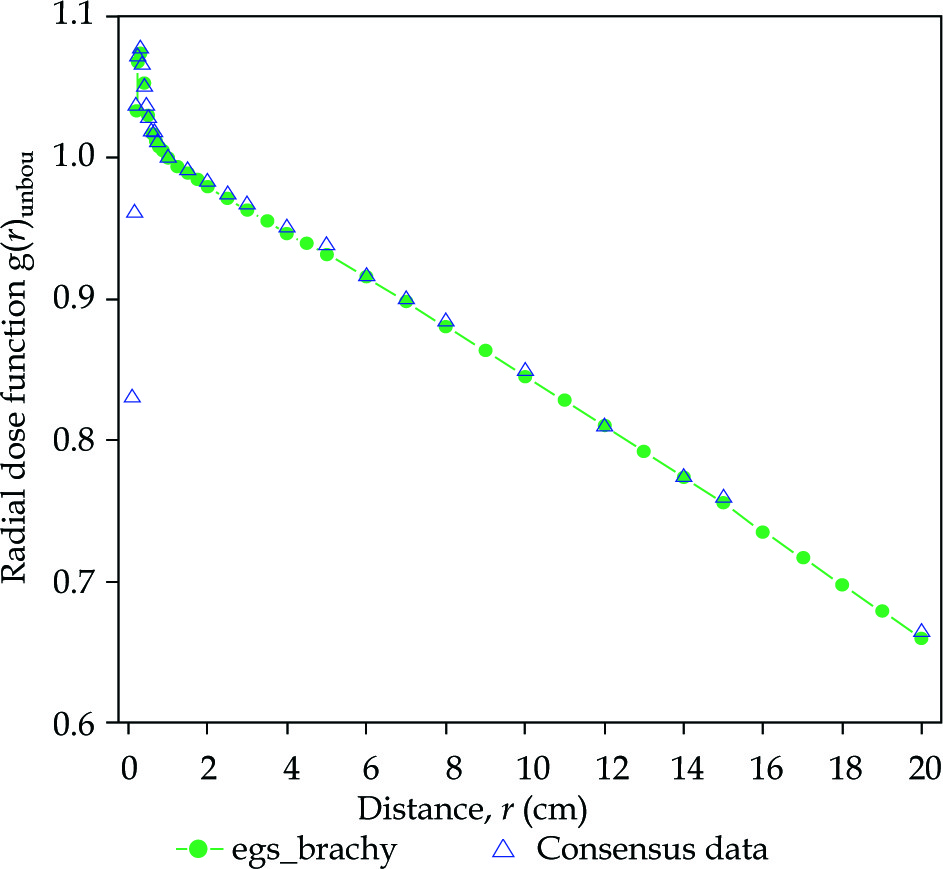
Fig. 5
Anisotropy function F(r,θ)unbou for the BEBIG 60Co source calculated using the line source approximation with L = 3.5 mm in comparison with consensus data. The approximate statistical uncertainties (type A) are 1.5%, 0.4%, and 1% for θ < 5, 7 ≤ θ ≤ 170, and 175 ≤ θ ≤ 180, respectively, for all the radial distances
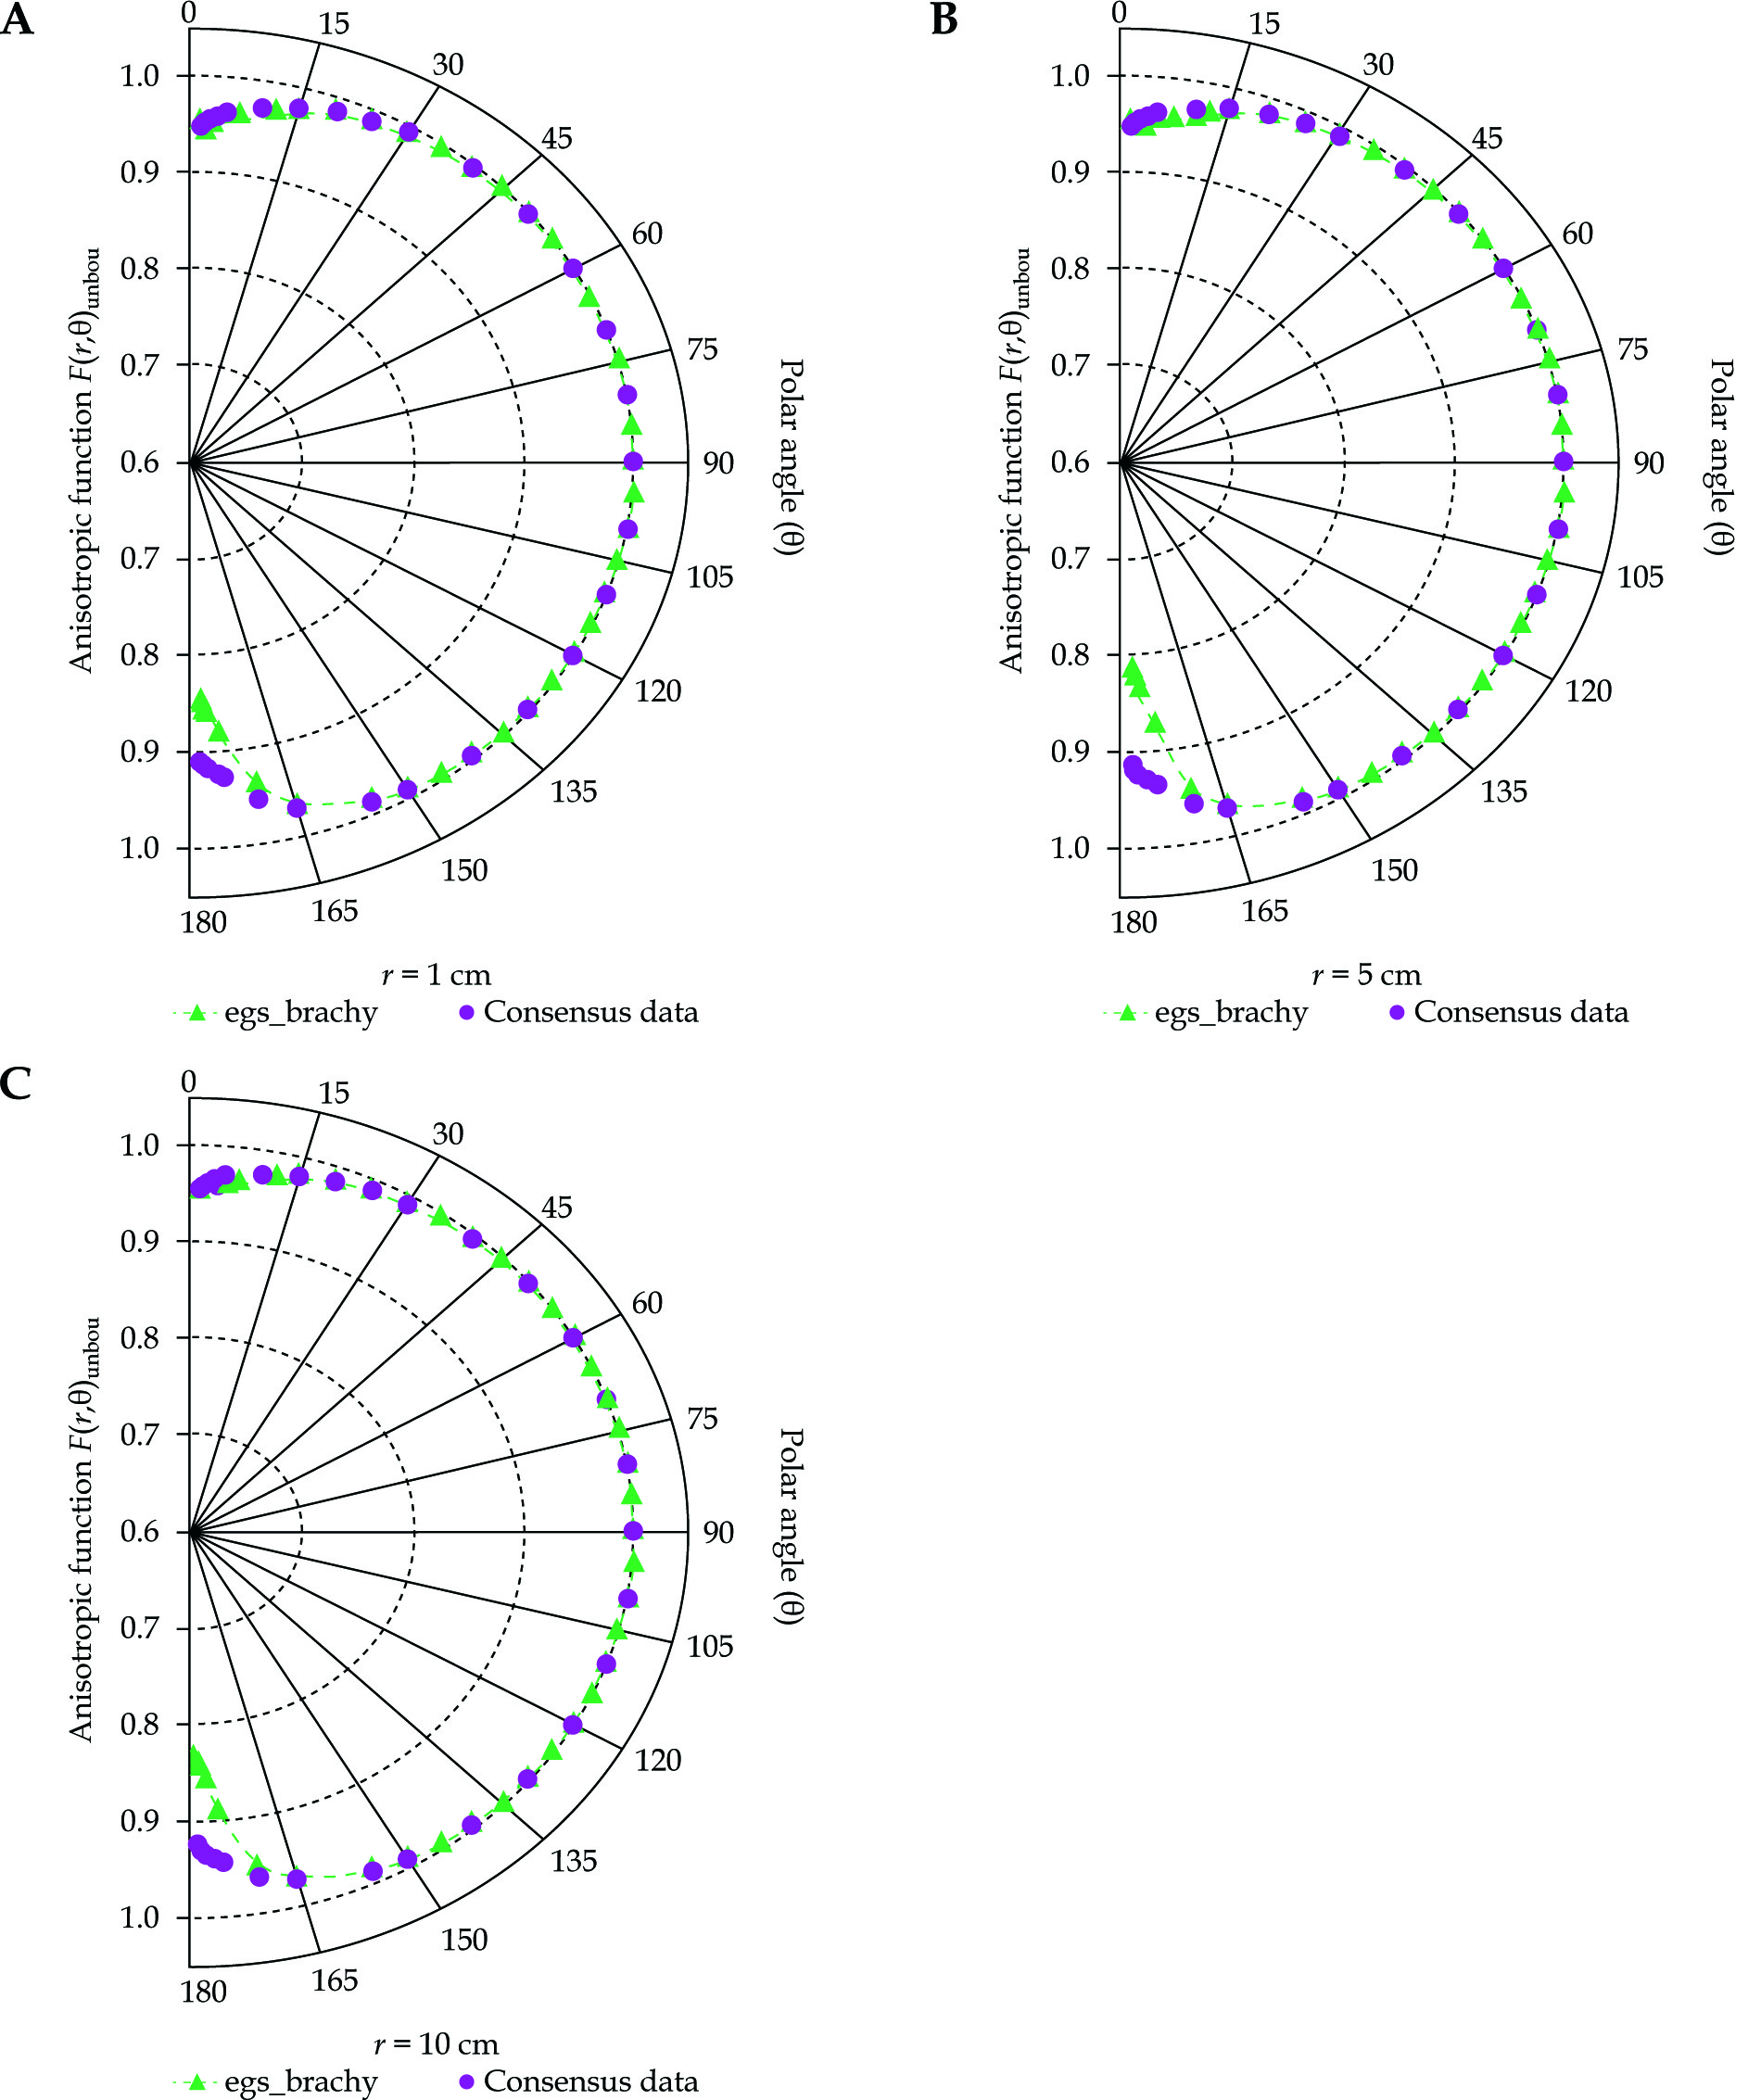
Table 2
Dose-rate – along-away data in an unbounded liquid water phantom per unit air-kerma strength (cGy h-1 U-1) around BEBIG 60Co source
egs_brachy calculated and measured g(r) and F(r,θ) in a bounded phantom
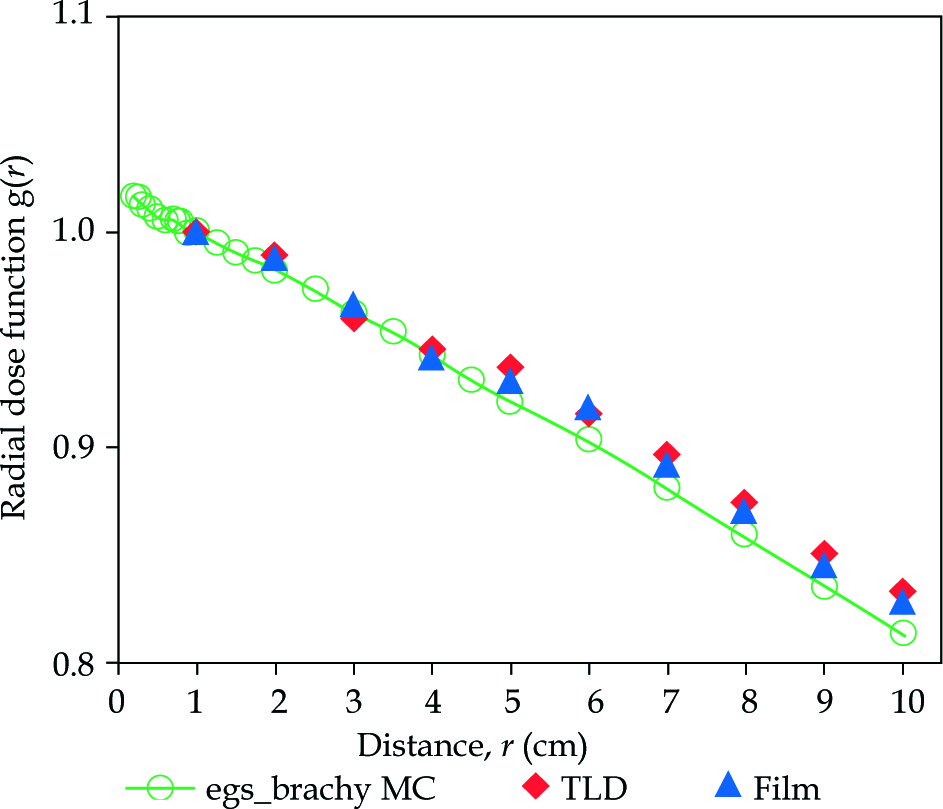
Figure 6 shows the g(r), obtained by the experimental methods, using TLD-100 rods (g(r)TLD) and Gafchromic EBT2 film (g(r)Film), in comparison with the egs_brachy MC calculation, (g(r)bou). The results are shown from 1 cm to 10 cm for both experimental methods, whereas the egs_brachy MC calculated values are shown from 0.2 cm to 10 cm. The variation of the radial dose function, g(r), between the TLD measurement (g(r)TLD) and the egs_brachy MC (g(r)bou), is found to be between 0.2% and 2.4%. In a similar comparison with the EBT2 film measurement (g(r)Film), the variation is found to be between 0.1% and 1.8%. The uncertainties (type A) in the measurements were 1.5% for film, 2% for TLD-100 and 0.5% for egs_brachy calculation.
Fig. 6
Comparison between bounded phantom measured radial dose function g(r) using TLD-100 (g(r)TLD), Gafchromic EBT2 Film (g(r)film) and egs_brachy MC calculated (g(r)bou) values. The approximate uncertainties in the measurements (type A) were 1.5% for film, 2% for TLD-100 and 0.5% for egs_brachy calculation
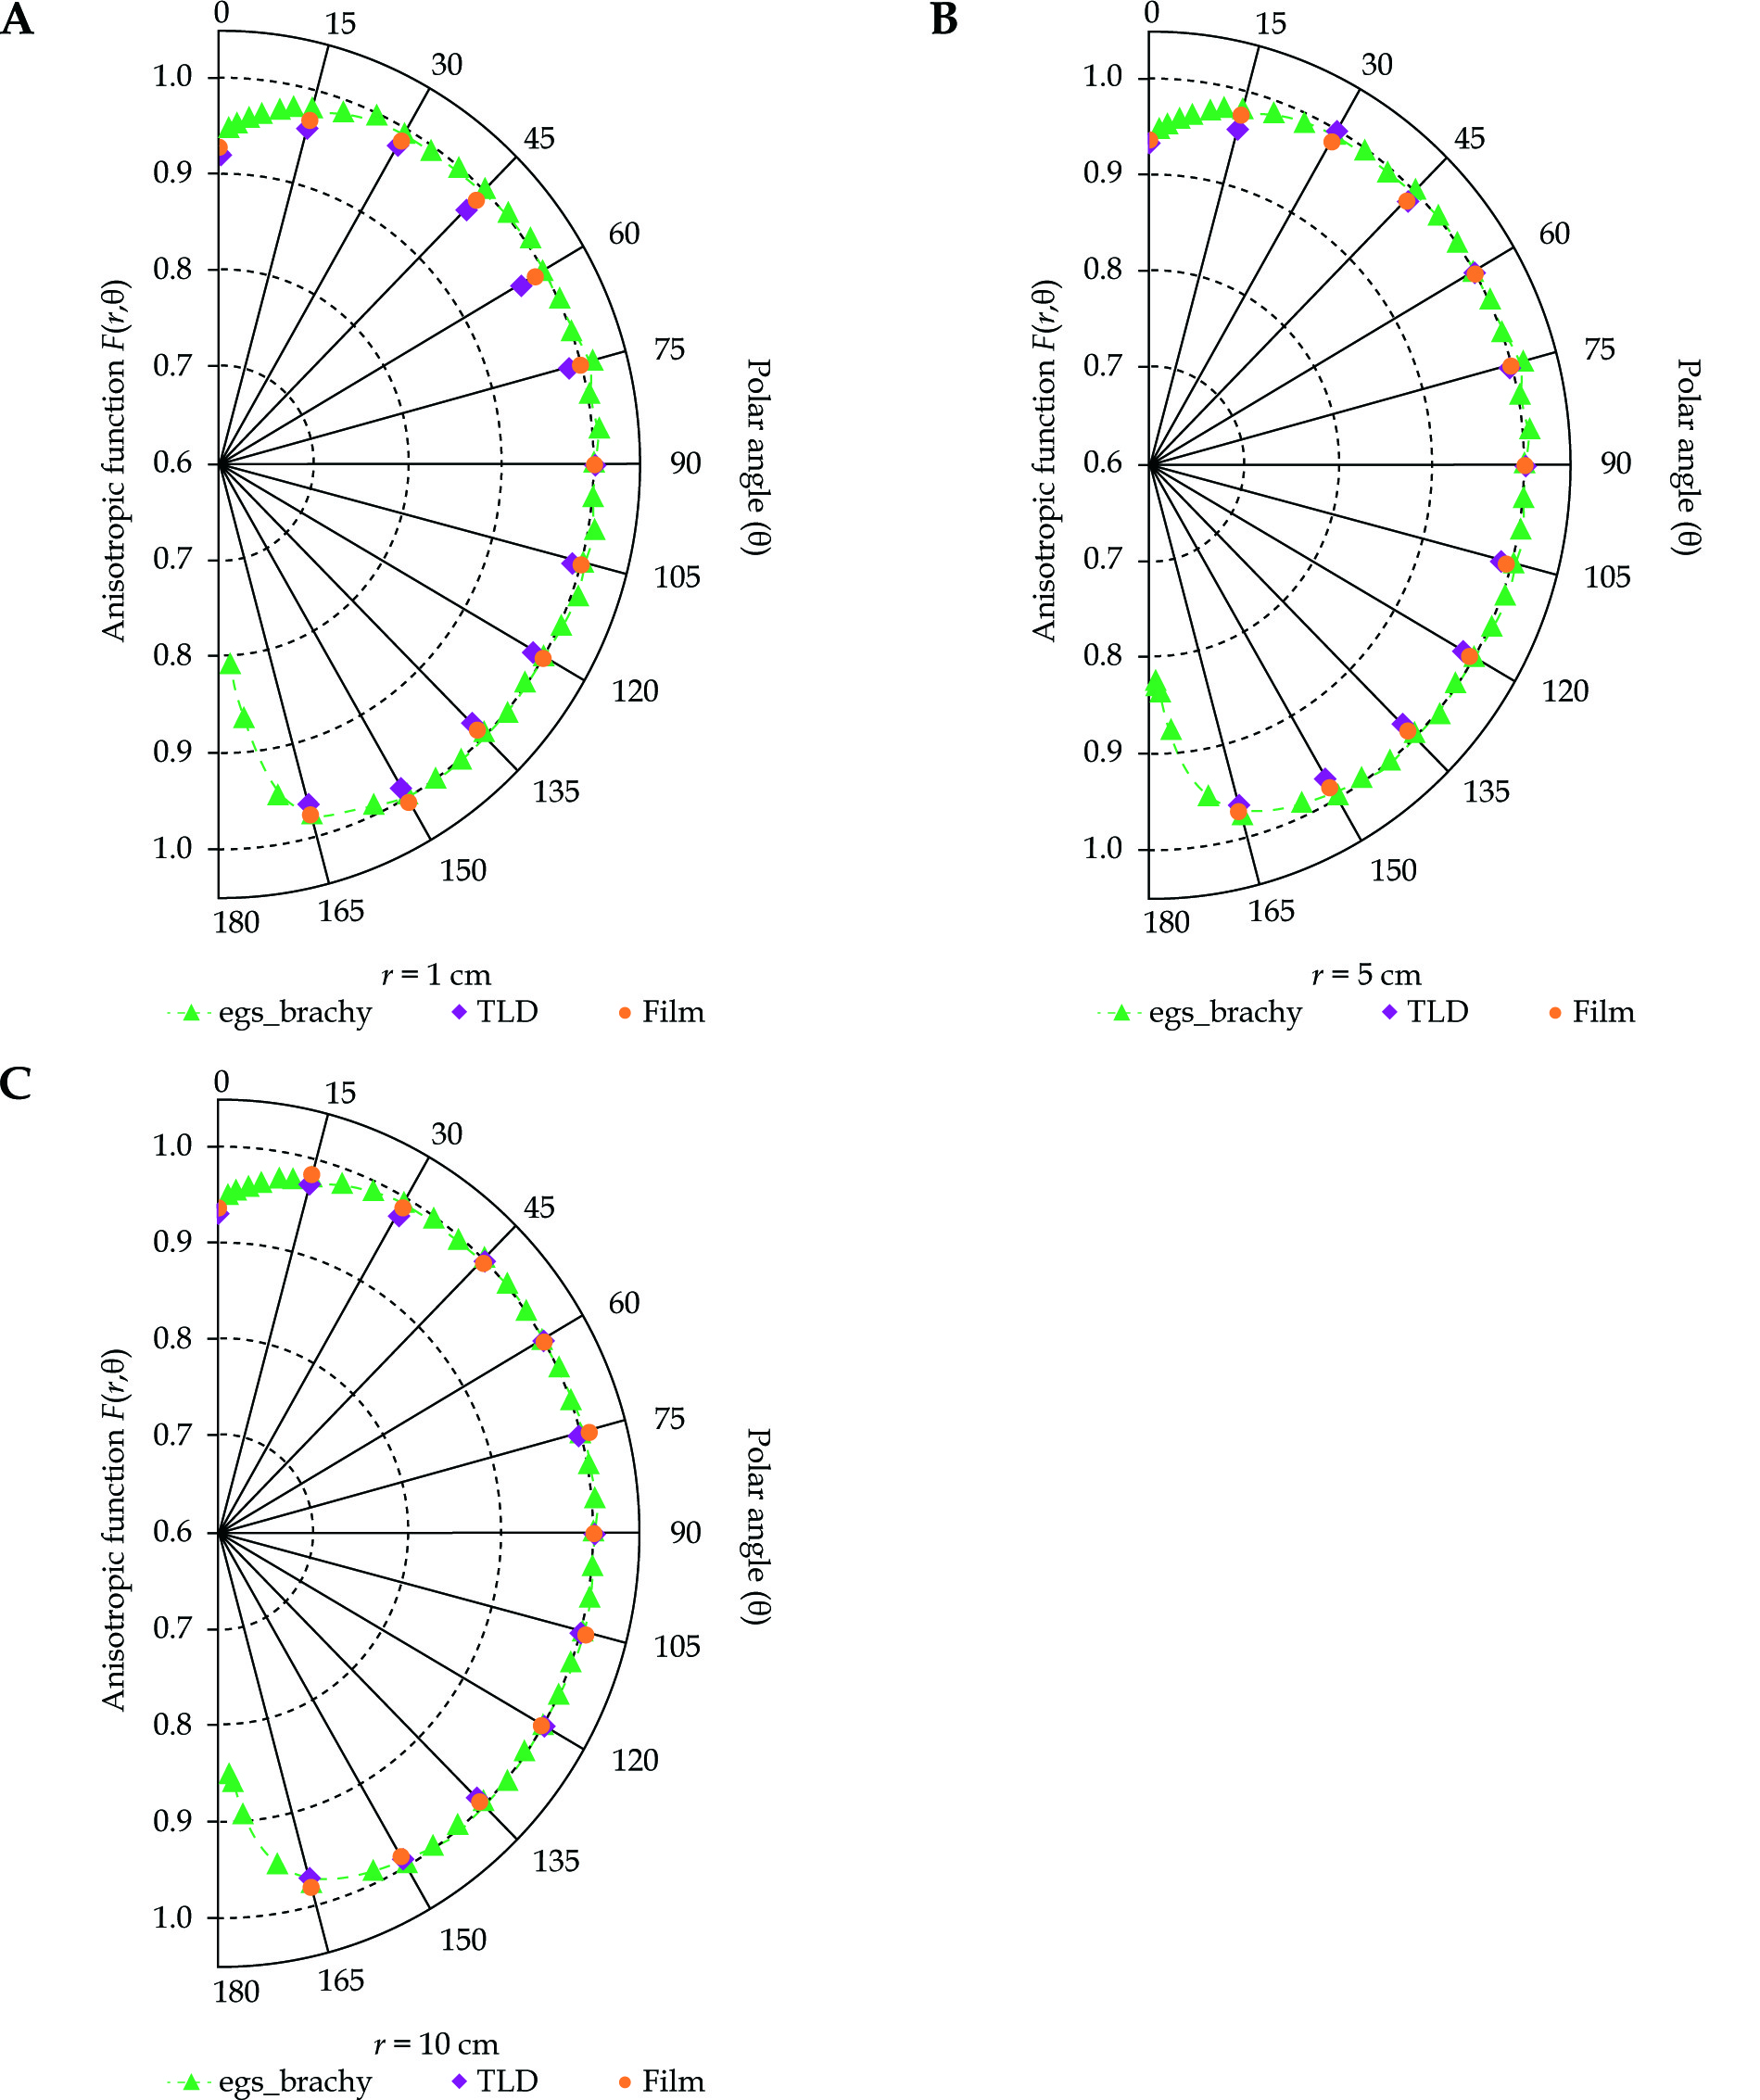
The comparison between the measured F(r,θ), using TLD-100 (F(r,θ)TLD) and the Gafchromic EBT2 film, (F(r,θ)film), with the egs_brachy MC calculated values, (F(r,θ)bou), for the radial distances of 1, 5, and 10 cm, is shown in Figure 7. The measured values of F(r,θ)TLD, in comparison with F(r,θ)bou, show a maximum variation of 2.8% and most of the variations are within 2% for the rest of the points measured. Similarly, a maximum variation of 1.7% is observed in the Gafchromic EBT2 film measurement and most of the measured points vary within 1.5% of the simulation results.
Fig. 7
Comparison between bounded phantom measured anisotropy function F(r,θ) using TLD-100 F(r,θ)TLD, Gafchromic EBT2 Film F(r,θ)film vs egs_brachy MC calculated values F(r,θ)bou for the radial distance of 1, 5 and 10 cm is shown in (A), (B) and (C) respectively. The approximate uncertainties in the measurements (type A) were 1% for film, 1.5% for TLD-100 and 1% up to 10 cm for egs_brachy calculation
Discussion
As per TG43U1 [2] and HBED Working Group report [3], the MC calculations and their experimental validation methods by any possible dosimeters (e.g., TLD or film) average out the possible biases of each method. After a successful validation, the MC calculated dosimetric parameters can be used as inputs to the clinical dosimetry through treatment planning systems.
It is important to consider the size of the phantom involved when calculating the dosimetric parameters of any brachytherapy dosimetry study, either by the MC calculation or by experimental methods [26,27,28]. Granero et al. [9] analyzed the BEBIG 60Co HDR source using the GEANT4 MC code. They provided TG43U1 data such as dose-rate constant, radial dose function, and anisotropy function, and the 2D along and away dose rate table. They used an unbounded liquid water phantom, where the source was immersed in the centre of a spherical water phantom of 50 cm in radius. Guerrero et al. [29] used the PENELOPE simulation code for the BEBIG 60Co HDR source to get a full dosimetric dataset following the guidelines of the AAPM and ESTRO report. All the TG-43 based dosimetric parameters have been calculated for the two different geometries a) Detailed Geometry (GD) and b) Simplified Geometry (Gs). The main difference between these two is that the conical tip of the source, which is available in GD, is made to be flat in GS. Further, the results were compared with other published values of Selvam and Bhola [30], Granero et al. [9], and Anwarul et al. [31]. According to the results of Guerrero et al. [29], the g(r), obtained from the GD and Gs for the BEBIG 60Co HDR source shows a maximum variation of 0.7% between the two different simulated geometries of the source. The relative uncertainties in the F(r,θ) values were less than 2% in the same study. Selvam et al. [30] used an EGSnrc based DOSRZnrc user code which has a limitation of a conical source tip in the modelling, so they used the simplified geometry (GS) and used a cylindrical water phantom with a length and diameter of 1 m. They compared their results with the GEANT4 based calculation of Granero et al. [9] and found that the dose rate data are higher by 14% along the longitudinal axis where the source cable is connected.
In this study, we calculated the TG43U1 dosimetric dataset for an unbounded liquid water phantom, using the egs_brachy application and compared with the consensus data for its validation before comparing its calculation with the measured (g(r)bou) and (F(r,θ)bou), using TLD-100 and Gafchromic EBT2 film in a bounded phantom.
The comparison of F(r,θ)unbou with the consensus data shows a maximum deviation of up to 10% for θ ≥ 175, possibly due to Granero et al. [9] having modelled the steel cable length as 1 mm instead of 5 mm, which was discussed by Selvam et al. [30] in along-away dose rate differences. From Table 2, it can be seen that the dose rate data along-away table agrees well with the available consensus data. At along z = 0 cm and away y = 0.2 cm, the value is 23.52 cGy h-1U-1, which, when compared with the value published by Anwarul et al. [31] of 23.2 cGy h-1U-1, is in agreement, and the variation is 1.4%. Therefore, based on our calculated dosimetric data for the BEBIG 60Co source, using the egs_brachy agrees well with the published values.
Subsequent to the validation of the egs_brachy calculation, we measured g(r) and F(r,θ) for the BEBIG 60Co source (Co0.A86) using the TLD-100 and Gafchromic EBT2 film in an in-house water phantom. To compare these experimental results with the MC calculation and to reduce the uncertainty to get more accurate calculation results, we mimicked the geometry of the phantom similar to the experimental setup as a bounded water phantom, because all other published MC results were in an unbounded phantom of radius of either 50 cm or 100 cm, as discussed above. From our results of the g(r) and F(r,θ), the observed variation between the experimental methods and the egs_brachy calculation are found to be well within the acceptable experimental uncertainties of 3%.
Conclusions
In this study, we validated the egs_brachy calculation of the TG43U1 dataset for the BEBIG 60Co source for an unbounded geometry. Subsequently, we measured the g(r) and F(r,θ) for the same source using an in-house water phantom. These parameters are essential for the computation of the dose in the water medium as per the TG43U1 formalism and there are no experimental values in the published literature for the type of source we studied. In addition to this, we validated these experimental results with the values calculated using the egs_brachy MC code, with the same geometry and a similar phantom material as used in the experimental methods.


