Introduction
Inflammatory bowel disease (IBD), comprising Crohn’s disease (CD) and ulcerative colitis (UC), is a group of chronic disorders with a complex and multifactorial aetiopathogenesis. It is currently assumed that IBD results from immune dysregulation triggered by environmental factors in genetically predisposed individuals [1].
In recent years, substantial progress has been made in the development of biologic therapies and small-molecule drugs; however, anti-tumour necrosis factor alpha (anti-TNF-α) agents, such as infliximab and adalimumab, remain widely used in clinical practice. These therapies are also commonly prescribed in patients with concomitant conditions, including spondyloarthropathies. Nevertheless, up to 40% of patients fail to respond to anti-TNF-α treatment [2]. Importantly, the likelihood of achieving remission is highest with the first biologic agent and decreases significantly with subsequent biologic or small-molecule therapies [3]. Consequently, there is a growing need for reliable biomarkers that could support optimal treatment selection for individual patients [4].
In line with current trends in IBD management, patient phenotyping has become a key element in guiding therapeutic decisions. It is therefore essential to determine whether comorbidities may affect treatment response and whether commonly used biomarkers, such as faecal calprotectin, are capable of predicting response to therapies with specific mechanisms of action.
Although colonoscopy remains the gold standard for assessing treatment response in IBD, it is invasive, costly, and unsuitable for frequent monitoring. To date, no non-invasive biomarker has been shown to rapidly and reliably assess treatment efficacy while also predicting therapeutic response. In recent years, oncostatin M (OSM) has emerged as a potential inflammatory marker in IBD. OSM is a member of the gp130 cytokine family and plays pleiotropic roles in cell differentiation, proliferation, and immune and inflammatory processes [5]. West et al. demonstrated that OSM is among the most highly expressed cytokines in inflamed intestinal tissue of patients with IBD and that elevated tissue OSM levels are associated with resistance to anti-TNF-α therapy [6]. Furthermore, Bertani et al. reported that serum OSM measured by enzyme-linked immunosorbent assay (ELISA) predicted mucosal healing in patients with CD [7].
Aim
Based on these observations, we aimed to evaluate the utility of several clinical and biochemical parameters, including serum OSM, in predicting response to anti-TNF-α therapy in patients with IBD.
Material and methods
Patients
This prospective, single-centre study enrolled 135 consecutive adult patients with inflammatory bowel disease, including CD (n = 85) and UC (n = 50), who were receiving biologic therapy due to disease flares. All patients had a confirmed diagnosis of IBD based on clinical presentation, laboratory findings, imaging studies, endoscopy, and histopathology.
Patients presented with moderate-to-severe disease activity, defined as a total Mayo score (TMS) > 6 for UC or a Crohn’s Disease Activity Index (CDAI) > 300 for CD, and had an inadequate response to, loss of response to, or intolerance of corticosteroids and/or immunosuppressive therapy. Previous exposure to biologic therapy was permitted. Key exclusion criteria included indeterminate colitis, toxic megacolon, and active infection.
Patients were recruited during outpatient visits at the Department of Gastroenterology and Internal Medicine in Warsaw, Poland, between 1 September 2018, and 30 September 2019. Forty-five patients (all with CD) were treated with adalimumab, and 90 patients (with CD or UC) received infliximab. Peripheral spondyloarthropathy was present in 35 patients, and axial spondyloarthropathy in 25 patients (Table I).
Table I
Baseline characteristics of the study group
Treatment
Patients treated with infliximab received intravenous infusions at a dose of 5 mg/kg at weeks 0, 2, and 6, in accordance with current clinical guidelines. At each infusion visit, patients underwent a clinical assessment, and CDAI or TMS was calculated as appropriate.
Patients treated with adalimumab received subcutaneous injections at week 0 (160 mg), week 2 (80 mg), and every two weeks thereafter until week 12 (40 mg). Clinical assessment and CDAI calculation were performed at weeks 0, 2, and 12.
Assessment of treatment response
Clinical disease activity was assessed using CDAI for CD and TMS for UC. Clinical response was defined as a reduction in TMS of ≥ 3 points for UC or a reduction in CDAI of ≥ 70 points for CD. Endoscopic improvement in UC was defined as a Mayo endoscopic subscore (MES) ≤ 1, and endoscopic remission as MES = 0.
Oncostatin M measurement
Serum oncostatin M concentrations were measured using a commercially available enzyme-linked immunosorbent assay (ELISA) kit (Human Oncostatin M ELISA; Biorbyt, UK). Samples were analysed in duplicate according to the manufacturer’s instructions. Absorbance was measured at 450 nm using a Quanta-Lyser 3000 reader. Concentrations were calculated from a standard curve and expressed in pg/ml. The minimum detectable concentration was < 10 pg/ml, and the assay detection range was 15.6–1000 pg/ml.
Statistical analysis
Continuous variables were presented as mean ± standard deviation or median with interquartile range, depending on data distribution. Normality was assessed using the Shapiro–Wilk test and verified by skewness and kurtosis. Homogeneity of variance was evaluated using Levene’s test. Between-group comparisons were performed using Student’s t test, Welch’s t test, Mann–Whitney U test, Pearson’s χ2 test, or Fisher’s exact test, as appropriate. Paired comparisons were conducted using the Wilcoxon signed-rank test.
Effect sizes were reported as mean or median differences or Cramér’s V with 95% confidence intervals. Receiver operating characteristic (ROC) analysis was used to assess the predictive performance of OSM and calprotectin, with optimal cut-off values determined using the Youden index. Results were expressed as area under the curve (AUC) with 95% confidence intervals, sensitivity, specificity, positive predictive value, and negative predictive value.
The association between biomarker levels and treatment response was further analysed using univariate and multivariate logistic regression models, with IBD subtype included as a covariate. Model performance was assessed using Nagelkerke’s R2 and the Hosmer–Lemeshow goodness-of-fit test, and multicollinearity was evaluated using variance inflation factor (VIF) values. A two-sided p-value < 0.05 was considered statistically significant. Statistical analyses were performed using R software (version 4.1.2 or later).
Results
A clinical response to anti-TNF-α therapy was achieved in 92 patients with IBD (68.1%). Among patients with UC, endoscopic improvement was observed in 35 patients (70%), and endoscopic remission in 21 patients (42%).
Oncostatin M concentration
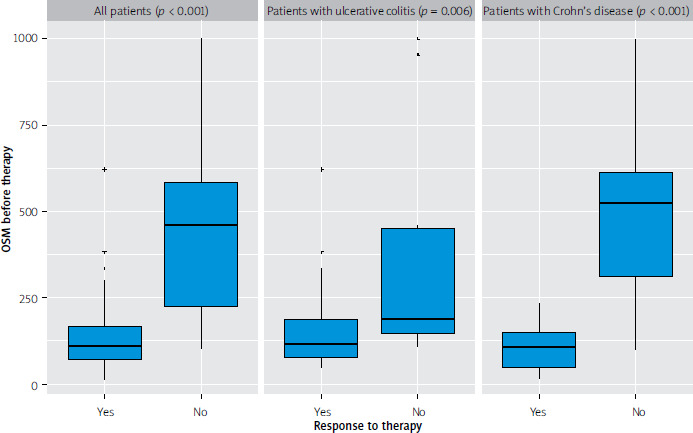
In the overall cohort, baseline serum OSM concentration was significantly lower in patients who responded to therapy compared with non-responders (MD = –348.07; 95% CI: –400.72 to –242.96; p < 0.001). Similar results were observed in both disease subgroups. In patients with UC, baseline OSM concentration was significantly lower in responders than in non-responders (MD = –72.75; 95% CI: –319.29 to –32.59; p = 0.006), while in patients with CD the difference was more pronounced (MD = –380.48; 95% CI: –460.94 to –300.02; p < 0.001) (Table II, Figure 1).
Table II
Comparison of baseline OSM concentrations between responders and non-responders in the overall study population and stratified by IBD subtype
[i] Data are presented as mean ±standard deviation or median (interquartile range) depending on the distribution. MD – mean or median difference (patients with response to therapy vs. patients without response to therapy), CI – confidence interval. Comparisons were performed using the t-Student test1 or Mann-Whitney U test, as appropriate.
Figure 1
Boxplot showing the distribution of baseline OSM concentrations in responders and non-responders in the overall study population and stratified by ulcerative colitis and Crohn’s disease
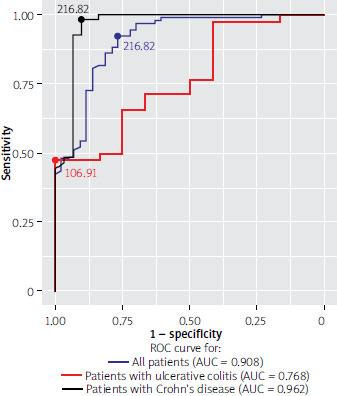
In the entire study population, baseline OSM concentration demonstrated high predictive accuracy for treatment response (AUC = 0.908; 95% CI: 0.848–0.960; p < 0.001). Patients with OSM concentrations below 216.82 pg/ml were more likely to respond to therapy, with a sensitivity of 92% and a specificity of 77%.
Among patients with CD, baseline OSM concentration showed very high predictive performance (AUC = 0.962; 95% CI: 0.909–0.999; p < 0.001). An OSM cut-off value of 216.82 pg/ml predicted treatment response with a sensitivity of 98% and a specificity of 90%.
In patients with UC, baseline OSM concentration demonstrated moderate predictive value (AUC = 0.768; 95% CI: 0.618–0.893; p = 0.002). An OSM cut-off value of 106.91 pg/mL predicted response with a sensitivity of 47% and a specificity of 100% (Figure 2).
Figure 2
ROC curves for baseline OSM concentration predicting treatment response in the overall study population and stratified by IBD subtype
Across the entire cohort, serum OSM concentrations decreased significantly after treatment in both responders and non-responders. In responders, median OSM concentration decreased from 109.05 to 19.20 pg/ml (MD = –89.85; 95% CI: –100.78 to –74.80; p < 0.001). In non-responders, median OSM concentration decreased from 457.12 to 395.43 pg/ml (MD = –61.69; 95% CI: –76.74 to –32.95; p < 0.001).
In patients with UC, a significant reduction in OSM concentration was observed only among responders (median decrease from 114.22 to 21.57 pg/ml; MD = –92.65; 95% CI: –126.82 to –76.73; p < 0.001), whereas no significant change was observed among non-responders (p = 0.176). In patients with Crohn’s disease, OSM concentrations decreased significantly in both responders (median decrease from 108.37 to 17.40 pg/ml; MD = –90.97; 95% CI: –98.36 to –65.78; p < 0.001) and non-responders (median decrease from 525.30 to 419.88 pg/ml; MD = –105.42; 95% CI: –94.84 to –38.31; p < 0.001) (Table III).
Table III
Comparison of baseline and post-treatment OSM concentrations in responders and non-responders in the overall study population and stratified by IBD subtype
Impact of age and disease type
A significant difference in treatment response was observed in the proportion of patients aged 17–40 years with A2 classification of CD (42.6% in responders vs. 71.0% in non-responders; p = 0.022). The strength of this association was low to moderate (Cramér’s V = 0.27; 95% CI: 0.06–0.46) (Table IV).
Table IV
Comparison of baseline characteristics between responders and non-responders in the overall study population and stratified by IBD subtype
[i] Data are presented as mean ± standard deviation or median (interquartile range), depending on the distribution, numeric variables, and n (%) for categorical variables. SD – standard deviation, IQR – interquartile range, MD – mean or median difference (patients with response to therapy vs. patients without response to therapy), CI – confidence interval. Comparisons were performed using t-Student test1, t-Welch test2, Mann-Whitney U test3, Pearson’s χ2 test, or Fisher’s exact test4, as appropriate. *Proportions and statistics for the total study group calculated for adequacy.
Spondyloarthropathy
In the overall cohort, peripheral spondyloarthropathy was less frequent among responders than non-responders (14.1% vs. 51.2%; p < 0.001), with a moderate association strength (Cramér’s V = 0.39; 95% CI: 0.22–0.55). Similar findings were observed in the CD subgroup (11.1% vs. 51.6%; p < 0.001), with a moderate-to-strong association (Cramér’s V = 0.45; 95% CI: 0.24–0.65) (Table IV).
Axial spondyloarthropathy was also less common among responders than non-responders in the total cohort (12.0% vs. 32.6%; p = 0.008), with a low-to-moderate association (Cramér’s V = 0.25; 95% CI: 0.08–0.41). In patients with CD, axial spondyloarthropathy was less frequent among responders than non-responders (11.1% vs. 35.5%; p = 0.015), with a moderate association (Cramér’s V = 0.29; 95% CI: 0.06–0.50) (Table IV).
Previous exposure to biologic therapy
Previous exposure to biologic therapy was significantly more common among non-responders than responders in the overall cohort (69.8% vs. 23.9%; p < 0.001), with a moderate association strength (Cramér’s V = 0.44; 95% CI: 0.28–0.59). Similar associations were observed in both UC and CD subgroups (p = 0.023 and p < 0.001, respectively), with stronger effects noted in CD (Table IV).
Calprotectin
Baseline faecal calprotectin levels were significantly lower in responders than in non-responders in the overall cohort (MD = –425.50; 95% CI: –659.58 to –200.00; p < 0.001). This difference remained significant in patients with CD (MD = –748.32; 95% CI: –1013.00 to –351.50; p < 0.001) (Table IV).
In the total cohort, baseline calprotectin demonstrated low-to-moderate predictive accuracy for treatment response (AUC = 0.690; 95% CI: 0.589–0.780; p = 0.005). A cut-off value of 989.00 µg/g predicted response with a sensitivity of 71% and a specificity of 65%. In patients with CD, predictive performance was moderate (AUC = 0.743; 95% CI: 0.631–0.841; p = 0.006), with a cut-off value of 976.00 µg/g (sensitivity 70%, specificity 77%). All performance measures for calprotectin were inferior to those observed for OSM. In patients with UC, calprotectin was not a significant predictor of treatment response (AUC = 0.500; 95% CI: 0.322–0.689; p = 0.647) (Table V).
Table V
Results of receiver operating characteristic (ROC) analysis for baseline calprotectin concentrations in predicting treatment response
Logistic regression analysis
The influence of baseline OSM and calprotectin levels on the odds of treatment response was assessed using logistic regression models. In univariate analysis, each one-unit increase in baseline OSM concentration was associated with a 1% reduction in the odds of response (OR = 0.99; 95% CI: 0.98–0.99; p < 0.001). A one-unit increase in baseline calprotectin concentration had a negligible effect on treatment response (OR = 1.00; 95% CI: 1.00–1.00; p = 0.014).
In the multivariate model, baseline OSM concentration remained a significant predictor of treatment response (OR = 0.99; 95% CI: 0.98–0.99; p < 0.001), whereas calprotectin was not independently associated with response (p = 0.462) (Table VI). Model performance was confirmed by Nagelkerke’s R2 (0.62) and the Hosmer–Lemeshow goodness-of-fit test (p = 0.115). Variance inflation factor values were 1.0 for all variables (OSM, calprotectin, and IBD subtype), indicating no multicollinearity.
Table VI
Results of logistic regression analysis evaluating baseline OSM and calprotectin concentrations as predictors of treatment response, with IBD subtype included as a covariate in the multivariate model
Discussion
The primary therapeutic goal in patients with IBD is to achieve and maintain clinical and endoscopic remission. In recent years, mucosal healing (MH) has been introduced as a long-term treatment target and is defined as endoscopic and histological remission. Achievement of MH is associated with a favourable prognosis, including a reduced risk of disease relapse and the need for surgical intervention [8]. At present, endoscopic assessment remains the only diagnostic tool that can definitively confirm MH in patients with IBD [9]. However, endoscopy is invasive, costly, time-consuming, and burdensome for patients. Consequently, non-invasive biomarkers are commonly used in routine clinical practice, with C-reactive protein (CRP) and faecal calprotectin (FCP) being the most widely applied.
A reduction in CRP concentration has been associated with improved treatment response and short- to medium-term prognosis in several randomised controlled trials, including studies involving anti-TNF-α antibodies [10]. Previous studies have shown that patients with CD and higher baseline CRP levels are more likely to be non-responsive to infliximab therapy [11], while elevated CRP levels before infliximab treatment in UC have been associated with treatment resistance [12]. Moreover, an early decrease in faecal calprotectin following initiation of biologic therapy has been shown to predict a favourable treatment response in IBD patients [13].
In the present study, baseline calprotectin levels were significantly lower in patients who responded to therapy compared with non-responders. However, the predictive performance of calprotectin for treatment response was only low to moderate, and calprotectin was not an independent predictor of response in multivariate analysis. These findings suggest that although calprotectin reflects intestinal inflammatory burden, its utility as a predictive biomarker for anti-TNF-α treatment response is limited.
In recent years, increasing attention has been directed toward the identification of novel biomarkers capable of predicting response to biologic therapy. One such candidate is oncostatin M (OSM). West et al. first described an association between OSM expression and response to anti-TNF-α therapy, demonstrating that patients with IBD exhibit higher expression of OSM and its receptor (OSMR) in inflamed intestinal tissue compared with healthy controls, with expression levels correlating with histological disease severity [6]. Because tissue-based assessment of OSM requires invasive endoscopic procedures, subsequent studies explored the potential utility of serum OSM measurements, hypothesising that elevated circulating OSM levels might also be associated with early and late non-response to anti-TNF-α therapy.
Minar et al. reported that median serum OSM concentrations were significantly lower in biochemical responders than in non-responders and that elevated plasma OSM levels predicted biochemical non-response with moderate accuracy [14]. However, this study was limited to a paediatric population, and treatment response was defined solely by biochemical criteria. The authors also emphasised that the heterogeneity of the study cohort limited definitive conclusions regarding the role of OSM as a predictive biomarker.
In contrast, the present study included an adult population with both CD and UC, and treatment response was defined using established clinical and endoscopic criteria. We demonstrated that baseline serum OSM concentrations below 216.82 pg/ml were strongly associated with treatment response, with high sensitivity and specificity. Importantly, OSM remained an independent predictor of response in multivariate analysis.
Bertani et al. evaluated serum OSM levels in patients with CD treated exclusively with infliximab and reported significantly lower OSM concentrations in patients achieving mucosal healing at both baseline and week 14 [7]. In our study, we extended these observations by including patients with both CD and UC treated with infliximab or adalimumab and demonstrated consistent associations between low baseline OSM levels and treatment response.
Other studies have also explored the relationship between tissue and serum OSM levels in IBD. Verstockt et al. demonstrated significant correlations between tissue and serum OSM expression and showed increased OSM and OSMR expression in both early-stage and postoperative recurrent IBD [15]. They further confirmed that elevated mucosal OSM and OSMR levels were associated with lack of endoscopic response to anti-TNF-α therapy. In the present study, OSM was assessed exclusively in serum, highlighting the potential utility of a non-invasive biomarker.
Conversely, Lin et al. reported that baseline serum OSM levels were independent of treatment response in a preliminary analysis of CD patients treated with anti-TNF-α agents [16]. Other investigations, including studies by Guo et al., have reported findings consistent with our results, demonstrating significantly lower baseline OSM levels in patients achieving clinical remission and identifying clinically relevant OSM cut-off values for response prediction [17].
Additional studies using alternative assay methods, such as chemiluminescence immunoassays, have also demonstrated elevated serum OSM levels in patients with active disease and in clinical non-responders compared with responders [18]. Furthermore, a recent meta-analysis confirmed significant associations between elevated OSM levels, disease severity, and poor response to anti-TNF-α therapy [19].
Beyond biochemical markers, our study also identified clinical factors associated with treatment response. Patients who responded to anti-TNF-α therapy and had lower baseline OSM concentrations were less likely to have concomitant peripheral or axial spondyloarthropathy. This observation may be explained by the presence of OSM in synovial fluid and its proposed role in inflammatory joint disease [20].
Conclusions
In this study, we demonstrated that several clinical and biochemical parameters – including patient age, disease location, concomitant IBD-associated spondyloarthropathy, and calprotectin concentration – may influence response to anti-TNF-α therapy. However, only low baseline serum oncostatin M concentration was consistently associated with a favourable treatment response. These findings suggest that OSM may serve as a promising biomarker for predicting response to anti-TNF-α therapy and a potential therapeutic target in IBD.
Nevertheless, as elevated OSM levels may occur in various inflammatory conditions, the clinical application of OSM as a predictive biomarker requires further validation. In addition, standardisation of measurement techniques and clinically relevant cut-off values across different settings will be essential before routine implementation in IBD management.