
Purpose
High-dose-rate (HDR) brachytherapy as monotherapy has been shown to be a safe and effective method of treating men with low- and intermediate-risk prostate cancer [1,2,3,4,5,6,7,8,9]. This technique was originally proposed in the 1990s by Yoshioka et al. [1,2]. Their treatment consisted of eight to nine fractions delivered over five days. As better understanding of the radiobiology of prostate cancer became clear, fewer fractions with a higher dose per fraction were assessed and found to be effective and safe [4,5,6,7]. One of the most utilized and reported fractionation regimens is the delivery of 27 Gy in two fractions over two implants, which is supported as one of the two standard HDR brachytherapy monotherapy treatment regimens in the current NCCN guidelines [10].
However, the specifics in how to deliver this regimen vary among providers. Different prospective trials have used varying lengths of time between the two fractions: some performing the second implant after one week, some performing the second implant after two weeks, and some allowing for either [7,8,11]. At our institution, patients receive 2 implants that are scheduled either one or two weeks apart, based on patient and brachytherapist availability.
There are limited data studying the influence of the time between fractions on treatment-related toxicity and health related quality of life (QOL). The objective of our study was to determine if the timing between HDR implants was associated with patient-reported health-related QOL or physician-graded toxicity in men being treated with definitive HDR brachytherapy for prostate cancer.
Material and methods
Study design and patient selection
We performed a retrospective cohort study of a prospectively maintained, Institutional Review Board approved database of patients treated with HDR brachytherapy for prostate cancer at our institution. All patients provided informed consent prior to participating. We selected patients with NCCN low- or intermediate-risk prostate cancer, undergoing definitive HDR brachytherapy as monotherapy using 13.5 Gy × 2 fractions.
HDR treatment
Our HDR brachytherapy implant procedure and treatment planning details have been previously described [12]. In brief, patients were implanted with between 17 and 22 catheters based on gland size under transrectal ultrasound guidance. After implantation, computed tomography (CT) and, when possible, magnetic resonance imaging (MRI) of the prostate were obtained and registered for target delineation. The prostate was segmented, and an asymmetric planning target volume of 0-5 mm was created and extended to encompass the proximal seminal vesicles. The second fraction was given one to two weeks after the initial treatment, based on patient, physician, and operating room availability. No patients received supplemental external beam radiation or androgen deprivation therapy.
Patient-reported health-related QOL and physician-graded toxicity assessment
Patient-reported genitourinary (GU), gastrointestinal (GI), and sexual QOL were assessed using the international prostate symptom score (IPSS) and the expanded prostate cancer index composite short form (EPIC-26) [13,14]. Baseline patient-reported health-related QOL scores in the GU, GI, and sexual domains were obtained prior to each patient’s first HDR treatment. Patient-reported health-related QOL scores were assessed at each of the patient’s follow-up appointments. Follow-up appointments typically occurred at 1 month, 3 months, 6 months, 12 months, and subsequent 6-month intervals after the second HDR treatment. For the first 39 patients, only IPSS evaluations were used to assess patient-reported QOL. For the subsequent patients, both IPSS and EPIC-26 GU, GI, and sexual function questionnaires were used to assess patient-reported health-related QOL.
Physician-graded toxicity was assessed utilizing common terminology criteria for adverse events (CTCAE) v5.0 criteria [15]. Physician-graded toxicity was assessed at each follow-up visit and reported as the highest grade reported during any follow-up examination.
Minimal clinically important differences
To further evaluate the patient-reported health related QOL, we characterized statistically significant differences in IPSS or EPIC-26 scores over time or between groups as clinically important or not clinically important through the use of previously reported minimal clinically important difference (MCID) assessments [16,17,18]. For the IPSS, we utilized previously reported data that showed that a change of 3.0 points represents a slight clinical change, a change of 5.1 points indicating a moderate change, and a change of 8.8 points representing a marked change [17]. For the EPIC-26 scores, we utilized previously reported data with 6-9 points for urinary incontinence score, 5-7 points for urinary obstruction score, 4-6 points for bowel score, and 10-12 points for sexual score, to represent a MCID [18].
Exposure and outcome variables of interest
Implant interval was calculated as the time between the first and second implant and was categorized into two groups: one-week (≤ 10 calendar days apart) or two-weeks (> 10 calendar days apart). 10 days was selected as the cutoff based on the days that are available at our institution to perform brachytherapy procedures each week (Tuesday and Thursday). The primary outcomes of interest were patient-reported QOL and physician-graded toxicities, and these were compared between both groups.
Statistical analysis
Patient demographic and clinical characteristics were compared between the two treatment groups. Linear regression analysis was used to compare patient age, gland size, and pre-treatment prostate-specific antigen (PSA) by implant interval status. Chi-square analysis was applied to compare patients based on T-stage, PSA group, Gleason group, and NCCN risk group. Patient-reported health-related QOL and physician-graded toxicities were compared between the two groups using two sample t-tests and generalized linear mixed effects models. Effects were deemed statistically significant with a p < 0.05. If a statistically significant difference was found at any time point between the two groups, an additional evaluation was done to see whether the numerical difference in the assessment leads to a MCID as described above.
Results
One hundred and twenty-two patients were included in the study. The median follow-up was 18 months (range, 1-43 months). The one-week cohort consisted of 63 patients, who were treated with a median of 7 days between implants (range, 5-9). The two-week cohort consisted of 59 patients, who were treated with a median of 14 days between implants (range, 12-28). At baseline, the two-week cohort had a higher mean PSA than the one-week cohort (8.02 vs. 6.46, p = 0.004) and had a higher rate of patients with PSA of 10-20 (34% vs. 13%, p = 0.04). There were no other differences in the baseline demographic or oncologic variables between the two cohorts. The demographic and oncologic specifics of the treated population and the two treatment cohorts are outlined in Table 1.
Table 1
Patient baseline demographic and oncologic specifics
Patient-reported GU QOL
For the treated population, there was a significant increase in IPSS with reciprocal decline in EPIC-26 urinary incontinence and EPIC-26 urinary obstruction QOL scores from baseline over time. These GU QOL scores displayed a gradual return towards baseline over time. The increase in IPSS at the initial, 1-month assessment constituted a moderate MCID. The increases in IPSS at the 3- and 6-month assessments met the criteria for slight MCID. The increase in IPSS above baseline at the 12-, 18-, and 24-month assessments did not meet criteria for a MCID. The decrease in EPIC-26 urinary incontinence scores at the 1-, 3-, 12-, and 18-month assessments were found to be MCID, while the differences at the 6- and 24-month assessments did not meet MCID criteria. EPIC-26 urinary obstruction scores at the 1- and 3-month assessments both met MCID criteria. The changes in the patient-reported GU QOL over time for the whole treated population are shown in Table 2 and Figure 1.
Table 2
Whole cohort of patient-reported QOL outcomes compared to baseline
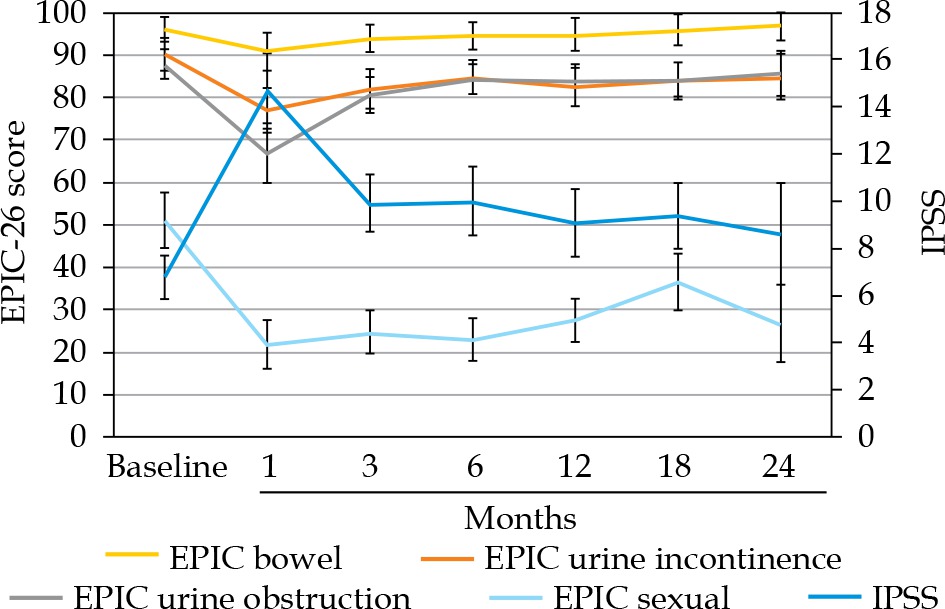
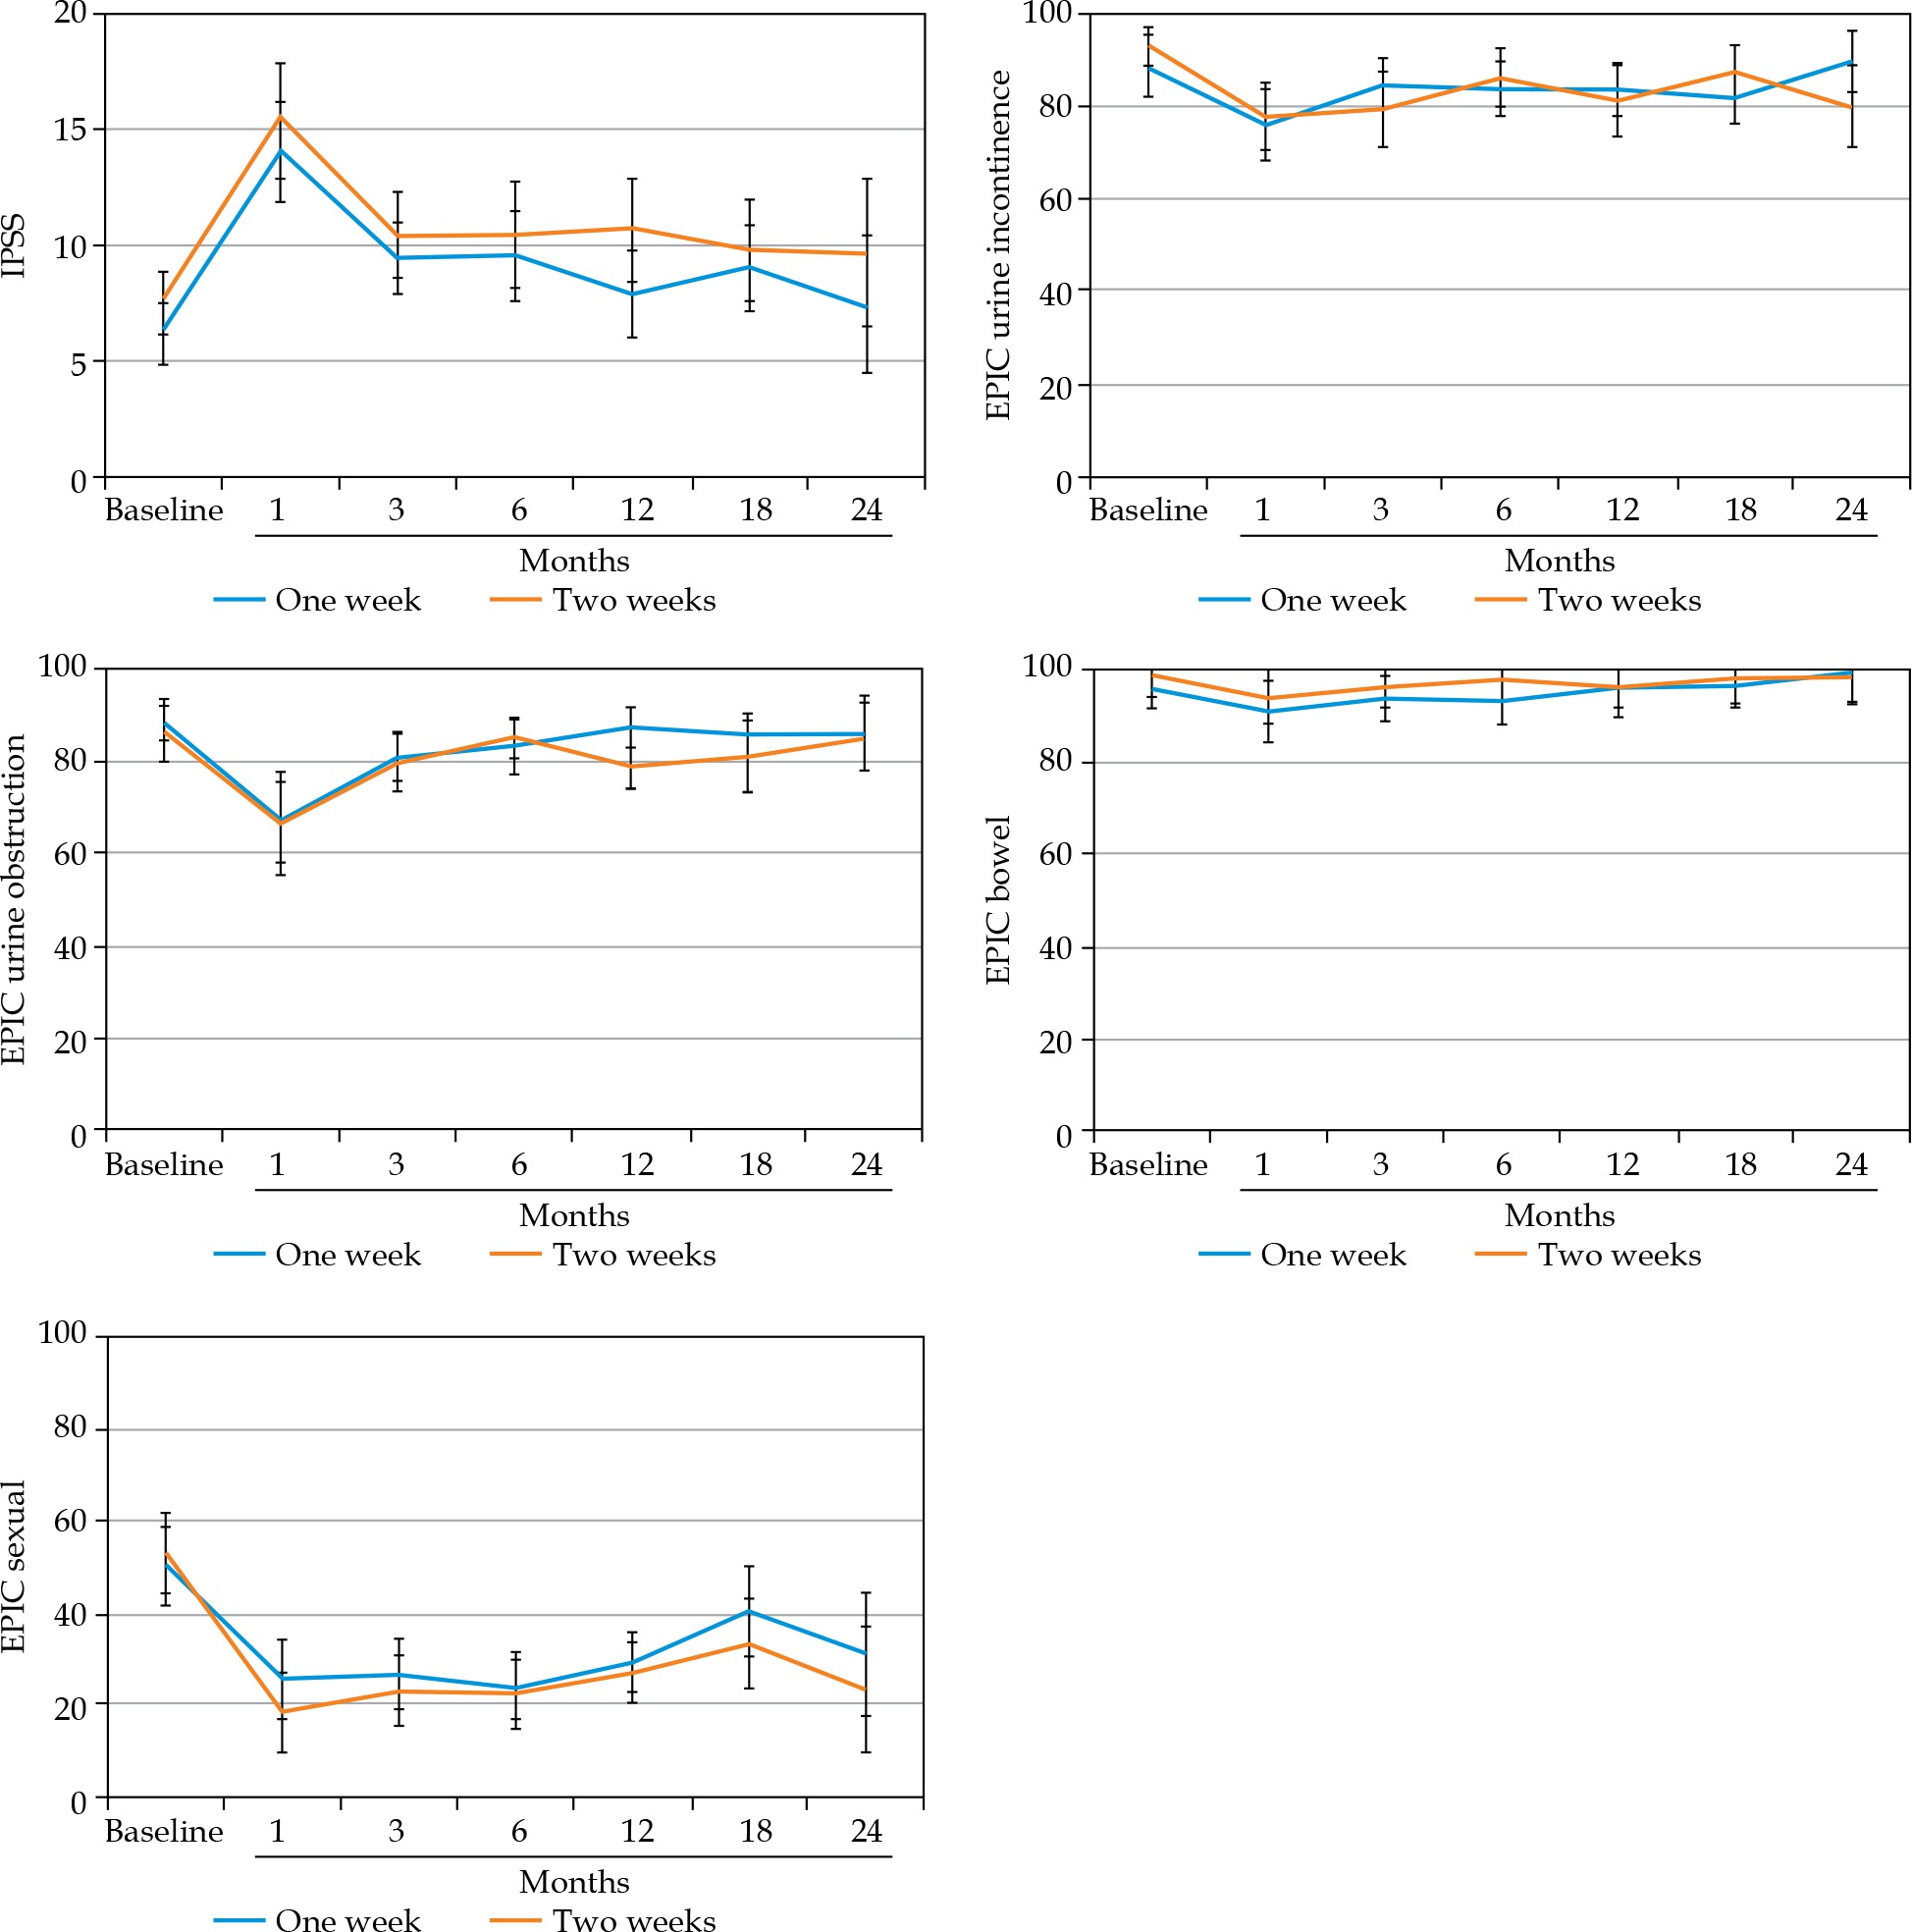
There were no differences in mean baseline IPSS, EPIC-26 urinary incontinence QOL, or EPIC-26 urinary obstruction QOL scores between the one-week and two-week cohorts. Over time, there were no significant differences in IPSS (p = 0.121), EPIC-26 urinary incontinence scores (p = 0.732), or EPIC-26 urinary obstruction scores (p = 0.963) between the one-week and two-week cohorts. There were no differences in mean IPSS or EPIC-26 urinary incontinence scores at any individual follow-up assessments. At the 12-month follow-up visit, the mean EPIC-26 urinary obstruction QOL score in the two-week cohort was lower as compared with the one-week cohort, with the difference meeting MCID criteria (78.9 vs. 87.5, p = 0.04). This difference was eliminated at subsequent evaluations. The comparison in patient-reported GU toxicities between the two cohorts are presented in Table 3 and Figure 2A-C.
Table 3
Comparison of patient-reported QOL over time between one-week and two-week cohorts
Patient-reported GI QOL
For the treated population, there was a significant decrease in the EPIC-26 bowel QOL scores at the 1- and 3-month follow-up assessments, as compared with baseline. Only the decrease seen at the 1-month assessment met criteria for MCID. Over time, the EPIC-26 bowel QOL scores returned to baseline. The EPIC-26 bowel scores for the whole cohort are shown in Table 2 and Figure 1.
There was no difference in mean baseline EPIC-26 bowel QOL scores between the one-week cohort and the two-week cohort. There was no difference over time between the one-week and two-week cohorts (p = 0.256) or at any individual follow-up assessments. The comparison in EPIC-26 bowel QOL scores between the two cohorts are outlined in Table 3 and Figure 2D.
Patient-reported sexual QOL
For the treated population, there was a significant decrease in the EPIC-26 sexual QOL score at all follow-up assessments, as compared to baseline. All the decreases in EPIC-26 sexual QOL scores met criteria for MCID. Over time, the EPIC-26 sexual QOL scores remained lower than baseline, without a trend back towards baseline. The EPIC-26 sexual QOL scores for the treated population are shown in Table 2 and Figure 1.
There was no difference in mean baseline EPIC-26 sexual QOL scores between the one-week cohort and the two-week cohort. There was no difference over time between the one-week and two-week cohorts (p = 0.34) or at any individual follow-up assessments. The comparison in EPIC-26 sexual QOL scores between the two cohorts are outlined in Table 3 and Figure 2E.
Physician-graded toxicity and acute urinary retention
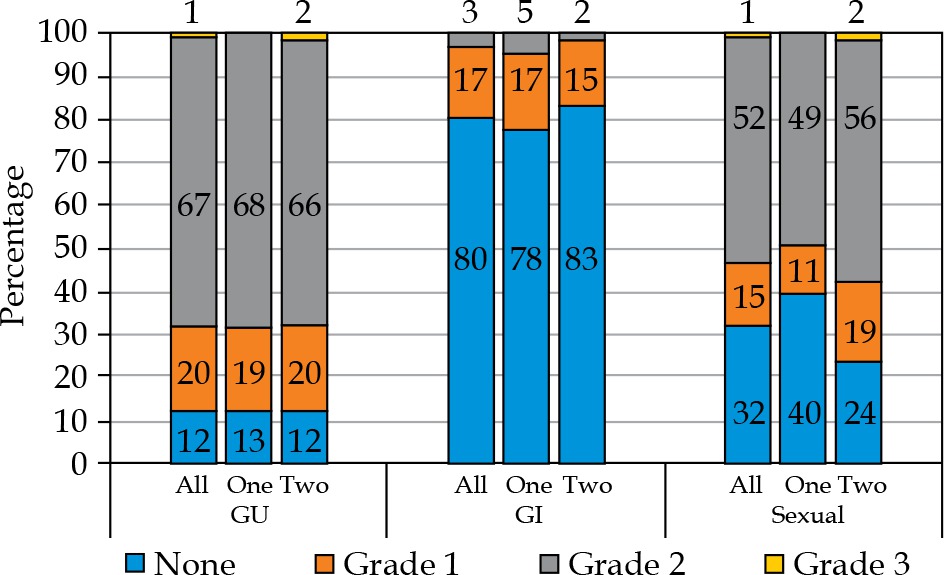
The overall and comparative rates of the maximum physician-graded toxicity are presented in Figure 3. The overall rate of grade 2 GU, GI, and sexual physician-graded toxicity was 67%, 3%, and 52%, respectively. There was a single incident of grade 3 GU toxicity and a single incident of grade 3 sexual toxicity. There were no reported grade 3 GI toxicities, and no grade 4 or 5 to-xicities were observed. There was no difference in the rates of GU (p = 0.586), GI (p = 0.769), or sexual (p = 0.177) physician-graded toxicities between the one-week and two-week cohorts. There were six total incidents of acute urinary retention, for a rate of 5%. Five of the six cases occurred in the one-week cohort; however, this difference was not statistically significant (p = 0.111).
Discussion
We performed a retrospective cohort study of patients with low- and intermediate-risk prostate cancer, undergoing definitive HDR prostate brachytherapy with 27 Gy in two fractions. We aimed to compare patient-reported health-related QOL and physician-graded toxicity as a function of time interval between implants. Patients were dichotomized into one-week and two-week cohorts. We found no differences in patient-reported health-related QOL scores or in physician-graded toxicity rates between the one-week and two-week cohorts. This suggests that clinicians should not be concerned about toxicity when planning implant dates using a two-implant regimen.
HDR brachytherapy is a well-studied and widely used method of treating localized prostate cancer. The influence of timing of treatments on prostate cancer outcomes and treatment-related toxicity are of significant interest to brachytherapists. Prostate carcinomas have a relatively low α/β ratio and are therefore more sensitive to large doses per fraction [19,20]. This makes hypofractionated HDR brachytherapy a great choice for prostate cancer treatment. The interval between high-dose per fraction treatments can also affect the balance between oncologic outcomes and treatment-related toxicity. Longer overall treatment time has been associated with poor oncologic outcomes, likely due to tumor repopulation and proliferation of radioresistant tumor clonogens [21,22,23,24]. However, excessively short treatment duration is associated with increased toxicity, likely due to inadequate recovery of normal tissue [25,26].
Various hypofractionated regimens have been compared to evaluate the balance between oncologic outcomes and treatment-related toxicity [4,5,6,7,8]. One of the most studied regimens include 27 Gy in two 13.5 Gy fractions, given in two implants, as outlined in the current NCCN guidelines [10]. Many studies have outlined their institutional patient-reported QOL and physician-graded toxicity results utilizing this treatment regimen. In a series similar to our dataset, Gaudet et al. reported on their single institutional results of treating thirty low- or intermediate-risk prostate cancer patients with 27 Gy over two implants, separated by 7-14 days [27]. They collected patient-reported health-related QOL results utilizing the IPSS and EPIC questionnaires and found 57% of patients treated experienced moderate to severe urinary symptoms at the one-month assessment after implantation, with a rapid recovery towards baseline over time. In contrast, GI symptoms did not change from baseline, while sexual symptoms decreased after implantation, and failed to return to baseline.
Morton et al. reported their results of patients undergoing HDR brachytherapy treatment with 19 Gy in a single fraction or 27 Gy over two fractions, given over two implants. Patients that received the two-implant treatment course received their second implant one week after the first implant. They noted that over the first year, a significant decrease was observed in the mean EPIC urinary and sexual QOL scores over time, with no significant change in the bowel or hormonal QOL scores. For their physician-graded toxicity, they reported that grade 2 urinary toxicity occurred in 51% of patients within the first 3 months and in 31% thereafter. Ten patients (6%) developed urinary retention, and less than 1% had any grade 2 GI toxicity [8]. Jawad et al. reported on physician-graded toxicities in treating men with one of three HDR regimens: 38 Gy in 4 fractions, 24 Gy in 2 fractions, or 27 Gy in 2 fractions. Patients who received the two-implant course received their second implant two weeks after the first. They reported grade 1 and 2 dysuria rates of 23% and 6%, and 16% and 7% of grade 1 and 2 urinary retention, with very low rates of acute GI toxicity [7].
Our results reflect the above experiences, with similar rates of patient-reported health-related QOL scores and physician-graded toxicities. Patients reported comparable rates of decline in GU, GI, and sexual QOL after treatment. The patient-reported GU and GI QOL scores worsened immediately after treatment, with a return towards baseline over time. However, the patient-reported sexual QOL dropped after treatment and did not trend towards a return to baseline. Our data shows maximum physician-graded toxicity rates of 20%, 67%, and 1% of grade 1, 2, and 3 GU toxicities, respectively. This is likely due in part to our prophylactic use of tamsulosin. Patients, who continued tamsulosin after the implant out of preference were technically grade 2 based on CTCAE v5.0 criteria. The GI and sexual toxicity were substantially lower with 16% and 3% of grade 1 and grade 2 bowel toxicity, with no grade 3 events, and 15%, 52%, and 1% of grade 1, 2, and 3 sexual toxicity, respectively. Importantly, our results showed that there was no significant difference in any patient-reported health-related QOL or physician-graded toxicity as a function of time between the patients’ first and second treatment. The only statistically significant difference occurred in the EPIC-26 urinary obstruction score at 12 months. This difference was considered as a statistical anomaly, and bears no clinical significance, as the difference was eliminated in all subsequent patient-reported evaluations.
To the authors’ knowledge, there are no other studies that explored the relationship between brachytherapy implant interval and outcomes. Our study showed that implant interval did not influence treatment-related toxicity. The next steps in this research is to assess the oncologic outcomes as a function of implant interval. At the time of this study, our data was too immature to perform biochemical control or overall survival analyses. However, Soatti et al. has shown excellent biochemical control and overall survival in a similar population treated with HDR brachytherapy as monotherapy for prostate cancer [28,29]. We plan to calculate these clinical endpoints from our data after longer follow-up.
This study has inherent limitations due to the retrospective study design and its single institution nature. Thus, the risk of selection bias exists. Additionally, unique aspects of our patients’ population and treatment delivery may confound the relationship between implant interval and outcomes.
Conclusions
Our study supports the current body of literature showing that HDR brachytherapy consisting of two implants is a well-tolerated treatment for men with localized prostate cancer. It also indicates that there is no significant difference in the rates of patient-reported health-related QOL or physician-graded toxicity in patients as a function of time between each treatment.


