
Purpose
External beam radiotherapy (EBRT) combined with brachytherapy (BT) is the standard mode of radical radiotherapy for locally advanced cervical cancer, and is recommended by the NCCN guidelines for cervical cancer [1]. Because of the significant tumor shrinkage during BT [2,3,4] and the large interfraction variance in organs at risk (OARs) [5,6,7], image-guided adaptive BT is the recommended treatment modality [8,9]. Several studies have shown that high-risk clinical target volume (HR-CTV) D90 (dose to 90% of target volume) and intermediate-risk clinical target volume (IR-CTV) D90 have a significant correlation with the treatment outcome in BT of cervical cancer [10,11,12,13]. Similarly, for OARs, the dose-volume histogram (DVH) parameters, especially the minimum doses to the most irradiated 2 cm3 portions (D2cc), are also associated with the probability of late side effects [14]. In most treatment planning systems, doses can be shown only in the form of physical doses and cannot be directly converted into equivalent doses in 2 Gy per fraction (EQD2). Oncentra (Nucletron BV, an Elekta company, The Netherlands) treatment planning system provides a tool named “preset DVH table”, which uses a table to display the presented DVH parameters. However, these parameters are displayed in physical dose, not bioequivalent dose. They cannot be copied due to the permission restrictions of treatment planning system. Although, an Excel forms for automatically calculating EQD2 can be easily compiled or obtained, DVH parameters need to be stored one by one, which consumes manpower and increases treatment planning time. Furthermore, in the first BT fractions, it is difficult to balance the cumulative doses of targets and OARs due to unavailability of the doses of both the targets and OARs in the subsequent BT. The purpose of this study was to introduce a home-made application for fast input of DVH parameters and to explore the predictive value of Excel forms based on automatic calculation of EQD2 in adaptive BT for cervical cancer.
Material and methods
Patient population and treatment
Between April 2016 and June 2018, a total of 163 patients with biopsy-confirmed locally advanced cervical cancer received EBRT and computed tomography (CT)- or magnetic resonance imaging (MRI)-based adaptive BT. Of these, 44 patients were excluded for the following reasons: incomplete information (n = 3), recurrent tumors (n = 24), previous BT (n = 13), or incomplete treatment (n = 4). A total of 119 patients (median age, 53 years; range, 30-79 years) were retrospectively analyzed in the study. Patients and treatments characteristics are shown in Table 1.
EBRT and BT procedure
For EBRT, the median fraction dose was 1.8 Gy (range, 1.8-2.0 Gy), and the median total dose was 45 Gy (range, 42-50.4 Gy). For high-dose-rate (HDR) BT, the nominal prescribed dose was 28 Gy in 4 fractions, separated by one week. Utrecht interstitial Fletcher CT/MR applicator, interstitial ring CT/MR applicator, multichannel cylinder applicator, and 3D-printed template were selected to fit the morphology and topography of the tumor [15,16,17]. MicroSelectron (v.3, Nucletron, Veenendaal, The Netherlands) HDR afterloading system was used for the patients’ treatment. Oncentra (v.4.3, Nucletron, Veenendaal, The Netherlands) treatment planning system was applied to produce and optimize the treatment plan. The total dose for combined EBRT and BT was normalized to EQD2 using α/β = 10 Gy for tumor tissue and α/β = 3 Gy for normal tissue. The planning aims dose (soft constraints) and limits dose (hard constraints) together constituted two levels for dose constraint. The planning aim dose (total EBRT and BT) for HR-CTV and IR-CTV was D90 ≥ 85 GyEQD2,10 and 65 GyEQD2,10, respectively, whereas planning aim dose for OARs was D2cc < 70 GyEQD2,3 for rectum, sigmoid, and bowel and < 85 GyEQD2,3 for bladder. The limit dose for HR-CTV and IR-CTV was D90 ≥ 80 GyEQD2,10 and 60 GyEQD2,10, respectively, whereas limit dose for OARs was D2cc < 75 GyEQD2,3 for rectum, sigmoid, and bowel and < 90 GyEQD2,3 for bladder.
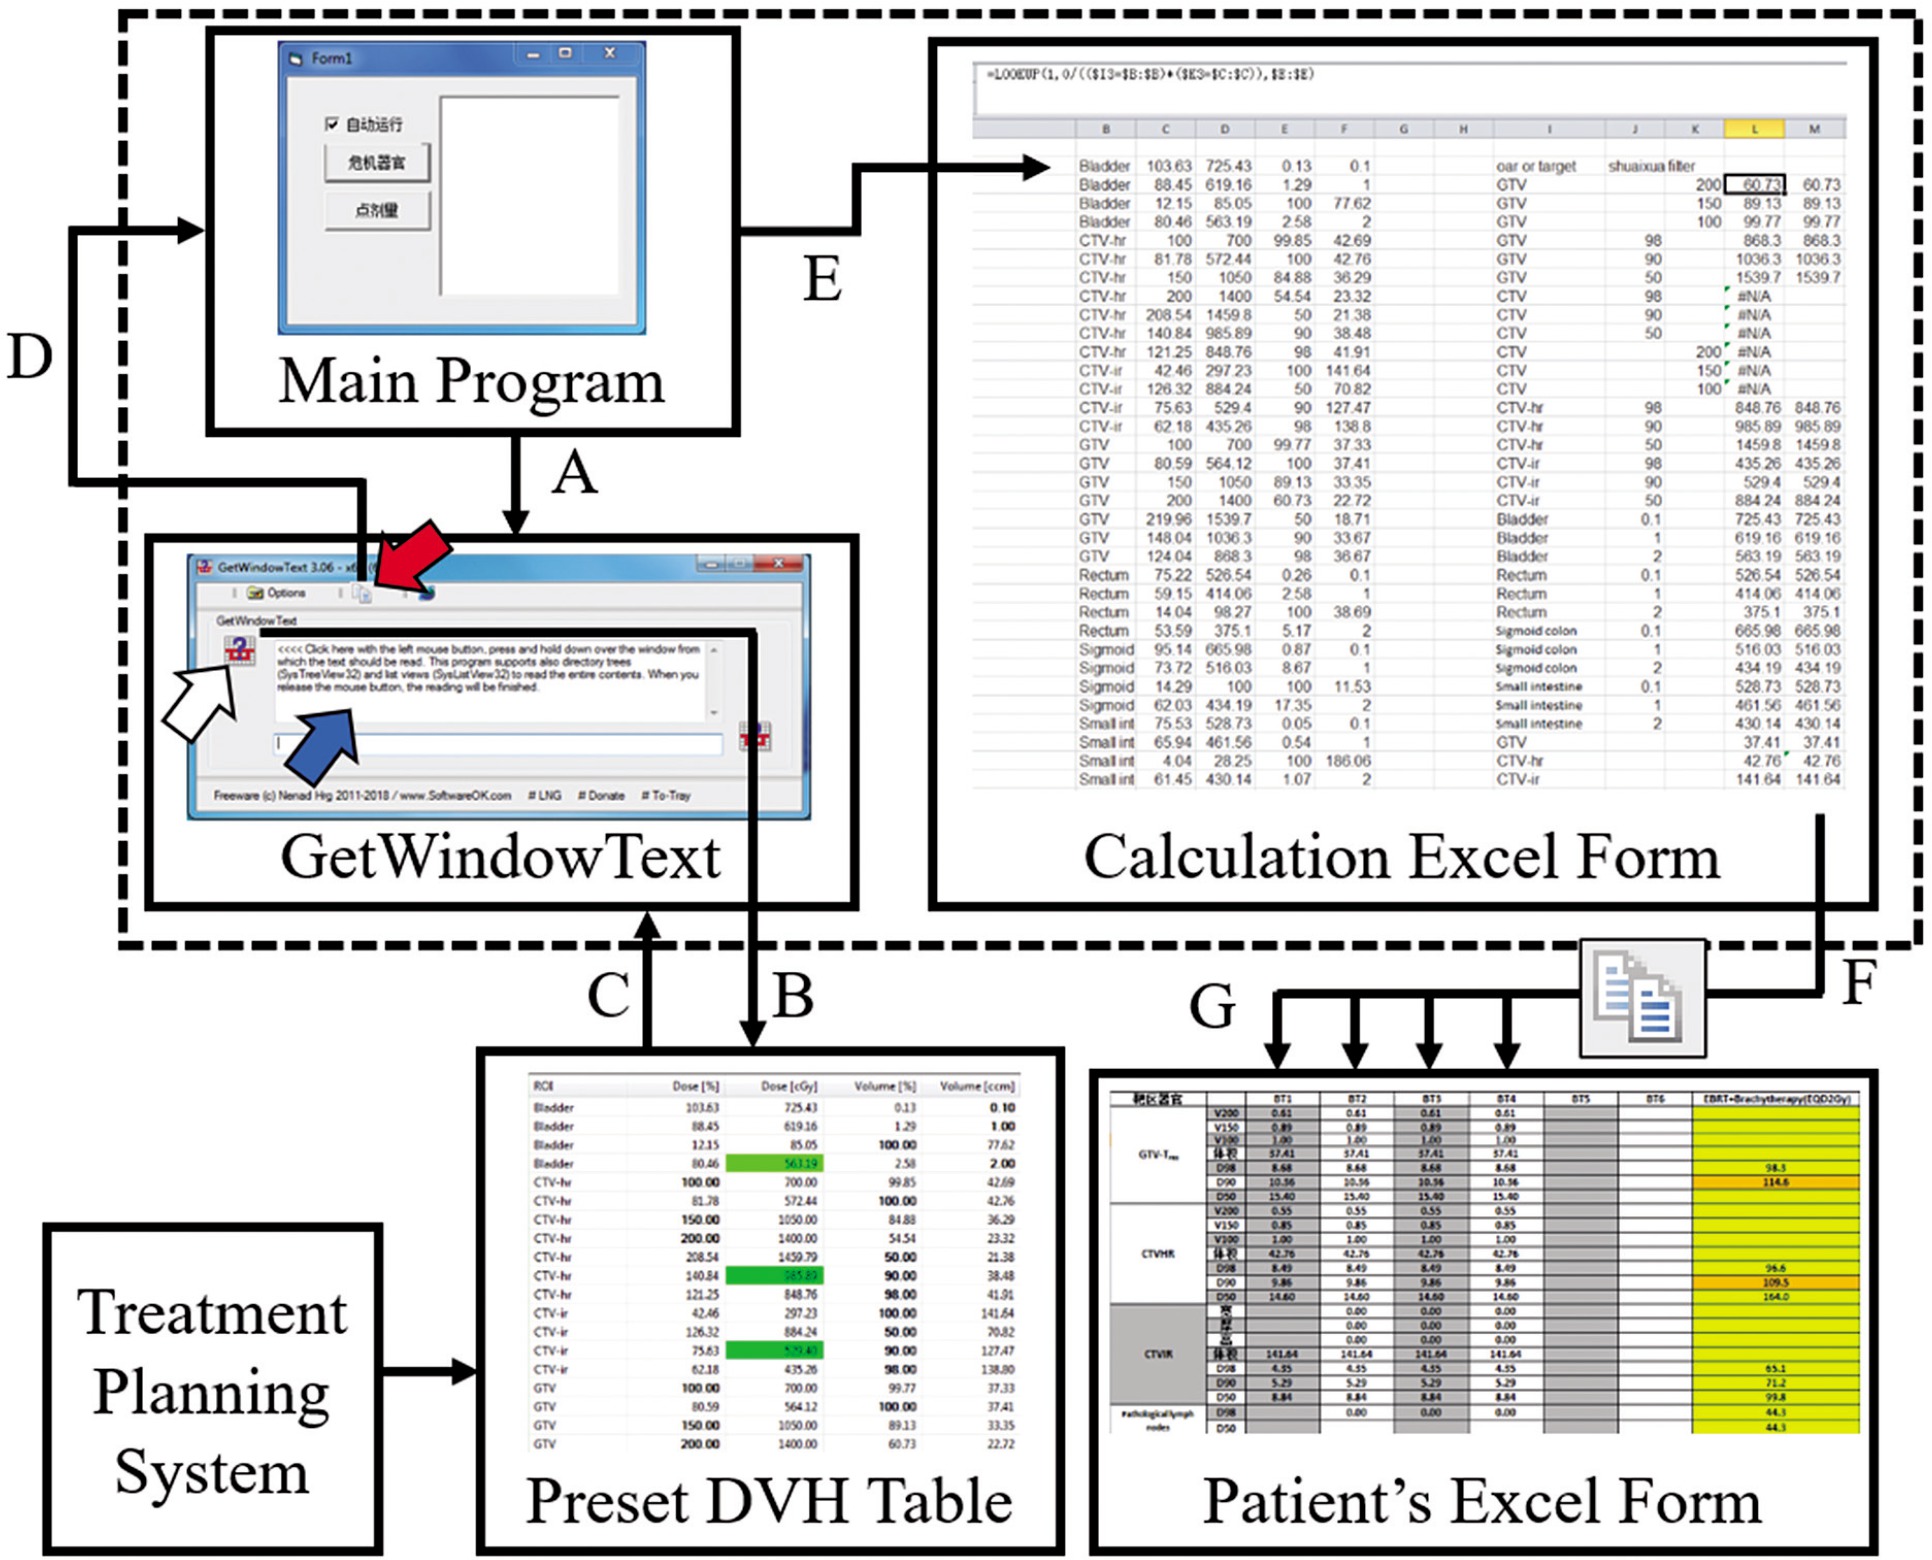
In order to evaluate the treatment plan and balance the doses between targets and OARs, we compiled an Excel form for each patient, called “patient’s Excel form”. When a DVH parameter is entered, it automatically calculates and accumulates EQD2 from EBRT and BT. To quickly obtain the relevant DVH parameters from the treatment planning system and complete the patient’s Excel form, we created an in-house designed application, which was composed of three files. The main program was compiled by Visual Basic (version 6.0, Microsoft, USA). Another file was GetWindowText.exe (version 3.06, Freeware), free for downloading from the Internet. The third file was an Excel form (named “calculation Excel form”) called by the main program, which runs in the background to avoid confusion with the patient’s Excel form. It uses an Excel function (LOOKUP) to automatically search the data required by the patient’s Excel form, such as HR-CTV D90, IR-CTV D90, D2cc for OARs, and other DVH parameters of interest. Data flow of this in-house designed application is shown in Figure 1.
Fig. 1
Data flow of the in-house designed application (three files in the dotted box are in-house designed application). A) The main program opens the GetWindowText.exe program, B) click and drag the icon (white arrow) in the GetWindowText program to the preset DVH table in Oncentra treatment planning system, C) the text in preset DVH table is automatically loaded and displayed in the text box (blue arrow) of the GetWindowText.exe program, D) click the clipboard icon (red arrow) of the GetWindowText program, reads text in memory to the Clipboard, E) the main program automatically stores the contents of the clipboard in columns B to F of the calculation Excel form, F) the calculation Excel form automatically looks for the corresponding DVH parameters and stores them in the clipboard, G) paste the DVH parameter in the clipboard into the corresponding fraction of the patient’s Excel form
In the first n fractions (n = 1-3), to predict the total EQD2 at the nth BT (TEPBn), we assumed that the dose of subsequent fraction(s) would be the same as that of current nth fraction and dose, until the previous fraction was summed up. The actual cumulative EQD2 (ACEQD2) was obtained at the fourth BT. For each BT, the fraction dose was controlled with TEPBn or ACEQD2 from the Excel form based on the automatic calculation of EQD2. There were two ways to address the contradiction between target dose and dose to OARs: to meet the dose requirements of target volumes and increase the dose constraints of OARs, or to meet the dose constraints of OARs and lower the dose to the target, leading to an insufficient dose. The choice or compromise depends on whether the target dose can be increased or the dose to OARs can be decreased in the subsequent fraction(s). It is an effective way to increase the target dose and/or decrease the dose to OAR by adjusting the type of applicator or increasing the number of interstitial needles. For patients with high-risk factors, the target doses should be increased under the premise of a controllable dose to OARs to achieve better clinical outcomes.
All the patients in this retrospective analysis read and wrote DVH parameters to patients’ Excel forms with the in-house designed application. TEPBn was used to predict ACEQD2, to balance the doses between targets and OARs, and to decide whether to increase the number of implantation needles or change the applicator. The data in this retrospective analysis were all from the actual delivered plan without any changes.
Statistical analysis
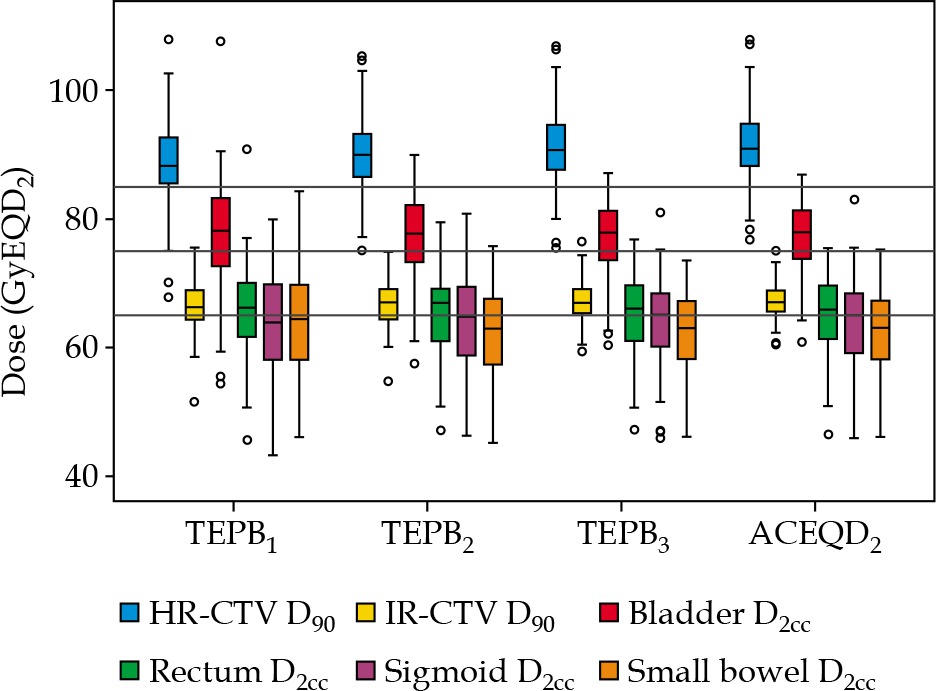
Receiver operating characteristic (ROC) curves were created to choose the optimal cut-off dose for predicting whether ACEQD2 met the planning aim dose. Boxplots of TEPBn and ACEQD2 (Figures 2-4) were generated using SPSS (version 23.0, IBM, USA) software. The volumes of HR-CTV and IR-CTV were compared between any two adjacent fractions, using two-tailed paired t-test. A p-value ≤ 0.05 was considered statistically significant.
Results
Interfractional target volume variations
The volume of HR-CTV decreased gradually during four BTs: 46.3 ±36.8 cc, 41.8 ±28.3 cc, 39.5 ±24.7 cc, and 38.3 ±26.1 cc. There was a significant decrease between BT1 and BT2, with a p-value of 0.016. Similarly, the volume of IR-CTV also decreased gradually: 126.2 ±67.4 cc, 120.1 ±53.1 cc, 112.8 ±46.4 cc, and 112.4 ±48.5 cc. There was a significant decrease between BT2 and BT3, with a p-value of 0.001.
Prediction accuracy of TEPBn
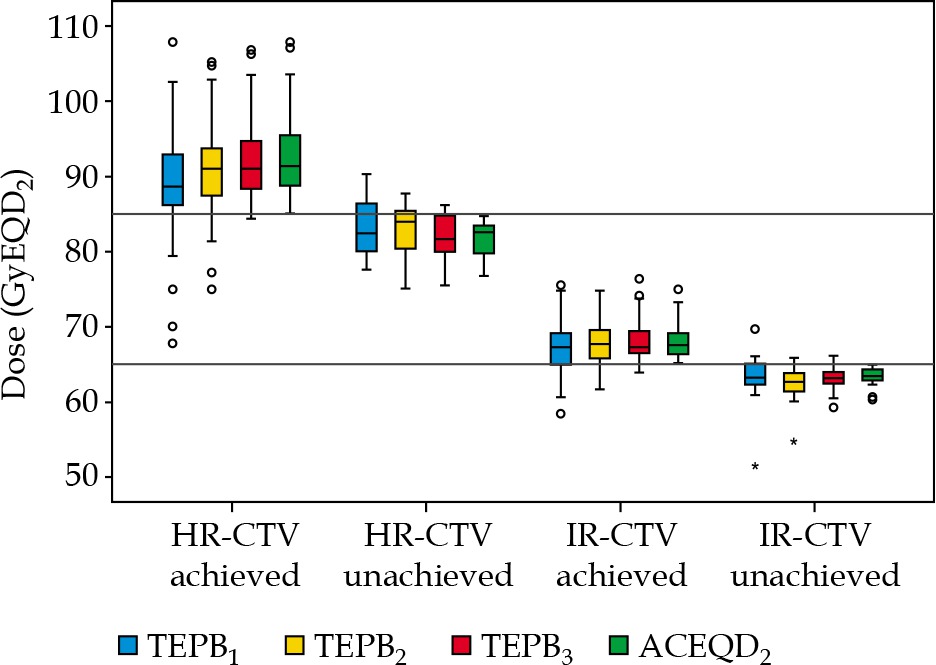
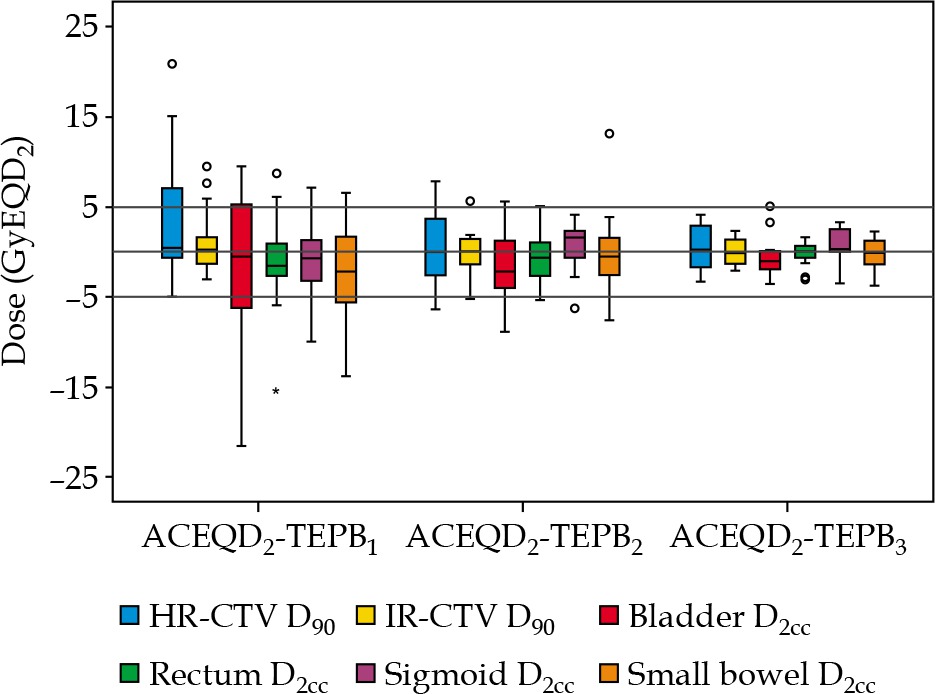
Boxplots of TEPBn and ACEQD2 are shown in Figure 2. For the ACEQD2 of HR-CTV D90, 109 patients (91.6%) achieved the planning aim dose, and for the ACEQD2 of IR-CTV D90, 98 patients (82.4%) achieved the planning aim dose. The boxplots of TEPBn and ACEQD2 for patients in whom the ACEQD2 of HR-CTV D90 or IR-CTV D90 achieved and did not achieve the planning aim dose are shown in Figure 3. The choice of applicator type depends on the individual anatomy and tumor spread at the time of BT. However, there are many difficulties in the selection of applicators, which need to be changed between fractions. If the applicator in the previous BT session is not optimal, a different applicator has to be used in the subsequent fraction(s). For example, instead of ring applicator, Utrecht applicator can be used or vice versa. Of the 119 patients, the applicator was changed in 38 (31.9%) cases: the applicator was changed after the first BT in 25 patients, after the second BT in 16 patients, and after the third BT in 14 patients. Distribution of changes in applicator with patients’ numbers is shown in Table 2. For the patients in whom different applicators were used, the boxplots of dose increase caused by changing the applicator are shown in Figure 4. The cut-off value was set to the planning aim dose, and the result of TEPBn in predicting whether ACEQD2 achieves the planning aim dose is shown in Table 3. To obtain the accuracy and optimal cut-off (see Table 4) of TEPBn prediction, we analyzed the ROC curve of each parameter.
Table 2
Distribution of change in applicator
Table 3
Patient distribution was used to determine whether TEPBn predicts and ACEQD2 achieves the planning aim dose according to cut-off (planning aim dose)
[i] D90 – dose to 90% of the target volume, D2cc – minimal dose to the most irradiated 2 cc of an OAR, TEPBn – total EQD2 prediction at nth BT, TP – true positive (both TEPBn and ACEQD achieved the planning aim), FP – false positive (TEPBn achieved the planning aim, but ACEQD did not), FN – false negative (TEPBn did not achieve the planning aim, but ACEQD did), TN – true negative (neither TEPBn nor ACEQD
Table 4
The area under curve value and the optimal cut-off of receiver operating characteristic curves for parameters
Discussion
Radical radiotherapy for locally advanced cervical cancer includes EBRT followed by BT. Because of the implantation of applicator in BT, the patient positioning for EBRT is different from that for BT, especially the changes in tumors and OARs around the applicator. During BT, the changes in tumor and OARs are also significant. In order to accurately identify the most exposed volume of OARs in BT, manually contour on EBRT CT images is a suitable method, but it is very inconvenient and difficult [18]. It is difficult to track and accumulate the doses of EBRT and BT using rigid registration. Even if deformable registration is used, it is limited to BT different fractions. Currently, there is a lack of straightforward metrics to evaluate deformable image registration errors between EBRT and BT [19,20,21]. In this study, EQD2 was directly mathematically accumulated, which is a general method recommended by the GEC-ESTRO, and a conservative superposition method for evaluating OARs [22]. Although this method based on assumption of static hotspot is a little different from the actual absorbed dose, it has been widely used [23,24].
In our study, the volumes of HR-CTV and IR-CTV for the four fractions gradually decreased. The results are consistent with those of other studies [2,7]. This is also one of the important bases for the recommendation of adaptive BT for cervical cancer. Even a small reduction in the target volume can help the target to receive a higher dose due to high-dose gradient in BT. Therefore, if the target dose in previous fraction is slightly insufficient, there is no need for serious concerns. Even if there are no changes in the applicator, a higher dose is expected since the target is closer to the high absorbed dose region.
According to current studies, HR-CTV D90 and IR-CTV D90 are highly correlated with probability of local control of cervical cancer. Dimopoulos et al. reported that to achieve 90% of local control probability, HR-CTV D90 and IR-CTV D90 were 86 GyEQD2,10 and 71 GyEQD2,10, respectively [11]. Mazeron et al. reported that the thresholds to achieve 90% of local control probability were 85 GyEQD2,10 to HR-CTV D90 and 75 GyEQD2,10 to IR-CTV D90 [10]. A meta-analysis by Mazeron et al. showed that HR-CTV D90 warranting 90% of local control probability was 81.4 GyEQD2,10 and for IR-CTV D90, the dose of 60 GyEQD2,10 was associated with 79.4% of local control probability [12]. Recently, an updated meta-analysis encompassing 2,893 patients demonstrated that a tumor control probability of > 90% can be expected at doses > 84 GyEQD2,10 and 69 GyEQD2,10 for HR-CTV D90 and IR-CTV D90, respectively [13]. The doses of D2cc in OARs were also highly correlated with side effects [14]. Based on significant dose-effect relationship, the planning aims dose and the limits of the prescribed doses were obtained by referring to other studies [25,26].
In general, the area under the curve (AUC) was between 0 and 1. The closer the AUC to 1, the more accurate the prediction. A comprehensive judgment based on the AUC can avoid the bias caused by only considering the sensitivity or specificity. From our results, TEPBn exhibited high accuracy in predicting whether ACEQD2 meets the planning aim dose. Among the six predictive parameters for TEPB1, there was one (16.7%) parameter, for which the AUC value of ROC curve was greater than 0.9, whereas for TEPB2 and TEPB3, there were four (66.7%) and six (100%), respectively. As shown in Table 3, the range of false negative cases was 1-25 (0.8-21.0%), which indicates that in some patients in previous fractions of predictive dose, the planning aim dose was not achieved, but ACEQD2 reached the planning aim dose. This result is due to our positive adjustment, when TEPBn did not achieve the planning aim dose, including changed applicator [27], interstitial needles’ optimization [15,28,29,30], or/and optimized bladder volume [31,32]. We also found that the false negative values gradually decreased with BT, from 10-25 (8.4-21.0%) of TEPB1 to 1-7 (0.8-5.9%) of TEPB2 and to 1-5 (0.8-4.2%) of TEPB3. These findings show that in the operation of dosage adjustment, we must be early and accurate. If TEPB3 does not achieve the planning aim dose, the probability of ACEQD2 achieving the planning aim dose is very low.
Usually, if there is no change in the applicator type, tandem length, ovoid/ring size, etc., the dose parameters between interfraction maintain a high consistency, unless there is a significant change in the tumor size or organ filling. In other words, the sensitivity, specificity, and prediction accuracy of TEPBn would be very high. In this study, about 68% of the patients used the same applicator in all fractions. This determined that TEPBn had high accuracy in predicting ACEQD2.
In addition, we found that the AUC value of ROC curve for small intestine D2cc was lesser than that of other parameters. This result is due to a high interfraction variation in tumors and OARs in BT, especially in the small intestine, which has higher internal motion than other OARs. Moreover, the dose balance between the bladder and small intestine can be adjusted by bladder filling, due to adjacent relationship between the bladder and small intestine. Study from Mahantshetty et al. [31] demonstrated that the higher bladder volume, the lesser dose to small intestine, whereas bladder filling had no significant impact on the dose to bladder, rectum, and sigmoid. Study from Yamashita et al. [32] confirmed that bladder filling preferentially protects the small bowel. This is one of the reasons why we used bladder filling as a control method for patients with high-dose to smaThe application of this in-house designed application only takes less than 10 seconds, four times mouse click, to obtain TEPBn or ACEQD2. In the absence of such an application, DVH parameters need to be typed in the patient’s Excel form one by one. Each dose evaluation takes about five to ten minutes. After any dose optimization, DVH parameters need to be retyped again one after the other, which takes another five to ten minutes. Generally, a clinical actually delivered plan needs to be evaluated several times before its confirmation. Therefore, this application played an important role in shortening the treatment planning time. Even in the department with limited BT applications, this application would be of great value, especially for busy departments.
The in-house designed application reduces time-cost during treatment planning. Therefore, the potential displacement of the applicator and danger caused by the prolongation of treatment planning have been decreased. However, our in-house designed application has some limitations. It does not replace Excel sheet tools (we call it patient’s Excel form) used in most of departments. Moreover, this application is not yet integrated into the treatment planning system.
Conclusions
The in-house designed application has the function of quickly reading DVH parameters from the treatment planning system, which allows for a balance between the total dose to target volumes and OARs. Excel forms based on the automatic calculation of EQD2 have high predictive accuracy. In case of unsatisfactory dose in the first fraction(s), the dose distribution can be improved by changing the applicator or increasing the number of interstitial needles.


