

Introduction
The fourth leading cause of cancer deaths, gastric cancer (GC) is also the fifth most common malignancy globally [1]. It is worth noting that over 50% of cases occur in developing countries, among which China has the highest GC incidence rate [2]. The diagnosis is always made in GC patients at the advanced stage when the 5-year survival rate stands at around 20% [3, 4]. Though prolonged progression-free survival (PFS) and overall survival (OS) have been partly achieved in advanced GC patients due to chemotherapy, the median survival rate is still below 1 year [4]. Hence, GC remains a global health care issue. Prognostic prediction of GC patients can benefit both disease management and subsequent treatment. However, current disease assessments based on tumor aggressiveness, lymph node involvement, distant metastasis (TNM staging system), and histological grading are not enough to generate prediction for survival rate of GC patients. As one of the most efficient tools in prognostic prediction, novel biomarkers are needed for better predictive accuracy [5]. Biomarkers not only facilitate the evaluation of tumor progression and prediction of OS but also contribute to treatment effect enhancement. This study started with regulatory T cells (Tregs) to seek prognostic biomarkers for GC to assist the disease assessment for GC patients.
Tregs are the CD4+ and CD25+ subsets of T cells [5]. By inhibiting effector cell function or secreting immunosuppressive cytokines, Tregs inhibit anti-tumor immune responses, and are crucial in maintaining immune tolerance and reducing immune responses [6]. Previous studies have found that the number of CD4(+) CD25(+) CD127(low/–) Treg cells in different clinical stages of GC patients was significantly different, and the level of Treg cells was significantly reduced after surgical resection [7]; Ma et al. also found that the level of CD4+FoxP3+ Treg cells was different in distinct clinical stages of GC patients [8]. In addition, the link between Treg infiltration and the poor prognoses of most solid malignant tumors has been suggested in many studies. For instance, Ye et al. [9] found the infiltration of Tregs to be an independent risk factor of colorectal carcinoma. A higher infiltration rate indicates shorter OS of patients. In clear cell renal cell carcinoma, a higher proportion of Tregs is found to be related to poor prognosis as well [10]. Similarly, this study attempted to further explore the effect of Tregs on predicting GC progression and prognosis.
In recent years, advances in cancer genomics have led to a new understanding of the molecular pathogenesis of GC, and the potential markers and therapeutic targets can be explored based on the genomic characteristics of tumors. Furthermore, oncogenes and anti-cancer genes have been reported in previous studies. Ding et al. [11] demonstrated that GSE1 can promote cancer development via regulating the expression of SLC7A. UFM1 was also found to be involved in tumor regulation by inhibiting invasion and metastasis of tumor cells via negatively regulating the PI3K/AKT signaling pathway to increase ubiquitination of PDK1 in GC [12]. Although a pool of genes has been found for GC diagnosis and prognosis, the polygenic signature used to predict prognosis remains to be explored.
Biomarkers are critical factors in marking and predicting a patient’s prognosis [13]. Leucine rich repeat and fibronectin type III domain containing 4 (LRFN4) is a neuronal transmembrane protein that mainly plays a role in the human immune system. Hu et al. [14] demonstrated that the Treg-related gene LRFN4 is associated with GC prognosis. A disintegrin and metalloproteinase with thrombospondin motifs 12 (ADAMTS12) plays a role in the tumor process mainly through its proteolytic enzyme activity. Hou et al. [15] found that highly expressed ADAMTS12 is mainly enriched in cancer- and immune-related signaling pathways. Mast cell-expressed membrane protein 1 (MCEMP1) is a transmembrane protein expressed by immune-related cells such as mast cells and macrophages. The expression of MCEMP1 is related to the immune infiltration of various immune cells and can be used as a potential prognostic marker for GC [16]. Haptoglobin (HP) is a glycoprotein [17] that affects the innate immune response [18]. It has been found that HP can be used as a marker of glioblastoma [17]. Mucin-15 (MUC15) as an important member of the mucin family belongs to high molecular weight glycoprotein, and it has been demonstrated that MUC15-related genes are enriched in immune-related pathways and can be used as prognostic markers for GC [19]. Treg-related genes (LRFN4, ADAMTS12, MCEMP1, HP, MUC15) are found to be closely related to the prognosis of GC through the TCGA database [14]. The evidence suggests that these five genes exert functions in tumor immunity.
Therefore, this study attempted to explore the association between five Treg-related genes and the prognosis of GC patients. We used Tregs and their related genes to construct a risk model to explore their potential in predicting the survival status of patients with GC. This study might offer theoretical support that will help to tailor precise treatment strategies for GC patients.
Material and methods
Clinical sample collection
We collected tumor tissue and adjacent non-cancerous tissue samples from 48 GC patients diagnosed between 2016 and 2019. The collected para-carcinoma tissue and tumor tissue samples were subjected to a flow cytometry experiment. The remaining samples were immediately frozen at –80oC until being analyzed. The study was approved by the Ethics Committee of Fujian Cancer Hospital and samples were obtained with signed informed consent. The whole procedures were performed according to relevant guidelines and regulations.
Cell culture and transfection
Human GC cell lines SGC7901 and AGS were purchased from BeNa Technology (China). Cell culture was mainly according to the methods used in previous research [20]. In brief, all cell lines were kept in RPMI 1640 medium (Thermo Fisher Scientific, USA) containing 10% fetal bovine serum (FBS) and 1% penicillin-streptomycin in an incubator at 37oC with 5% CO2.
The si-ADAMTS12, oe-ADAMTS12, and negative controls si-NC and oe-NC were synthesized by GenePharma, China. After transfecting the vectors into cells using Lipofectamine 3000 (Thermo Fisher Scientific, USA) following its manual, transfected cells were cultured and then harvested for subsequent experiments.
Flow cytometry
Under sterile conditions, the tumor tissue was first placed in a pre-prepared container, with fat and connective tissues and blood removed. Then, the tissue was cut into 1 mm3 small pieces and transferred to a 10 ml centrifuge tube, and 5 times the volume of 0.25% pancreatic enzyme at 37oC was added for digestion. Digestion was terminated 30 min later, and the tissue masses that were not completely digested were removed. Then the above solution was centrifuged at 1500 r/min for 5 min, and the supernatant was discarded. Finally, the tumor cell suspension was obtained after rinsing and suspension with phosphate-buffered saline (PBS). The cell suspension was incubated with anti-FITC-CD4 (300505, BioLegend, USA) and anti-APC-CD25 (302609, BioLegend, USA) at 4oC in the dark for 45 min. After that, we used the Cell Fixation and Permeation Kit (eBioscience, USA) following the instructions to perform intracellular staining. Analysis was then conducted with a BD FACSAria Fusion flow cytometer (BD Biosciences, USA).
Quantitative real-time polymerase chain reaction
We followed the experimental procedures described by Han et al. [21] in performing quantitative real-time polymerase chain reaction (qRT-PCR) assays. The specific ope- ration was conducted as follows: TRIzol reagent (Thermo Fisher Scientific, USA) was used for the extraction of total RNA, whose concentration was then determined using a NanoDrop ND-1000 instrument (NanoDrop, USA). The mRNA was reverse-transcribed into cDNA using the specific primer (Ribobio, China) and prime script RT kit (Takara, Japan) as per the manufacturer’s instructions. Next, the SYBR Premix Ex Taq II kit (Takara, Japan) was used for quantification of mRNA expression. Finally, q-PCR was performed on an ABI Prism 7500 rapid real- time PCR system (Applied Biosystems, USA). GAPDH was used as the internal reference. The 2-ΔΔCt method was adopted for gene expression quantification. Primer sequences used in PCR are detailed in Table 1.
Table 1
Primers for qRT-PCR
3-(4,5-Dimethylthiazol-2-yl)-2,5-diphenyltetrazolium bromide
Cells of the exponential growth phase were trypsinized, followed by seeding into 96-well plates (2000 cells/well). After adding 20 µl of 3-(4,5-Dimethylthiazol-2-yl)-2,5-diphenyltetrazolium bromide (MTT) solution (5 mg/ml, GenView, USA) at 24, 48, 72, and 96 h, cells were incubated for another 4 h and then treated with 100 µl of DMSO solution. Cell survival was calculated by measuring optical density (OD) at 490 nm with a microplate reader (Tecan, Switzerland).
Colony formation assay
After cell digestion and adjusting the density of transfected GC cells to 400 cells/ml, 2 ml of cell suspension was seeded into 6-well plates and maintained for 10 days to form colonies, with medium replaced every 3 days. Subsequently, cells were subjected to fixation with 4% paraformaldehyde and 5 min of crystal violet (Sigma, USA) staining. With images projected with a fluorescence microscope (Olympus, Japan), the count of colonies (> 50 cells/colony) was recorded.
Transwell migration assays
The cell migration assays were conducted by referring to previous studies, and the specific operation was as follows [22, 23]. The upper chamber of the 24-well transwell plate (Corning, USA) was precoated with Matrigel (BD Biosciences, USA) for invasion assays, and inserts without Matrigel were used for migration assays. Approximately 3 × 10⁴ cells were seeded in the upper chamber and treated with FBS-free medium. Medium with 10% FBS was added to the lower chamber. After 48 h of incubation at 37oC, non-migrating cells were removed gently, and the rest were fixed in 90% ethanol and stained with 1% crystal violet. Cells were counted from five random fields under the inverted microscope.
Statistical analysis
Statistical analysis was carried out on GraphPad Prism Version 6.0 (GraphPad Software, USA). The cut-off value that indicates significance was set at 0.05. For correlation analysis, Pearson’s correlation was used to calculate the r2 value and p value. Prognostic models were built by Cox regression analysis of Tregs, and survival analysis was done using Kaplan-Meier curves.
Results
Increased Tregs in gastric cancer
With surgically resected tumor tissues and adjacent non-cancerous tissues obtained from 12 GC patients, flow cytometry results revealed that the proportion of CD4+CD25+ Tregs was evidently higher in GC tissues (Fig. 1A). Previous studies have found that five Treg-related genes, namely LRFN4, ADAMTS12, MCEMP1, HP, and MUC15, are strongly associated with GC prognosis [14]. Hence, we employed qRT-PCR to assess their expression in GC tissues. The experimental results showed notably increased expression of five Treg-related genes in GC tissues (Fig. 1B). All clinical statistics are shown in Table S1.

Effect of Treg-related genes on gastric cancer progression
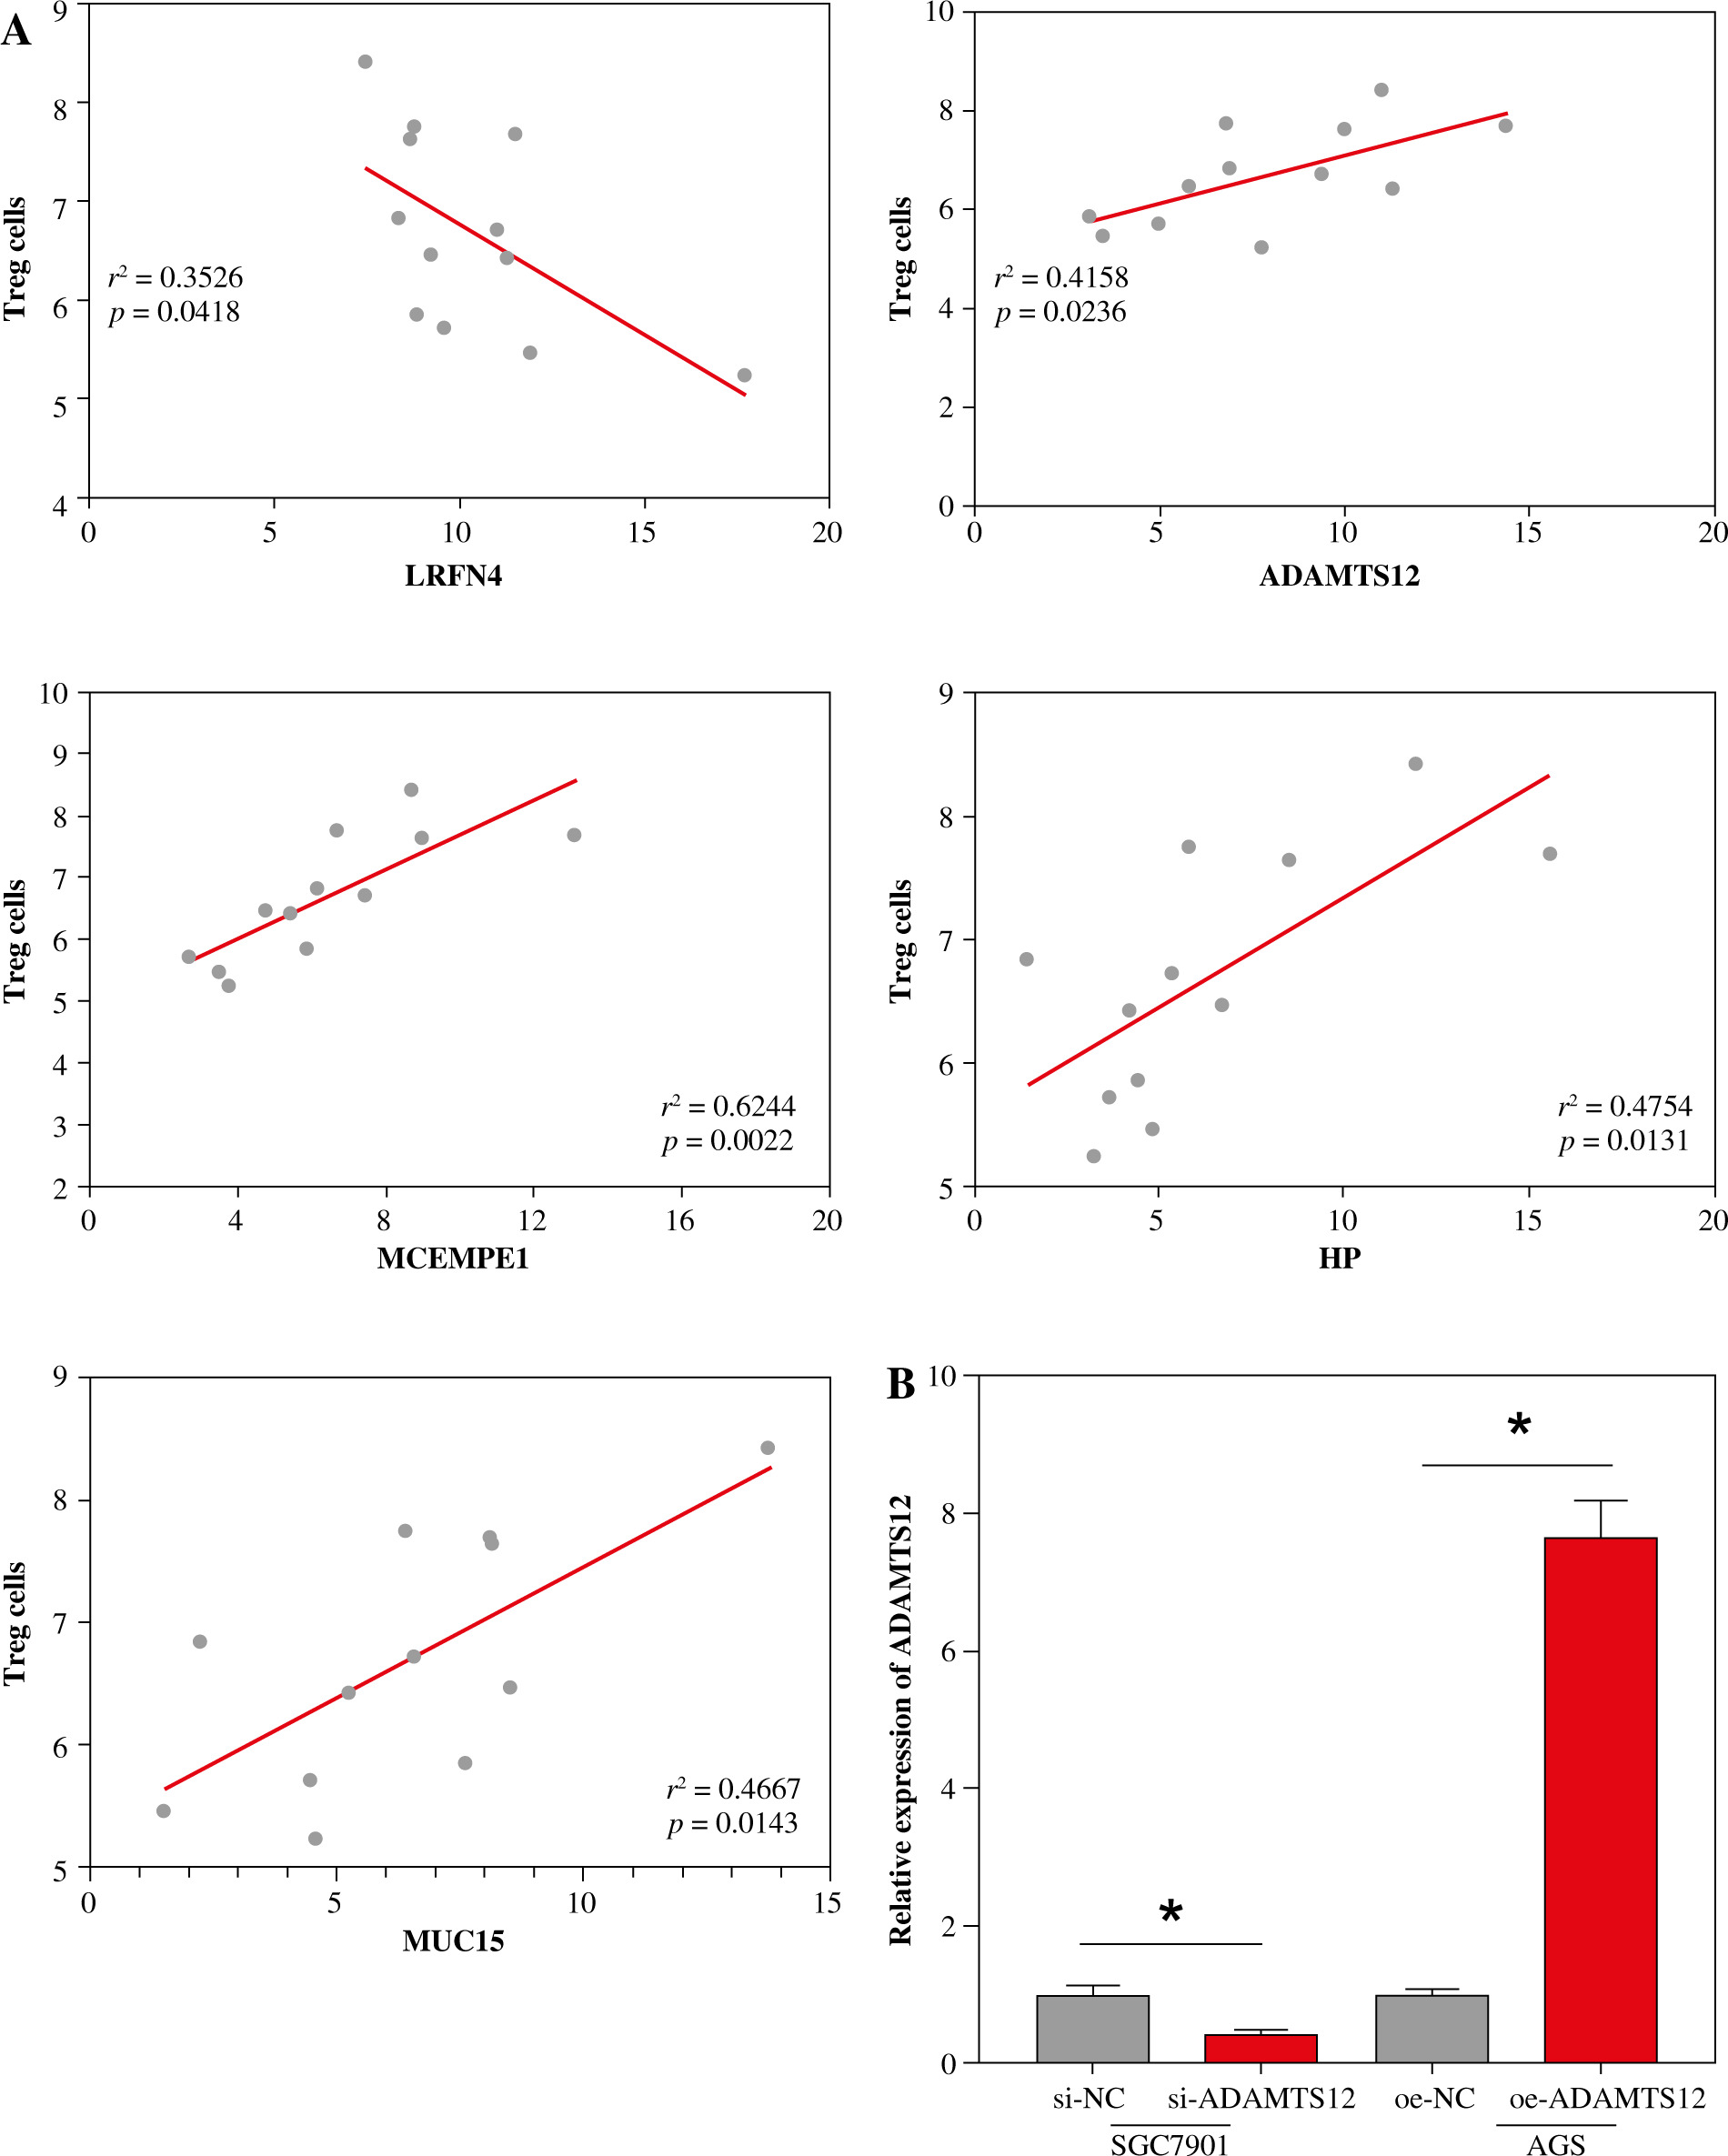
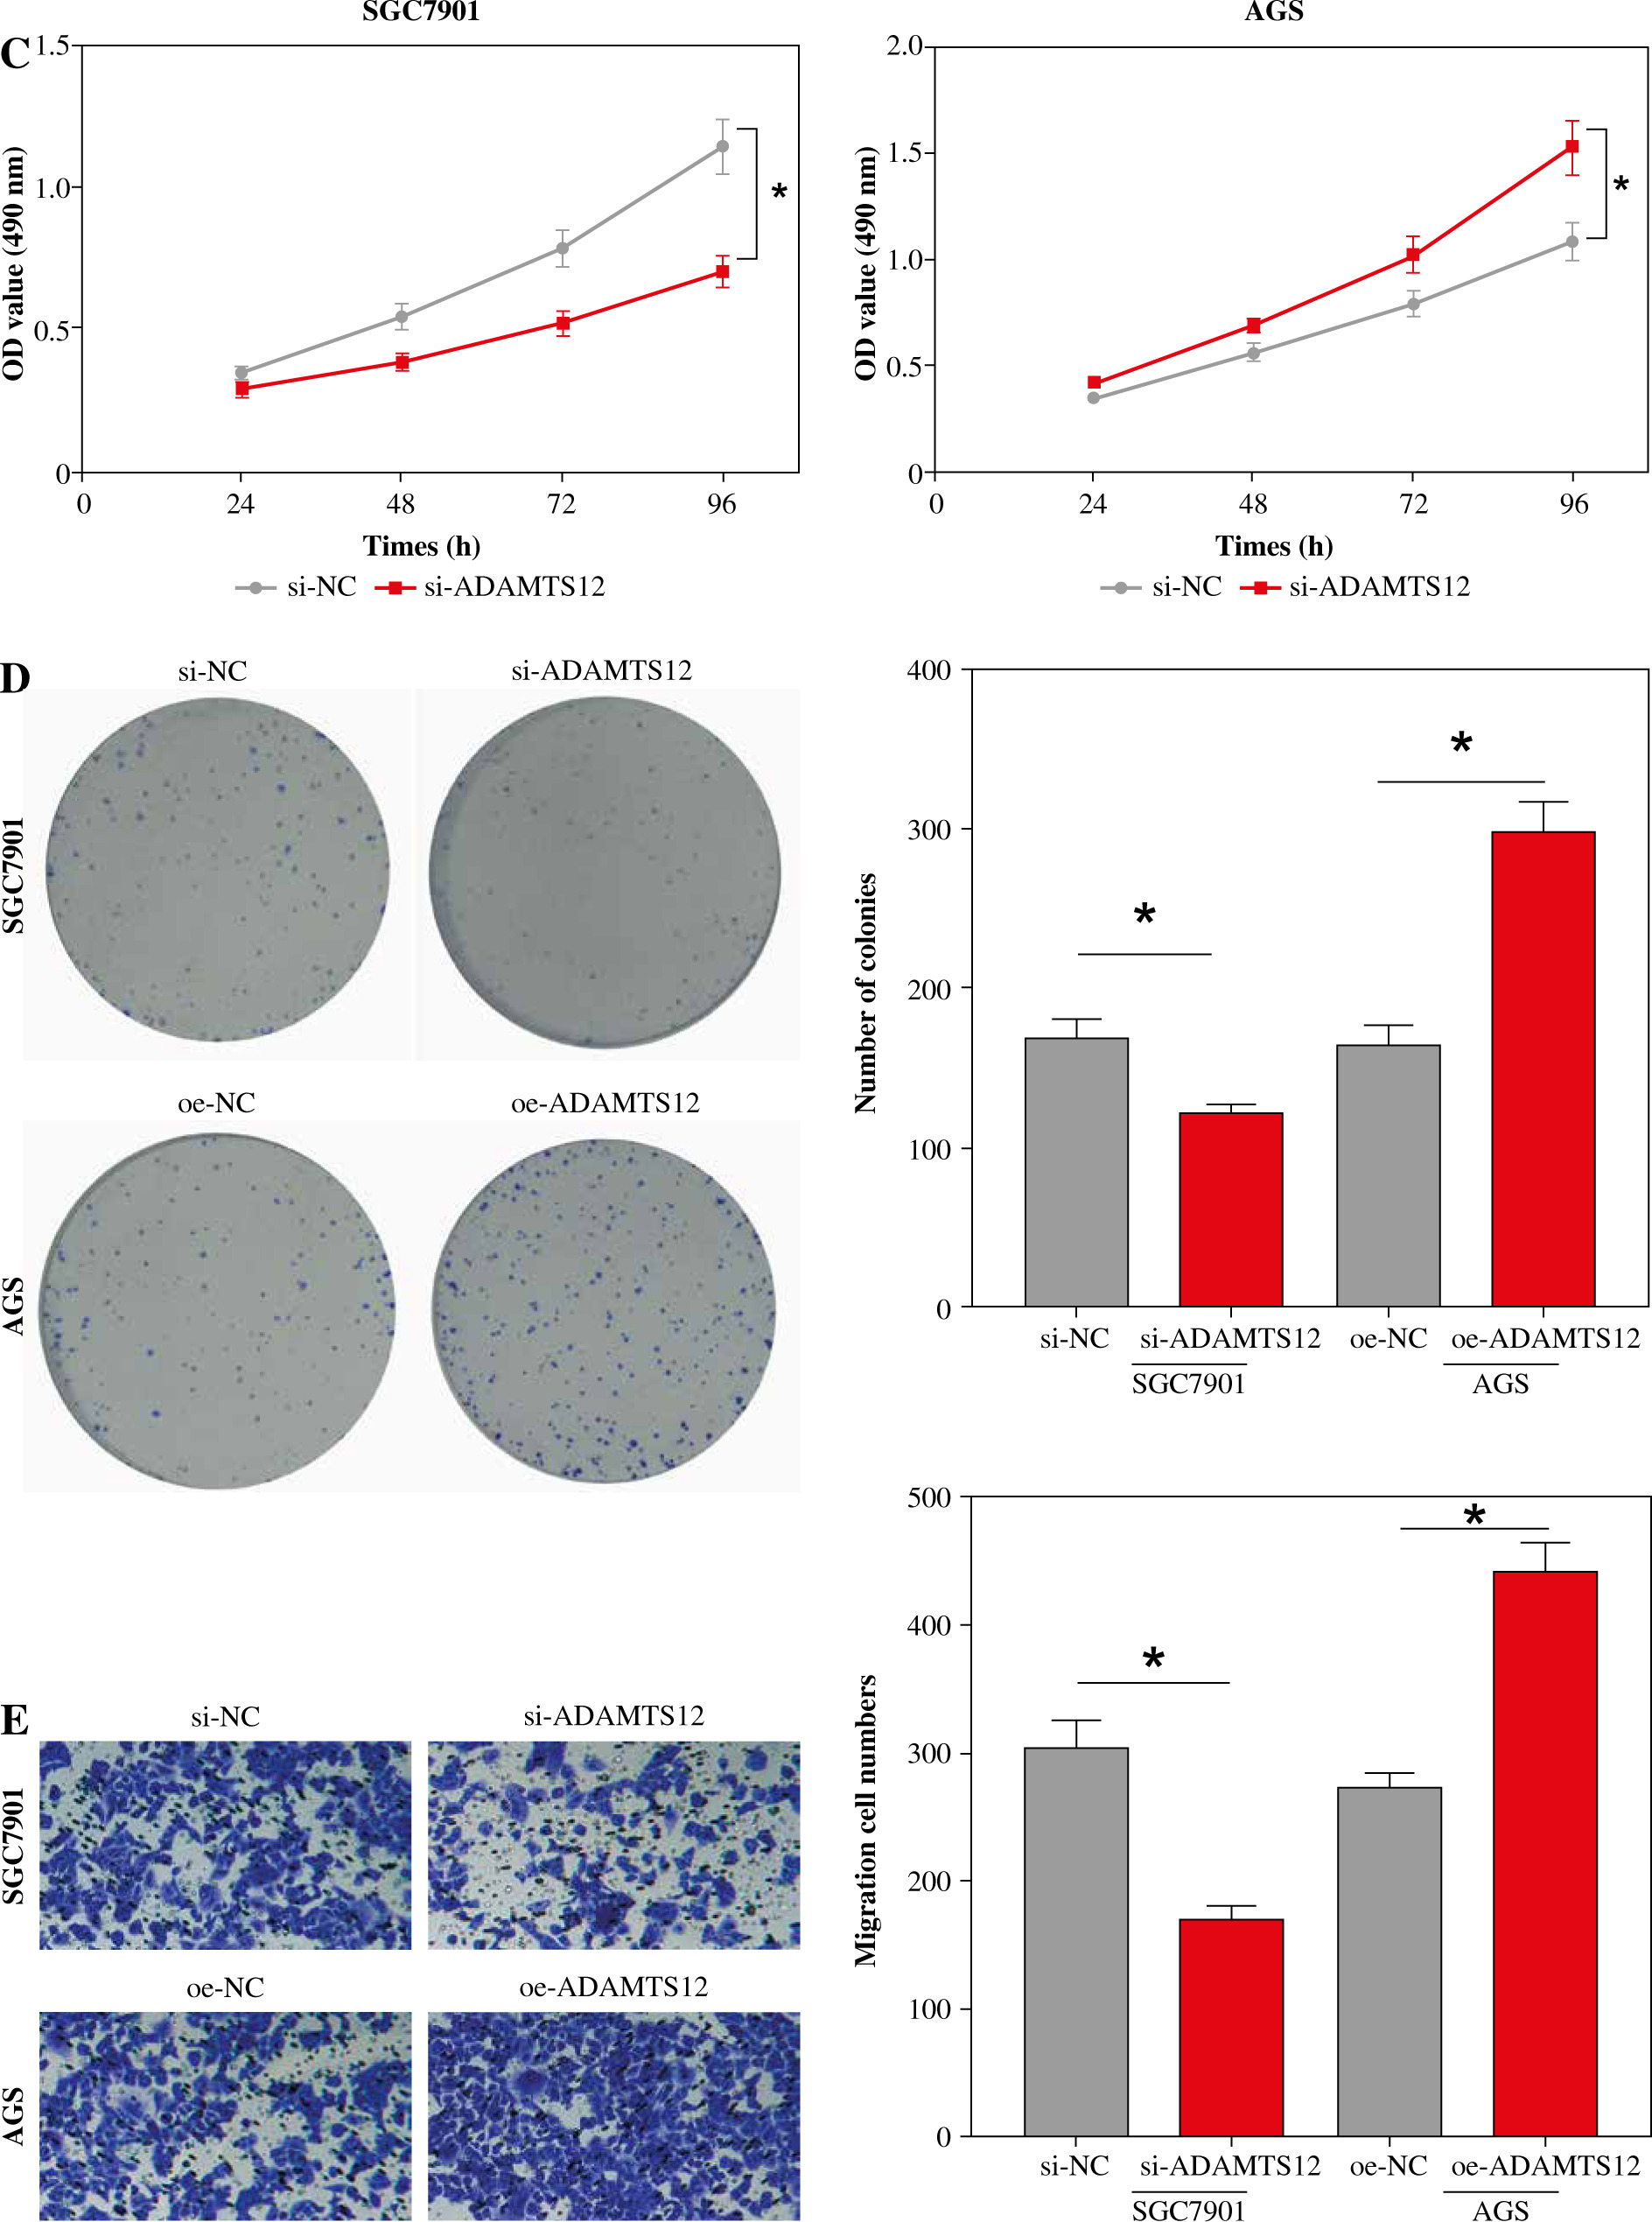
Based on the experimental results in the previous section, the correlation analysis between Treg proportion and the expression of related genes (LRFN4, MCEMP1, MUC15, HP and ADAMTS12) was conducted using Pearson correlation. As shown in Figure 2A, the Treg proportion was found to negatively correlate with LRFN4 expression (r2 = 0.3526, p = 0.0418) and to positively correlate with the other four (p < 0.05). To unveil the role of ADAMTS12 (r2 = 0.4158, p = 0.0236) in GC cells, oe-NC/oe-ADAMTS12 and si-NC/si-ADAMTS12 were transfected into GC cell lines AGS and SGC7901, to construct high-ADAMTS12 and low-ADAMTS12 expression cell lines. By analyzing the transfection efficiency via qRT-PCR, significantly upregulated expression of ADAMTS12 could be observed in the oe-ADAMTS12 group, whereas the si-ADAMTS12 group showed significantly decreased expression of ADAMTS12 (Fig. 2B). According to the results from MTT and colony formation assay, compared with the control group, the oe-ADAMTS12 group presented increased viability and proliferation ability of GC cells, which were inhibited in the si-ADAMTS12 group (Fig. 2C, D). The effect of ADAMTS12 expression on the migration and invasion of GC cells was confirmed by the transwell assay. According to the results, the oe-ADAMTS12 group had enhanced migratory and invasive capabilities of GC cells, while the si-ADAMTS12 group was observed with the opposite results (Fig. 2E, F). The evidence added weight to the observation that, in GC, the proportion of Tregs was positively linked with the expression of ADAMTS12, whose overexpression in promoted the malignant progression of GC.
Fig. 2
Effect of Treg-related genes on gastric cancer (GC) progression. A) Correlation analysis between Tregs and expression of Treg-related genes, namely LRFN4, ADAMTS12, MCEMP1, HP and MUC15 by using Pearson correlation; B) Transfection efficiency of oe-NC/oe-ADAMTS12 and si-NC/si-ADAMTS12 assessed by qRT-PCR; *p < 0.05

Tregs and related genes’ expression can be employed for gastric cancer prognostic prediction
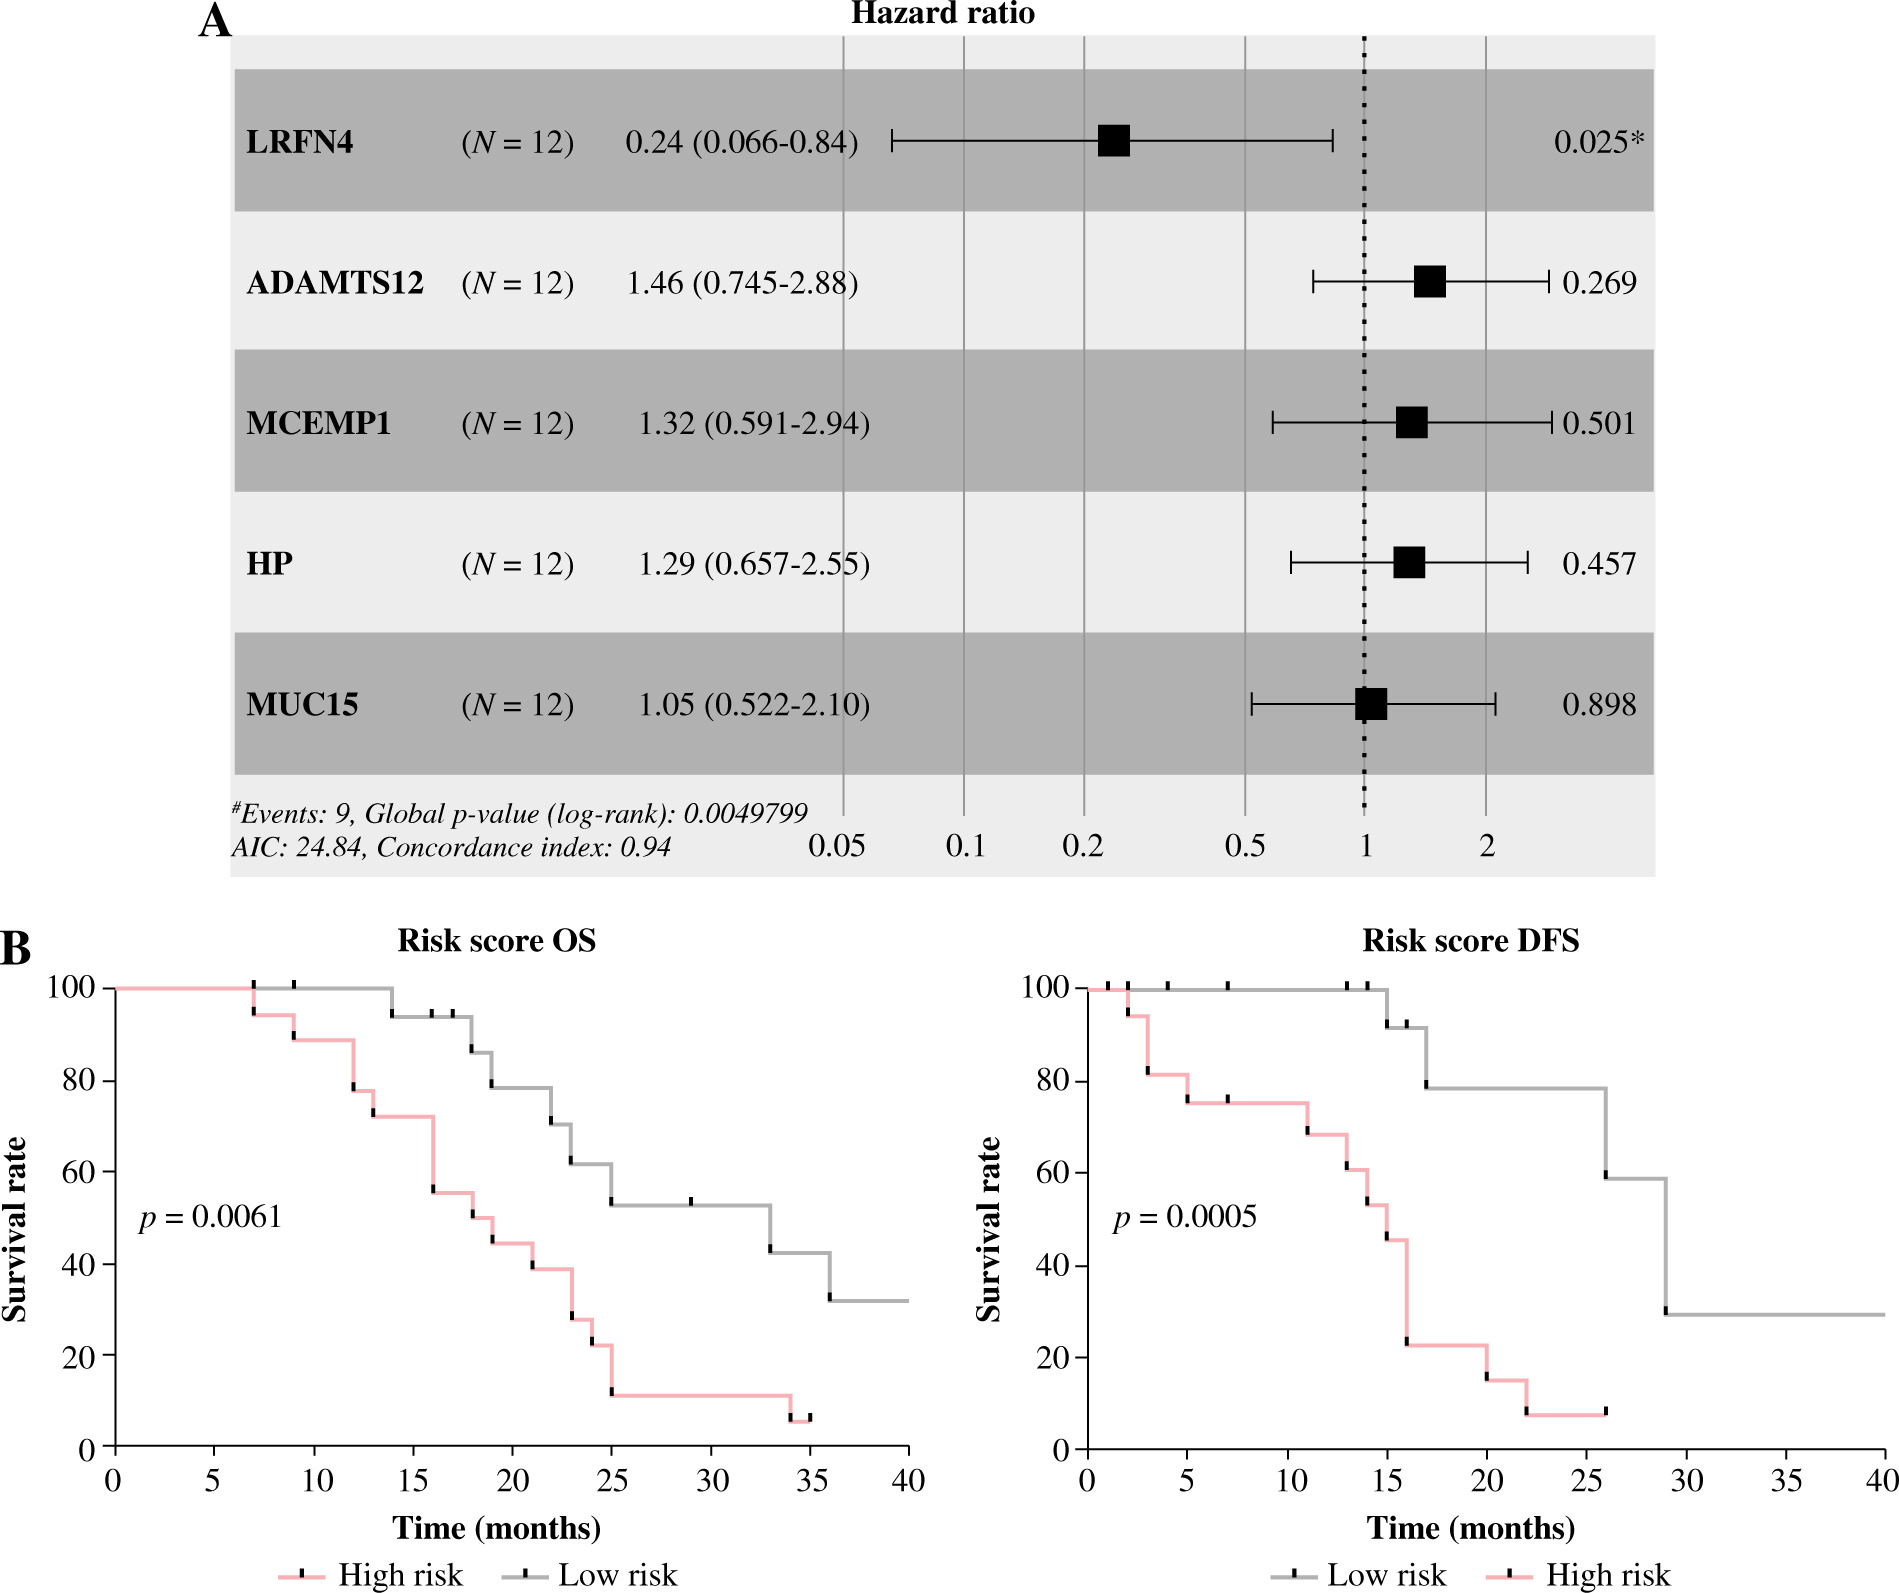
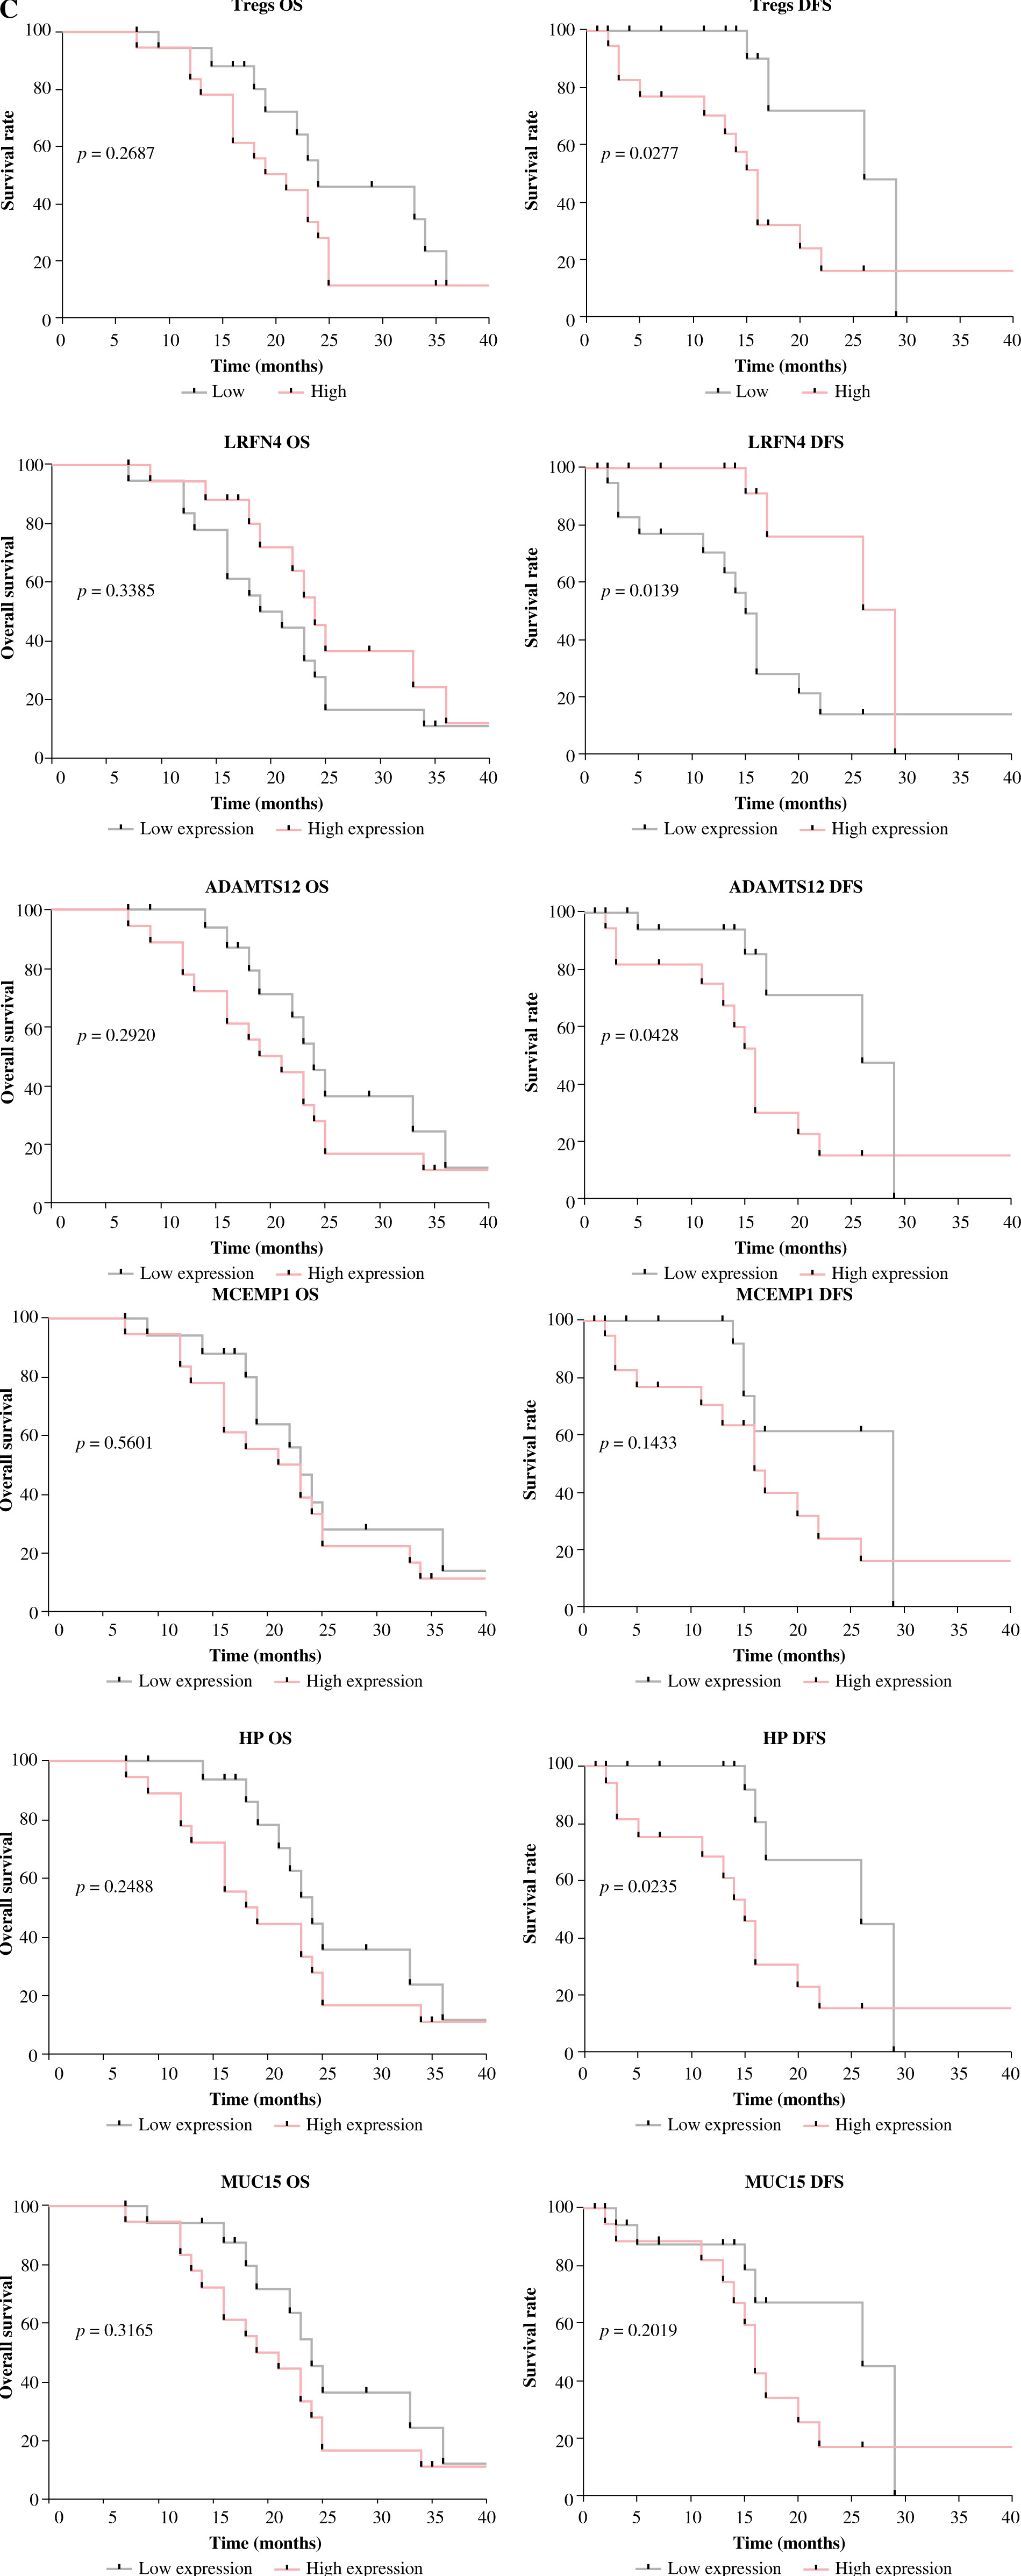
To profile the link between Tregs, Treg-related genes and GC prognosis, we employed Cox regression analysis to build a prognostic model with five Treg-related genes confirmed as prognostic factors (Fig. 3A). Among them, the hazard ratio of LRFN4 stayed below 1, while that of the other four genes was higher than 1. Then, a risk score formula based on the five feature genes was constructed to evaluate the survival risk of the samples according to the expression levels of the five genes: risk score = (1.445558 × LRFN4 expression level) + (0.380839 × ADAMTS12 expression level) + (0.275471 × MCEMP1 expression level) + (0.256952 × HP expression level) + (0.045509 × MUC15 expression level). Based on this established formula, we calculated the score for tumor samples collected from 36 patients. After that, patients were split into high-/low-risk groups by the overall median risk score and followed up for 3 years. As shown in Figure 3B, the low-risk group was found to have notably higher OS and disease-free survival (DFS) (p < 0.05). To analyze the model comprehensively, patients were classified into subgroups by the proportion of Tregs and the median expression level of the five genes. Corresponding survival analyses were plotted by Kaplan-Meier curves (Fig. 3C). According to the results, DFS in the high Tregs group was substantially shorter than that in the low Tregs group. Compared with the corresponding low expression group, the high expression group of LRFN4 had longer DFS, but no significant variation in OS. ADAMTS12 and HP low expression groups had longer DFS. No significant variations were observed in OS and DFS between high and low MCEMP1 and MUC15 expression groups. Although there was no significant correlation between single genes and patients’ OS, the risk score obtained based on these 5 Treg-related genes was significantly correlated with patients’ prognosis (OS and DFS), suggesting that the 5-gene signature might be a prognostic marker for GC patients.
Discussion
Gastric cancer remains a global health problem, with over 1 million new diagnoses worldwide each year [24]. As its early-stage diagnosis remains tricky, the therapeutic effect and OS of GC patients are far from expected. Therefore, genes related to GC prognosis might be used as biomarkers to provide insights for the development of novel targeted therapies. Accurate prognostic prediction and risk stratification can help assign patients to the treatment that they can benefit most from. For example, before immunotherapy, patients receive relevant companion diagnostics (PD-L1 expression assessment) to confirm their treatment response, assisting clinicians to specify the appropriate treatment strategy. Tregs were found to bear important prognostic value in different cancers as effective prognostic biomarkers. Koung et al. found that in gastric cancer patients, patients with low peripheral ImmunoCRIT (cellular ratio of immune tolerance) had longer DFS and OS, and peripheral ImmunoCRIT was related to immune cell infiltration in gastric cancer patients, while ImmunoCRIT was used to assess the status of peripheral regulatory T cells [25]. Because the tumor infiltrating regulatory (TITreg) cells were related to the prognosis of GC patients, Gao et al. found that the ability of TITreg cells in gastric cancer patients can be well predicted through the radiomics signature by using bioinformatics methods such as Cox combined with LASSO regression analysis, thereby predicting the prognosis of gastric cancer patients [26]. Since the correlation between Tregs and GC development and prognosis prediction needs to be further elucidated, this paper investigated the prognostic potential of Tregs and their related genes.
The current assessment that used TNM staging for GC prognostic prediction is limited since the conditions vary greatly among patients in the same tumor progression stage [27]. Research advances have confirmed that both treatment response and survival of GC patients are closely related to the molecular typing of GC [28]. In this case, biomarkers, particularly gene expression in tumor tissues, can be used to distinguish molecular typing in different patients. This study confirmed that the five Treg-related genes were significantly highly expressed in GC, ADAMTS12, MCEMP1, HP, and MUC15 positively correlated with CD4+CD25+ Treg proportion in tumor tissues (p < 0.05), among which the correlation coefficient of ADAMTS12 was 0.4158 (p = 0.0236). Subsequent cell function assays results confirmed that up-regulation of ADAMTS12 significantly promoted migration, proliferation and invasion of GC cells, which was consistent with the findings of Hou et al. [15]. This study confirmed that up-regulation of LRFN4 in GC patients indicated better prognosis. Highly expressed LRFN4 in colorectal cancer is also found to be linked with a low risk of death in patients [29]. However, high LRFN4 expression threatens patient survival in ovarian cancer [30]. Given that there are differences in the effects of LRFN4 on different cancers, we need to further explore its specific role in GC patients’ survival, which may be a new potential therapeutic target. In addition, we found that ADAMTS12, MCEMP1, HP, and MUC15 were risk genes for GC. Previous studies have confirmed that their high expression is associated with the malignant progression of GC or poor prognosis of GC patients. ADAMTS12 acts as a tumor promoter in GC that is responsible for tumor microenvironment status and tumor energy metabolism transition, which plays a cancer-promoting role and is associated with poor OS [15]. Additionally, a link between MCEMP1 and significantly enhanced immune cell infiltration in GC has been reported. Closely related to poor patient’s prognosis, MCEMP1 can affect the invasion and metastasis of GC cells by regulating epithelial-mesenchymal transition [31]. Jeong et al. [32] found that glycosylated HP protein in serum is closely related to GC and can be used as a biomarker for the clinical diagnosis of GC. Additionally, the combination of MUC15 and EMCN can effectively predict the prognosis of patients with gastric adenocarcinoma, and its high expression is associated with low survival rate [33]. However, a thorough investigation of molecular mechanisms has not been achieved for all relevant genes, and hence further experiments are required to specify the role of each gene in GC development. According to our results, the number of Tregs and expression of LRFN4, ADAMTS12, and HP could be used for DFS prediction of GC patients, while the rest were poorly correlated with DFS and showed no significant correlations with OS in patients. Therefore, the value of Tregs and their related genes alone in prognostic prediction in GC is limited, while the risk model we established compensates for the lack of univariate prediction and can better predict DFS and OS in the high/low-risk groups.
In summary, this study constructed a prognostic risk score model for GC based on Treg-related genes by Cox regression analysis, which has good predictive performance and can provide a reference for individualized diagnosis and treatment of GC patients. Compared with similar studies, the prognostic model of GC in this study took immunity as the background to construct a Treg-related polygenic risk model to predict GC patients’ prognosis. At the same time, the risk genes used for modeling can also be used as basic research and potential therapeutic targets for GC. Nonetheless, this study has some limitations. First, the sample used for validation is of relatively small size, and subsequent large-scale clinical trials are still required to assess its predictive accuracy. Second, the risk genes used for modeling in this study have not been further validated by in vivo experiments. Hopefully, the risk model developed in this study can prolong DFS and OS in GC patients and contribute to the development of individualized treatment based on targeted drugs of Treg-related genes.