
Purpose
Quality control (QC) strategies and quality assurance (QA) are subjects of paramount relevance for head and neck (H&N) interventional radiotherapy (IRT, brachytherapy), and have previously been addressed in the GEC-ESTRO recommendations [1]. As highlighted by Valentini et al. [2], QA differs from QC. In particular, QC refers to actions ensuring that the patient treatment process adheres to pre-defined standards, such as verifying needle connections and depths. In contrast, QA involves tests performed outside direct treatment workflow to confirm proper system functionality, including evaluating source positioning accuracy and calibrating high-dose-rate (HDR) iridium-192 (Ir-192) source.
Quality control has been implemented in multiple phases over the past decades, starting from early clinical trials and later evolving into a cornerstone, widely used in routine clinical practice on a large scale [3, 4]. The impact of QC is especially relevant for H&N IRT due to the complexity of several anatomical sub-sites, which are present in this region, characterized by the presence of multiple adjacent organs at risk (OARs) [5]. In addition, radiation treatment QC plays a crucial role in the IRT process, as it directly influences clinical outcomes for the H&N region and is an established component of standard practice [6]. For the afore-mentioned reasons, several researchers are keen on fostering the implementation of specific strategies to obtain more efficient, evidence-based, and desirably generalizable protocols [7].
Another point to consider is that the severity of deviations from pre-defined standards can be classified as either minor or major, with minor deviations usually having no clinical significance in terms of clinical outcomes, whereas major deviations defined as those significantly increasing the risk of treatment failure [8]. Such differences between minor and major deviations can be applied to all different phases of the IRT process, focusing extensively on implant verification, treatment planning, and dose calculation [9, 10].
This retrospective report aimed to explore strategies for optimizing interstitial IRT, focusing primarily on QC, to enhance the accuracy of treatment for head and neck cancer patients.
Material and methods
Data of all patients treated with IRT at our institutional Interventional Oncology Center (IOC) from January 2022 to December 2023 were retrieved through an electronic H&N cancer database. Treatment plans were generated using Oncentra Brachy treatment planning system (TPS v. 4.6.2, Elekta, Sweden), with a HDR Flexitron afterloader (Elekta, Sweden) and a dwell spacing of 1 mm for all patients.
For the purpose of this study, only anatomical sub-sites with treatment schedules lasting more than 5 days were considered. Therefore, only patients diagnosed with either nose vestibule [11] or eyelid cancers, who usually received 14 fractions twice a day (with an overall treatment time of 9 days) [12, 13] were taken into account. All fractions were delivered according to the institutional quality controls, which are summarized in Table 1.
Table 1
Summary of quality checks performed during treatment delivery
Two possible deviations considered were catheter-transfer tube misconnection and catheter displacement, as these were the two most operator-dependent procedures, particularly when performed by different technicians over multiple days of treatment. Given the repetitive nature of multi-fraction treatments, these measures are more prone to human error during delivery process, making them the most frequent deviations observed in clinical practice.
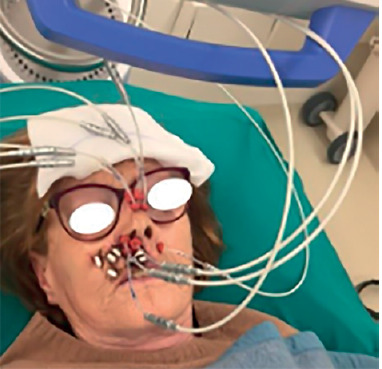
Adequate QC procedures were undertaken according to specific action, including before the first fraction only, at mid-course only, or at every fraction. To mitigate the risk of catheter-transfer tube mismatch, each flexible implant tube was individually numbered and tailored to a specific length for every catheter prior to CT simulation. Owning to the critical importance of implant stability in interstitial H&N IRT, particularly in the treated region, the present study incorporated routine visual inspections of catheters before each treatment fraction. These inspections, conducted by both technicians and physicians, focused on assessing the macroscopic positioning of button marks. To ensure smooth source movement within the catheters, connections to the HDR Flexitron afterloader were configured so that transfer tubes at higher risk to shift (for example, those inserted inside nasal swabs) were in anti-gravity position, as shown in Figure 1.
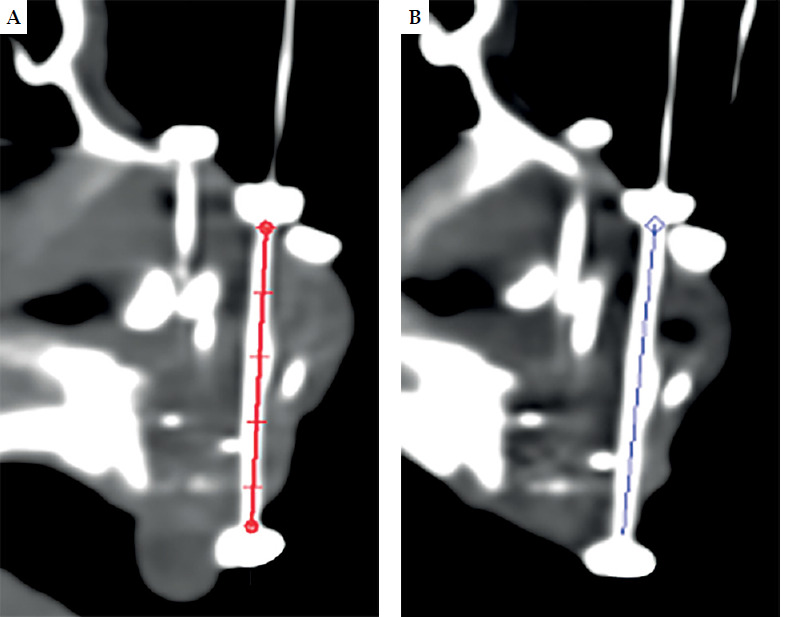
Mid-course simulation was performed before delivering the 8th fraction, using a high-resolution CT scan, slice thickness of 0.625 mm, with a Discovery CT590RT CT scanner (GE Medical System). Oncentra Brachy TPS was employed to measure the length between two buttons on each tube, and data between initial CT scan and mid-course scan were compared, as illustrated in Figure 2. Differences in distance measurements in a single-scan slice for the same catheter and patient across scans, were considered. Mid-course CT was anticipated in case of visual displacement found during daily inspection. The resultant distance measurements were expressed as means and standard deviations (SD), and were analyzed using one-way Student’s t test.
Results
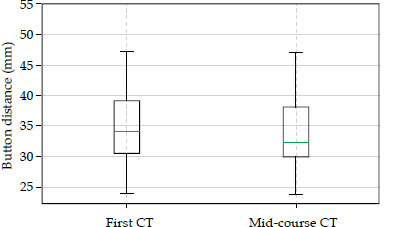
In this study, data of 30 patients treated with interstitial IRT for nose vestibule or eyelid cancers were included. Among the patients, the interstitial IRT procedure was performed using an average of 6 plastic tubes per implant, with nose vestibules having a higher average number of catheters compared with eyelids (nasal vestibule: mean, 7.5; min, 4; and max, 14; eyelids: mean, 4.1; min, 2; and max, 7). Overall, 420 fractions were delivered and a total of 360 measurements of button-to-button distance were recorded. Data analysis revealed no significant differences in the mean button distance between the initial CT scan and the mid-course CT scan. Figure 3 demonstrates the mean values of button distance of 35.2 ±10.5 mm and 35.9 ±10.5 mm for the first CT and the mid-course CT, respectively, suggesting that there was no significant difference in the mid-course CT compared with the initial CT.
Fig. 3
Box plot showing the evaluation of mean button distance calculated for the first CT and the mid-course CT. The variation between the mean distances is not clinically significant
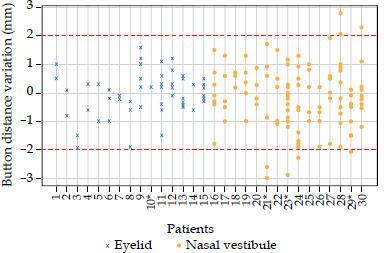
For each patient and each catheter, the button distance variation was recorded. Shapiro-Wilk test confirmed that data followed a normal distribution, with a two-sigma confidence interval corresponding to a range of ±2 mm.
However, in 5 out of 30 cases (16.6%), re-planning was deemed necessary. This decision was based on one of two criteria. The first possibility was an evidence of one (or more) catheter’s displacement after visual check, while the second possible situation was the presence of a variation in button distance exceeding 2 mm, indicating a level of uncertainty necessitating a revision of treatment plan. In these cases, the initial plan was re-calculated by inserting values of active source positions measured on the mid-course CT, and dose distribution was evaluated for any eventual clinical impact. In case of clinical target volume (CTV) coverage dropping below 95% or dose non-uniformity ratio (DNR) increase above the desired threshold, a new plan was developed [14-16]. Even though the current head and neck GEC-ESTRO guidelines [17] recommend a DNR of 0.36, its value might be higher depending on anatomical site, prescription dose, and CTV volume.
Figure 4 illustrates the variations in button-to-button distance, with a cut-off value of 2 mm, represented by the dotted red line in the graph and corresponding to two-sigma confidence interval. Data analysis demonstrated no obvious trend in the variations of button-to-button distance across different tumor types and number of catheters per implant. However, these results showed that for 6 nasal vestibule patients (patients number 21, 23, 24, 28, 29, and 30), a distance variation of more than 2 mm was found in at least one catheter. None of the eyelid patients exhibited a variation greater than 2 mm. However, it should be noted that in 4 out of 30 cases (eyelid patient number 10, nasal vestibule patients number 21, 23, and 29), one catheter dislodged after a few fractions, requiring the creation of a new CT-based plan.
Fig. 4
Button distance variations are depicted for each catheter across patients: blue crosses represent eyelid patients, while orange circles signify nasal vestibule cases. Patients marked with * are those, in whom at least one catheter dropped away from the interstitial implant. Any values surpassing the two-millimeter cut-off value require a revision of treatment plan, whereas values within the cut-off thresholds do not necessitate plan’s re-assessment
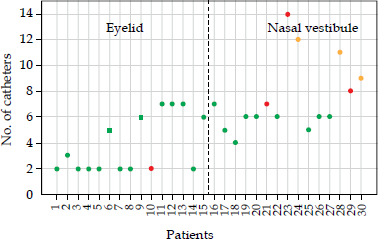
In this study, we investigated the dependence of the number of catheters with the button distance variation. Figure 5 illustrates the relationship between the number of catheters used per implant and individual patients: green dots represent patients, for whom no variations larger than 2 mm were found, yellow dots indicate patients with a difference greater than 2 mm detected, and red dots represent patients with dislodged catheters. The nasal vestibule cases with a variation of more than 2 mm resulted to be those with the higher number of catheters implanted. Prior to plan revision, the dosimetric impact of variation in button distance was assessed for patients, as indicated by yellow dots in Figure 5. For patients number 24 and 30, the variation resulted in non-significant dosimetric impact on the plan. However, in patient number 28, in whom a variation in button distance exceeding 2 mm occurred for two catheters, notable changes in dose distribution were observed. Specifically, a 27% increase in DNR was found (range, 0.55-0.7), indicating a consequent increase in hot spots and coverage (V95% CTV, 95.2-99.0%) within CTV and on the skin surface. This variation indicated a clinically significant alteration in dose delivery, requiring a re-assessment of the plan.
Discussion
In our series, all re-planning were deemed necessary after displacements found on visual check. In our opinion, the need to perform a dosimetric evaluation in cases with shifts superior to 2 mm is relevant, because both anatomical sub-sites considered are performed using an anatomical implant, and this means that catheters typically cross each other in several points inside CTV. For such reason, when choosing active positions to deliver the dose, the crossing dwell positions are usually turned off to avoid hot spots and reduce DNR. Similarly, the active positions are contained within the skin surface to lower the risk of poor esthetic results. In cases of catheter displacement > 2 mm, it is advisable to evaluate the overall CTV coverage as well as DNR variation and dose to the skin.
To the very best of our knowledge, there are no previously published data on H&N IRT QC. However, we may refer to similar papers on external beam radiation therapy in H&N, where, i.e., 9% of major events were reported [18]. We found that a major deviation from the simulated implant (for example, loss of one catheter) may affect the validity of the plan [19]. Hence, it is important to underline that the definition of major event is not necessarily related to poor clinical outcomes, at least in previously published series [8].
Compared with external beam radiotherapy, where there are large available databases addressing this issue in IRT, there are fewer experiences specifically aiming at evaluating QC protocols for treatment delivery. Particularly, the main reasons for catheter displacements can include inadvertent patient or operator shifts and local swelling due to infection or tumor shrinkage.
In the current study, we analyzed only treatment schedules using 14 fractions with an overall treatment time of 9 days, and therefore it is reasonable to believe that for shorter schedules (within 5 days), the risk of catheter displacement will be lower.
A major limitation of the study is related to the fact that it was difficult to correlate the clinical impact of deviations recorded with unexpected outcomes, both in terms of side effects and lack of local control. In fact, the cut-off value used for a re-planning was very low.
Radiotherapy is a loco-regional treatment, usually compared with surgery in terms of clinical outcomes, both regarding local control of disease and possible complications rather than systemic treatment [20]. Radiotherapy, including IRT, is a complex procedure, and implies adequate knowledge of principles from different disciplines, such as medical physics, radiobiology, radiation safety, dosimetry, radiation treatment planning, and simulation as well as interaction of radiation with other treatment modalities [21].
Quality control is by far a relevant topic in surgical oncology procedures according to a recent review on the subject [22]. However, when dealing with IRT, a QC program is absolutely mandatory. Table 2 highlights the main differences in QA between surgical procedure and interventional radiotherapy.
Table 2
Main differences in quality assurance (QA) between surgical procedure and interventional radio- therapy
In the view of main aspects involved in performing QC strategies, it is important to consider at least four different domains: 1. Time for procedure completion, 2. Interaction among different operators, 3. Time to develop procedure-related complications, and 4. Medico-legal implications associated with evidence contained within reporting [23].
Time for procedure completion: It is possible to make a further sub-division into phases necessary to perform the procedure. As for the duration, it is quite understandable that IRT requires multiple phases, which typically are executed over several days.
The number of professionals involved: The most relevant difference between surgical procedures and IRT is the fact that in the latter, the team is not only inter-disciplinary but also inter-professional, since it involves not only medical doctor but also physicists and technicians. For such reason, in the frame of inter-professional team, there is a strong requirement for standardizing the communication.
Time to develop procedure-related complications: In surgical procedures, the most significant complications typically arise within the first days or weeks. Whereas in IRT, the most relevant adverse events are reported months or even years post-procedure. This difference in timing is relevant, because in the case of a surgery with no major complications found shortly after treatment, it is reasonable to assume that the risk of complications will decrease over time. On the contrary, in IRT procedures it is necessary to monitor and assess side effects in follow-up for a longer period.
Finally, it is necessary to realize that reporting in radiotherapy (IRT included) is by definition more accurate, because it involves not only a mere description but it is associated with all the simulation imaging and the consequent dose distribution. This accuracy of reporting makes it easier to correlate possible complications with major deviations from the standard protocol in terms of medico-legal issues.
For the afore-mentioned reasons, quality control strategies should be part of routine clinical practice and must be tailored according to specific schedules used for different anatomical sub-sites of head and neck region.
Conclusions
This study highlights the importance of QC in head and neck IRT, demonstrating that it can help ensure treatment accuracy and minimize the risk of deviations, which may impact clinical outcomes. The findings emphasize the relevance of monitoring catheter stability and dose distribution to determine the need for treatment re-planning. Given the complexity of IRT procedures, the integration of specific protocols into routine clinical practice remains essential to optimize treatment delivery and enhance patient safety.


