
Purpose
With advances in Gynaecology (GYN) brachytherapy applicators, more use of computerised tomography (CT) and or magnetic resonance (MR) image guidance, improved treatment planning and delivery systems, MR image guided adaptive BT (IGABT) recommendations of GYN GEC-ESTRO (Groupe Européen de Curiethérapie and the European Society for Radiotherapy) working group, three dimensional (3D) dose volume evaluation and reporting has been successfully implemented in practice [1]. This includes large multi-centric prospective studies, such as EMBRACE I/II (an international study on magnetic resonance imaging [MRI]-guided brachytherapy in locally advanced cervical cancer) [2]. Pelvic examination is vital for FIGO (International Federation of Gynecology and Obstetrics) staging of cervical cancer. Historically, clinical examination findings have been documented using many clinical drawings. Image-guided adaptive brachytherapy for cervical cancer is based on repetitive gynecologic examinations (GE) and MRI, to delineate and distinguish the disease at cervix and adjacent regions for delivering optimal tumoricidal doses. Clinical drawings are an integral part of IGABT approach, and have been widely adopted from the EMBRACE study protocol [3]. Clinical drawings provide semi-quantitative assessment of the disease in terms of size and extension in various directions, allow for immediate and quick assessment of response to radiation, permits selection of brachytherapy technique, and facilitate inter-observer comparison [4]. The EMBRACE clinical drawings were modified to include measuring scales in all directions for more accurate representation of various tumor-related volumes, and better understanding of target volumes during radiotherapy treatment. Additional advantage of the modified drawings is that dimensions of tumor or target can be delineated on a single diagram, which helps to understand regression patterns of the tumor during radiotherapy. Also, it may help to better understand BRT target concepts and improve quality of BRT in cervical cancer patients, in terms of efficient contouring and planning. Moreover, it can have positive implications on contouring in environments other than MR-based IGABT. The objectives of the current study were to understand patterns of tumor regression and relationship between gross tumor volume at diagnosis (GTVD) and high-risk clinical target volume (CTV-THR)/intermediate-risk clinical target volume (CTV-TIR volume at the time of BRT). A revised EMBRACE clinical drawings were used, which may provide insights into patterns of regression.
Material and methods
Locally advanced cervical cancer patients, admitted to the Medical University of Vienna and the TMH Mumbai, who had completed their treatment till March 2014, were screened. Forty-two patients from the Medical University of Vienna (n = 28) and the TMH Mumbai (n = 14), with histologically proven cervical cancer and FIGO stages IIB-IIIB, who participated in the prospective EMBRACE study and completed their planned treatment, were enrolled in the study. MRI pelvis taken at diagnosis and during brachytherapy, along with schematic clinical diagrams of gynecological examinations, with individual tumor extensions and tumor dimensions as specified by EMBRACE, were included in the analysis. Patients have provided informed consents during their enrolment in the EMBRACE trial for analysis and publication of their treatments’ records. In TMH cohort, all patients underwent diagnostic MRI (1.5 T, Signa, GE Systems) according to specific protocol described earlier [5]. Vienna patients underwent imaging using a 0.3 T open-type MR scanner [6], and all these patients underwent MR planning. Standard target-related volumes (GTV, CTV-THR, and CTV-TIR according to GEC-ESTRO recommendations) were contoured at the time of brachytherapy.
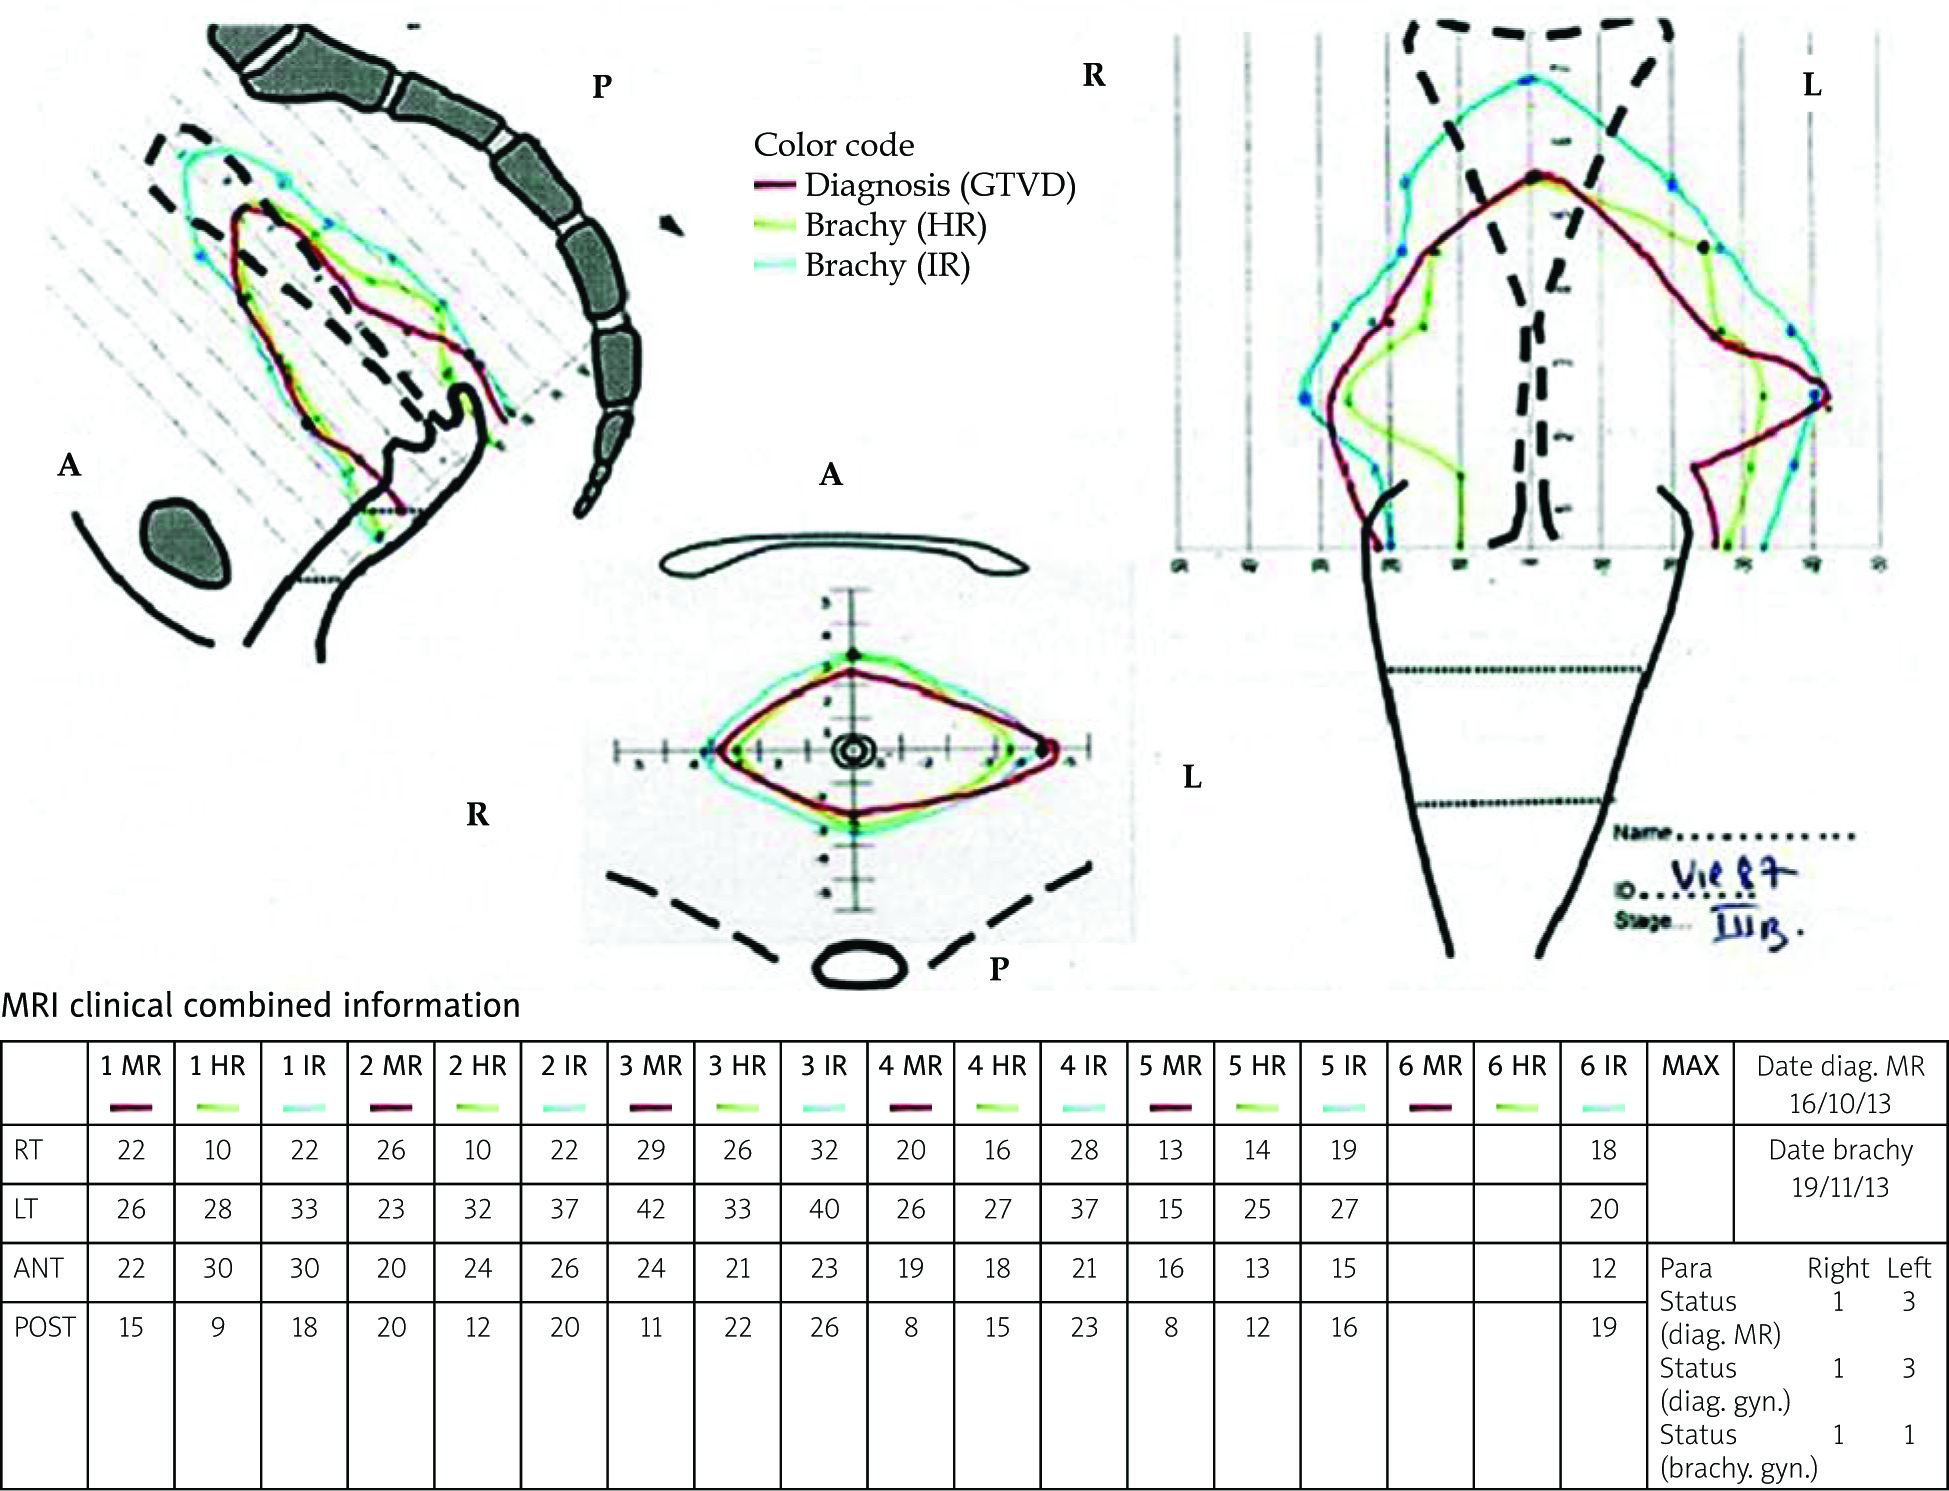
Clinical diagrams utilized for the EMBRACE study [3] were modified to an advanced schematic 3D-mapping diagram (3D-MD) in axial, coronal, and sagittal orientations, with a measurement scale (grid with 10 mm distance) for a precise assessment and documentation of available volumetric information (through MRI at diagnosis and during brachytherapy). This 3D-MD had been developed by the authors through iterative testing in clinical settings to provide precise, reproducible, topographic, and quantitative information in one comprehensive overview (Figure 1) [7]. In addition, it includes a table to document tumor and target dimensions at various levels at the time of diagnosis and brachytherapy (Figure 1). For tumor mapping and subsequent comparison of volumes at diagnosis and brachytherapy, only tumor dimensions from MRI were plotted in 3D-MD.
Fig. 1
Advanced schematic mapping diagram (3D-MD) in axial, coronal, and sagittal orientations, with a measurement scale (grid with 10 mm distance). A table indicates tumor/target (bilateral) dimensions at various levels at the time of diagnosis and brachytherapy, obtained from respective MRI. In this study, a qualitative and quantitative correlation between volumes of GTVD and CTV-THR acquired through MRI were analyzed. The schematic diagram, apart from information on MR images, also summarizes the findings of gynecological examinations. A typical case (stage IIIB) is mapped to illustrate qualitative final results that were available for evaluation
MR – GTV at diagnostic MRI (GTVD); HR – CTV-THR; IR – CTV-TIR; Date of diagnosis MRI – date of MRI done before any treatment; Date of brachy – date of first brachytherapy; Para – parametrium; Status (diag. MR) – status of parametrium on MRI finding at diagnosis; Status (diag. gyn.) – status of parametrium from gynecological exam at diagnosis; Status (brachy. gyn.) – status of parametrium from gynecological exam during first brachytherapy. Values 1, 2, and 3 indicate status of parametrium according to the EMBRACE study; MRI clinical combined information – schematic diagram and table combines maximum information obtained from MR images and also status of parametrium from gynecological examination.
Methodology of objective documentation of the tumor and target dimensions
Magnetic resonance images at diagnosis and during brachytherapy, with applicator in situ were utilized to delineate the disease at diagnosis (GTVD) and target volumes (CTV-THR and CTV-TIR ) during BRT. Measurements of GTVD, CTV-THR and CTV-TIR in terms of width, thickness, and height, were plotted on the revised clinical drawing to generate a schematic map. For the width and thickness measurements, the utero-cervical canal was taken as the central axis, and the external os (surrogate for projection of BRT applicator) was considered as the reference point and origin. BRT-related volumes were plotted in a superior direction from the origin at 1 cm intervals, until all volumes were included. The height of volumes was defined as the maximum longitudinal extent, starting from the cervix towards fundus of the uterus. Width was measured from axial and coronal sections, in relation to the central axis bilaterally to include parametrial infiltration, while the thickness and height were measured on the sagittal section, assisted by the axial images, with vaginal extension of tumor and target not accounted.
Qualitative evaluation was performed based on the drawings of all the 42 cases on individual maps. The dimensions (height, width, and thickness) and volumes (GTVD, CTV-THR, and CTV-TIR) were compared and correlated (n = 42). The width of CTV-THR and dimensions were not symmetrical on both sides (left and right) from the central canal. Thereafter, another quantitative analysis comparing widths with a particular side (right or left) of GTVD with CTV-THR and CTV-TIR at a height of 0, 1, 2, and 3 cm from os and near maximum distance (NMD) (n = 84) was done. NMD is the distance between external os (surrogate for cervical canal) and lateral most extent of parametrial disease on each side, which can be clinically/clinico-radiologically documented [7]. For each patient, NMD in relation to the cervical canal, were documented, and resulted in two separate data sets for right and left sides, in relation to the cervical canal.
Results
The patients with FIGO stage IIB and IIIB, who underwent MR-based IGABT procedure were analyzed. With a mean age of 52 ±9.3 years and as per FIGO (2009) staging, there were 22 stage IIB and 20 stage IIIB patients. All datasets were available for the final analyses.
Qualitative outcomes
Dimensions of CTV-THR followed closely that of GTVD, with some variations and exceptions. CTV-TIR volumes were always closely overlapping CTV-THR volumes. In most of the cases, CTV-THR and CTV-TIR were encompassing GTVD volumes. In some patients, small parts of GTVD were located outside CTV-THR and/or CTV-TIR.
Quantitative evaluation
Tables 1-3 show in detail the results. The mean ± SD volume of GTVD, CTV-THR, and CTV-TIR was 50.7 ±5.7 cm3, 55.3 ±36.3 cc, and 98.6 ±51.1 cc, respectively. Pearson’s correlation coefficient values (r) for CTV-THR and CTV-TIR volumes with GTVD were 0.66 and 0.64, respectively, with each correlation value significant (p = 0.00). The r-values (p-values) for height, width, and thickness between GTVD and CTV-THR at first brachytherapy was significant, showing values of 0.66 (0.00), 0.45 (0.003), and 0.47 (0.002), respectively. The correlation between GTVD and CTV-TIR for height, width, and thickness was similar with r (p value) of 0.56 (0.00), 0.48 (0.001), and 0.49 (0.001), respectively. The correlation between CTV-THR and CTV-TIR in all three dimensions of height, thickness, and width, approached 1.
Table 1
Quantitative description of the volumes and dimensions of GTV at diagnosis (GTVD), high-risk clinical target volume (CTV-THR), and intermediate-risk clinical target volume (CTV-TIR) during first brachytherapy. Pearson’s correlation r-value and p-value are shown whenever applicable
Table 2
Dimensions of target volumes of patients classifying in group 4 and group 5 according to EBRT response according to Noha et al. study
Table 3
Analysis of one-sided width at 0, 1, 2, and 3 cm from os; 1 patient = 2 observations, n = 84
The median ratio of width of GTVD/CTV-THR and GTVD/CTV-TIR were 1.1 (range, 0.8-2.6) and 0.8 (range, 0.6-1.9), respectively. Similar values were achieved for thickness, with 1.2 (range, 0.5-2.7) and 0.9 (range, 0.5-1.7) for GTVD/CTV-THR and GTVD/CTV-TIR, respectively (Table 1).
The patients were additionally categorized into various groups, based on volumetric classification of GTVD and CTV-THR in FIGO stage IIB and IIIB cervical cancer patients treated by IGABT, as reported by Jastaniyah et al. [4]. The patients were classified into groups as follows (number of patients): group 1 = 2, group 2 = 1, group 3 = 0, group 4 = 9, group 5 = 29, group 6 = 1 (total, n = 42). Statistical correlation was done for groups 4 and 5, since other groups had very few patients. There was a significant correlation (correlation coefficient; p = 0.00) between width of GTVD, and CTV-THR and CTV-TIR (Table 2).
The dimensions of width in one direction (hence: 1 patient = 2 observation) from the central canal/tandem at levels from 0 cm to 3 cm were taken for analysis, and these dimensions were compared at these levels and at NMD (n = 84) (Table 3). The correlations of maximum width of CTV-THR and CTV-TIR with that of GTVD were 0.41 (0.00) and 0.4 (0.00), respectively.
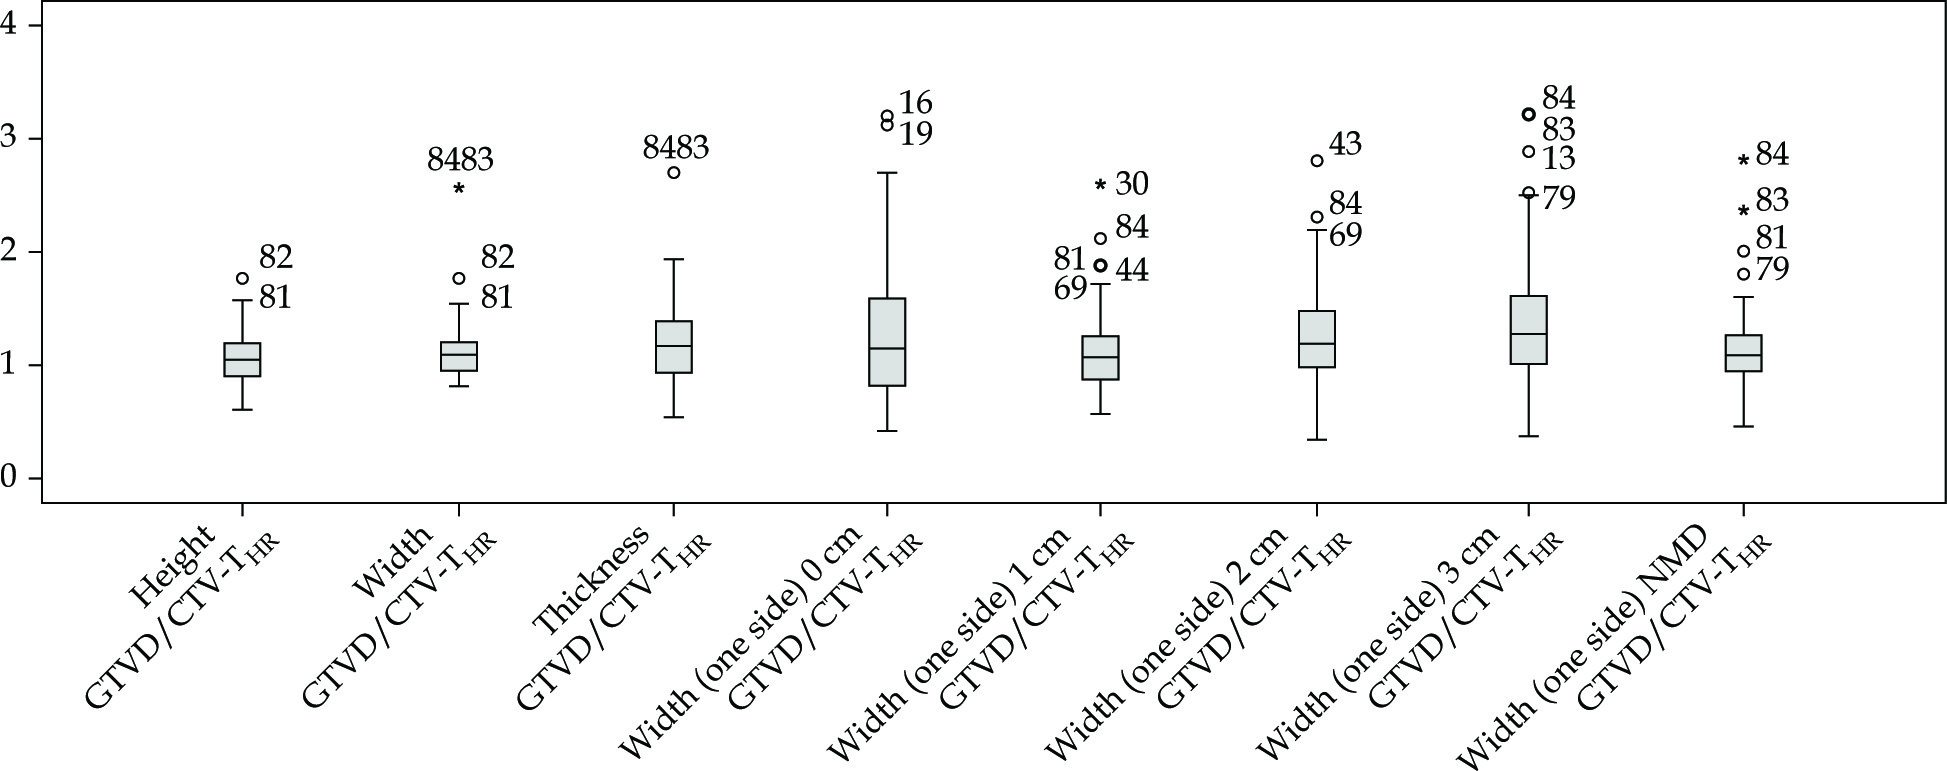
The ratio of height, width, and thickness of GTVD with CTV-THR and CTV-TIR, and the ratio of width of GTVD with CTV-THR at 0, 1, 2, and 3 cm, and at NMD, has been calculated by a simple boxplot for visual impression of relationships (Figure 2). It shows that the ratio of height and the total width of GTVD and CTV-THR obtained a value approaching 1 in many cases; however, the interquartile range of values were wide. Therefore, a definite relation could not be drawn. When considering width on individual side, this range of variation between GTVD and CTV-THR was still bigger.
Discussion
Clinical drawings and mapping of disease at diagnosis and during BRT – interpretation of the qualitative results
Here, we present a developed customized clinical drawing for tumor mapping and documentation, which is less prone to subjective errors. Dimensions of GTVD in the drawing is based on incorporation of dimensions of the disease at diagnosis. This objective validation of GTVD mapping was proved by the fact that after the schematic drawings done by the second author, independent verification by the first author and the most senior author of the manuscript found the dimensions acceptable. According to the GEC-ESTRO definition, pre-external beam radiotherapy (EBRT) disease is qualified as CTV-TIR, and it harbors microscopic disease. In the recent years, CTV-THR was more often used for prescribing and reporting a dose in IGABT. Nevertheless, CTV-TIR is documented in IGABT and theoretically, it is a robust concept, which embraces microscopic disease and aim to deliver a total of 60 Gy EQD2 dose, as a minimum [8]. Therefore, its identification from pre-clinical gross volume (when MR during brachytherapy is not available) could be helpful. A qualitative analysis of maps shows that in many cases, CTV-THR and CTV-TIR overlaps GTVD with some deviations. Further, the variations can be minimized after classifying residual disease during BRT into various groups, based on disease at diagnosis and response categorization.
Residual disease, to which BRT is adapted, is essentially a function of two major disease characteristics, including disease burden at diagnosis and response to initial chemoradiotherapy (CTRT). In fact, the importance of these disease characteristics has been previously recognized and their impact, not only on local control but also on overall survival (OS), has been acknowledged. Three-dimensional tumor volume at diagnosis has shown to significantly impact outcomes, including OS, in patients with advanced cervical cancers, unrelated to FIGO stage [9-11]. The Vienna group has shown that it is the volume of disease at diagnosis and the function of response to CTRT, which determine brachytherapy management to a greater extent than FIGO staging [4].
While MRI remains the gold standard for contouring, CTV-THR for 3D-IGABT, CT-based delineation of CTV-THR may be applied in situations with limited imaging resources [12]. Documentation and mapping of a disease is a vital step in cervical cancer image-guided adaptive brachytherapy. Studies from the Vienna group show that incorporation of clinical findings during brachytherapy to CT images during first brachytherapy session, increases the assessment of CTV-THR [13]. Hegazy et al. reported that to arrive at a clinically acceptable accuracy, such CT contouring, needs to be always based on a comprehensive 3D documentation of repetitive gynecological examinations [12]. Summary of tumor dimensions may help the physician to improve clinical examination during brachytherapy and assist in appropriate BRT application. We acknowledge that BRT applicator can be defined based on pre-BRT MRI; however, this is not feasible in majority of the centers, where MRI units are not accessible. Ideally, it would be to perform real-time imaging for applicator selection and MR imaging with BRT applicator in place. Our study could help to improve existing BRT environments, and improve quality of BRT practice in a non-MRI environment during brachytherapy.
Quantitative analysis
The mean and median values of total width, thickness, and height of GTVD follow that of CTV-THR and CTV-TIR. There was a significant correlation of height, width, and thickness among GTVD, CTV-THR, and CTV-TIR. The correlation was strongest with height (Table 1), and the ratio of GTVD/CTV-THR was 1.1 ±0.2, which could help to presume that the height of the disease at diagnosis may be taken as the height of HR-CTV during brachytherapy. This is not true with other dimensions, including width and thickness, possibly due to a significant deformation of the anatomy as a response to external radiotherapy and chemotherapy. Table 2 shows if the response of EBRT was poor (group 5), the width of CTV-THR was more consistent with the width of disease at diagnosis. While for the group 4, there was learning curve, which may require grouping as well as more diligent assessment, particularly the width and NMD’s of right and left sides. There is a growing experience and current area of research, especially for alternate imaging modalities other than MRI.
In Table 3 (n = 84), the maximum width in any direction (right or left) of CTV-THR and CTV-TIR follows GTVD, and when the mean or median value of the samples are considered, the standard deviations of such mean values are high, ranging from 5 mm to 10 mm. Therefore, the relation between width of CTV-THR and GTVD was not predictable. It was understood that extrapolation of CTV-THR and CTV-TIR from GTVD needs other complimentary imaging during BRT. Also, we feel that if we were able to achieve a reasonable accuracy and strong correlation between GTVD and CTV-TIR in terms of NMD’s (right and left), this could assist in optimizing treatment plans to achieve the best possible constraints of CTV-TIR and possibly HR-CTV. NMD’s are useful in defining the disease extent into the parametria, which helps to understand and refine total width of the tumor. Right and left NMD’s in relation to the external os or uterine canal, provide better understandings of the involvement of individual parametrium. This information is vital during BRT to decide an appropriate BRT application, especially intracavitary + interstitial type. The width of NMD can also assist to define the adequacy of needle placement, such as medial and/or lateral planes for needle insertion, and help to reduce uncertainties associated with delineation of the width during BRT in a CT environment.
There have been several attempts to evaluate and define methodologies for CT imaging contouring [13-15]. Similar attempts to use ultrasonography (USG) for defining CTV-TIR were also published [12, 16, 17]. The exact pre-EBRT documentation of disease, along with the use of information from USG and CT scan, would help to implement IGABT with more confidence in the centers with less availability of MRI facilities. The present study and this exercise of using clinical drawings were performed to understand and evaluate correlation between pre-EBRT tumor dimensions and BRT-related target volumes. In IGABT processes, target contouring is associated with some uncertainties depending on imaging planning performed. These measures are significant steps towards reducing major uncertainties related to non-MRI environment of IGABT in cervical cancers patients. An example of use of clinical drawings and significant correlation between MRI and CT-based CTV-HR has been reported [18]. This was further investigated and resulted in upcoming guidelines [7, 19]. Such meticulous schematic information collection and exercises can help to select BRT technique (intracavitary [IC] alone/IC + interstitial [IS]), which would reduce uncertainties related to contouring during BRT both for MRI and non-MR imaging-based BT. Further, it would assist during planning and plan evaluation by reducing contouring uncertainties, especially in lateral edges of the target. Recently, the use of modified drawings, NMD’s, and patterns of regression information has been recognized as vital information, and has been proposed in the recent IBS GEC-ESTRO ABS recommendations for CT-based contouring in IGABT for cervical cancer patients [20].
Nevertheless, further studies with larger cohort of patients and imaging sets are warranted to further validate the use of modified clinical drawings.
In conclusion, the qualitative and quantitative analysis of using modified clinical drawings confirms the correlation of CTV-THR with GTV at diagnosis in IGABT environment for cervical cancer. Mapping of various volumes related to cervical cancers during external beam and brachytherapy on the modified clinical drawings, provides important insights towards achieving a comprehensive and optimum IGABT approach, including objective response evaluation, appropriate BRT applicator selection, objective target volume delineation, etc.


