
Purpose
Melanoma is a melanocytic and rare malignancy with poor survival [1]. Ocular melanoma is the most frequent type of melanoma after cutaneous type, occurring in 5% of all melanoma cases, and represents approximately 85% of all primary intraocular tumors in adults [2]. It can be located throughout the uveal tract (the iris, ciliary body, and choroid). The incidence is 6 to 7 cases per million inhabitants per year, and the average age of onset is 60 years [3, 4].
The malignant capacity of ocular melanoma depends on histopathological factors at the time of diagnosis, such as size, location, extra-scleral extension, rapid growth, invasion of the ciliary body, lymphocytic infiltration, morphology, cell type, abnormalities in chromosomal and genetic profile, among others [5-7].
In the collaborative ocular melanoma study (COMS), plaque brachytherapy is shown to play a major role in the management of posterior uveal melanoma [8, 9]. Following the COMS classification, based on tumor apical height (TAH) and largest basal dimension (LBD) system, brachytherapy is indicated in the following conditions: small melanomas (1-2.5 mm TAH or 5-16 mm LBD) with a documented tendency to grow or clear signs of activity, all medium-sized melanomas (2.5-10 mm TAH or 16 mm LBD), and various large melanomas (> 10 mm TAH or > 16 mm LBD), with a reasonable potential for visual conservation provided patient agreement [10, 11]. Nevertheless, certain peripapillary tumors, blind and/or painful eyes, etc., may not be appropriate for plaque therapy according to the American Brachytherapy Society [12, 13].
There are some indications, in which the response to treatment depends on the initial size of tumor. Rate of regression in the initial phases after treatment is greater when TAH of the tumor is greater [14], maybe it is because larger tumors are likely to have larger hypoxic regions, which are likely to be more radioresistant [15]. Even more, Kaiserman et al. [16] found that tumors with faster decrease until stabilization were more susceptible to metastasize.
In the group of medium melanomas, according to the COMS classification, clinicians in our institution noticed a trend, in which larger tumors (6.25 to 10 mm TAH) appeared to have better local control than smaller tumors (2.5 to 6.25 mm TAH). The purpose of the present study was to analyze regression rates for patients’ sub-sets based on initial tumor height (h0), and whether these rates could be predictive of local control following iodine-125 (125I) plaque radiotherapy.
Material and methods
Patients diagnosis, treatment, and workflow
All patients were initially evaluated and diagnosed with uveal melanoma by an ophthalmologist with expertise in ocular oncology. The diagnosis of choroidal melanoma and dimensions of lesions were confirmed with ophthalmoscopic and ultrasonographic findings.
An ophthalmologist and oncologist contoured the target according to ultrasonographic findings, and the plaque size was chosen sufficient to encompass the basal margin. At time of diagnosis, all patients were evaluated by liver ultrasonography, chest radiography, and blood tests. Brachytherapy was performed according to a standard protocol following the American Brachytherapy Society guidelines [12, 13].
The workflow comprised five main steps [17]: 1) Multidisciplinary tumor board: case presentation and treatment choice; 2) Treatment planning: plan calculation and pre-plan approval; 3) Source preparation: applicator loading and sterilization; 4) Surgery: plaque implantation, treatment; 5) Plaque removal: if the lesion was near the muscle insertion area, the muscle was temporarily removed.
Data collection and patient follow-up
Data were collected from an intraocular tumor-dedicated database, which was part of a prospective study in our center for the last 20 years. Patients treated with 125I (ROPES [18] and COMS [19]) plaques for uveal melanoma were included into this study, from January 1st, 1996 to 2019 at the Intraocular Tumors Unit Valladolid University Hospital. Patients treated with brachytherapy for iris and those treated with transpupillary thermotherapy (TTT) prior to brachytherapy were excluded.
Regular follow-up was scheduled at 1, 3, 6, and 12 months, every 6 months from 1 to 5 years after therapy, and yearly thereafter if local control was achieved. In practice, the number of follow-ups may be more frequent during the first 5 years, mainly due to special monitoring of some of the patients, and also follow-up times may vary due to hospital planning.
Patients’ data included demographics (age and gender) and tumor characteristics (size by COMS criteria, apical height, longest basal dimension, laterality, length, latitude, location of anterior tumor border, location of posterior border, tumor shape, and juxtapapillary localization). All patients signed an informed consent form for the treatment after being appropriately informed about possible side effects. The study protocol and data collection were approved by the institutional research committee. The whole process was in accordance with national data protection laws, and the ethical principles of the Helsinki Declaration were followed.
Clinical target volume definition and dosimetry
Tumor shape and clinical target volume (CTV) was defined by a radiation oncologist taking into account the tumor thickness from an AB-scan sonography images and safety margin extension of 2-3 mm for the tumor basal dimension [20]. Planning target volume (PTV) could be added by the radiation oncologist in case of doubts in plaque localization or tumor delineation [21]. The prescription dose was 85 Gy to the tumor apex using the COMS dosimetry assumptions and plaque construction techniques [12]. The 85 Gy isodose line should pass through the prescription point and encompass PTV. Patients who did not meet all assurances regarding target coverage, especially patients with large tumors, were not treated with brachytherapy.
Dosimetry and three-dimensional reconstruction were performed by a computer system developed by Dr. Astrahan at the University of California (BEBIG Plaque Simulator, version 2.16) [22]. Seed Amersham model 6711 [23, 24] and BEBIG model I25.S16 [23, 24] were used for ROPES and COMS plaques, respectively. Plaque arrangements could differ in varying source strengths and ring sizes.
Calculations were based on the reports of the American Association of Physicists in Medicine Task Group No. 43 [23, 24]. The dosimetry was performed consistently throughout the studied period. Corrections were made to the protocol to consider changes in the dosimetry collected in TG-43 U1 [24], but the rest of assumptions remained invariant in time. Plaque heterogeneity correction functions were incorporated in the treatment planning. Global attenuation factor, which considered the effect of eye plaque seed carrier and dose collimation by the lip on gold-alloy backing were also enabled. An independent check of treatment time by redundant calculation was performed.
Before the treatment, the following information was determined: treatment duration, plaque size, number of seeds, total air kerma rate of the plaque, and distribution of seeds required to provide the prescribed dose to the PTV. We also collected initial dose rates and doses to the prescription point, eye center (EC) (12 mm from plaque center), sclera (1 mm from plaque center), and critical structures within the eye, such as lens (center of plaque to center of lens), optic disc (center of plaque to center of optic disc), and foveola (center of plaque to center of foveola).
Tumor apical height was assessed with standardized B-scan ultrasonography, measurement, and percentage of original TAH at each time interval (ht). Percentage of original tumor height was calculated as Δh = 100• (ht – h0)/h0 and collected for each patient during follow-ups.
Local recurrence was diagnosed if the tumor growth was greater than 1 mm in TAH and/or 2 mm in base in two consecutive visits, as documented by ultrasound and/or retinography.
Statistics analysis
Clinical and radiotherapy data were extracted from a dedicated prospective database. We divided the sample of patients into 4 sub-groups depending on the initial TAH of the tumors (h0), including h0 ≤ 2.5 mm, 2.5 mm < h0 ≤ 6.25 mm, 6.25 mm < h0 ≤ 10 mm, and h0 > 10 mm. We chose the value of 6.25 mm because it is the mid-point between 2.5 mm (small tumors) and 10 mm (large tumors). A descriptive analysis was performed with the studied variables, using mean, median, and interquartile range, and proportions for each group and each sub-group would be studied separately over 84 months (7 years) to validate response, no response, or equivalence.
Scatter plots of the mean percentage of original tumor height Δh against T was shown, and the degree of statistical correlation between the variables in a visualization by fitting line plots was identified for the first 7 years of follow-up. Associations with tumor regression were evaluated by means of mixed linear regression modeling. In order to find the most accurate best-fit line, exponential of three parameters, exponential of two parameters, linear, quadratic, and hyperbolic functions were selected.
Local control failure was defined as a progression in the height of tumor of 25% or more, an increase of some of its margins, or the presence of extrascleral extension, as in the COMS study [25]. A tumor regression was defined when the tumor height decreased by 25% comparing to the original tumor height before the treatment.
Local control-free survival was calculated by Kaplan-Meier method [26]. Independent predictive variables were determined using univariate Cox regression [27] to assess whether a non-tumor response has an influence on local control. Hazard ratio (HR) and 95% confidence interval (CI) for variables that showed a degree of correlation (p) were determined and included in the final multivariate model fitted variables, identified as significant predictors in the backward stepwise model.
All analyses were conducted using SPSS version 24.0 (IBM, Somers, NY, USA) and XLSTAT version 2016.02.28451 (Addinsoft) for Microsoft Excel (Microsoft Corp., Redmond, WA, USA). Statistical significance level was set at 0.05.
Results
Patients
From 1997 through June 2019, 284 patients with nevus were under observation, and 577 patients were diagnosed with iris, choroidal, or ciliary body nevus melanomas. 208 patients were enucleated as first treatment and finally, 369 were treated with brachytherapy. Among them, 25 patients (6.7%) were not eligible for the study because of ruthenium plaque treatment used, 20 (6.5%) patients were treated with TTT, and 19 (6.3%) cases had incomplete information or were lost to follow-up. Finally, 305 patients met the inclusion criteria. The median follow-up was 81.4 months (range, 3-254 months). Baseline patients’ demographic and tumor characteristics for the four sub-groups are summarized in Tables 1 and 2. At the last follow-up, 11 of 305 (3.4%) patients presented local control failure. Actuarial Kaplan-Meier analysis showed a local control rate at 7 years of 94% (95% CI: 91-97%).
Table 1
Patient and tumor summary statistics for 305 eligible cases. Qualitative variables. Patient characteristics are summarized as proportions for categorical variables
Table 2
Patient and tumor summary statistics for 305 eligible cases. Quantitative variables. Patient characteristics are summarized as median, interquartile range (IQR), and standard deviation (SD) for continuous variables
Sub-group 1: Initial height h0 < 2.5 mm (small)
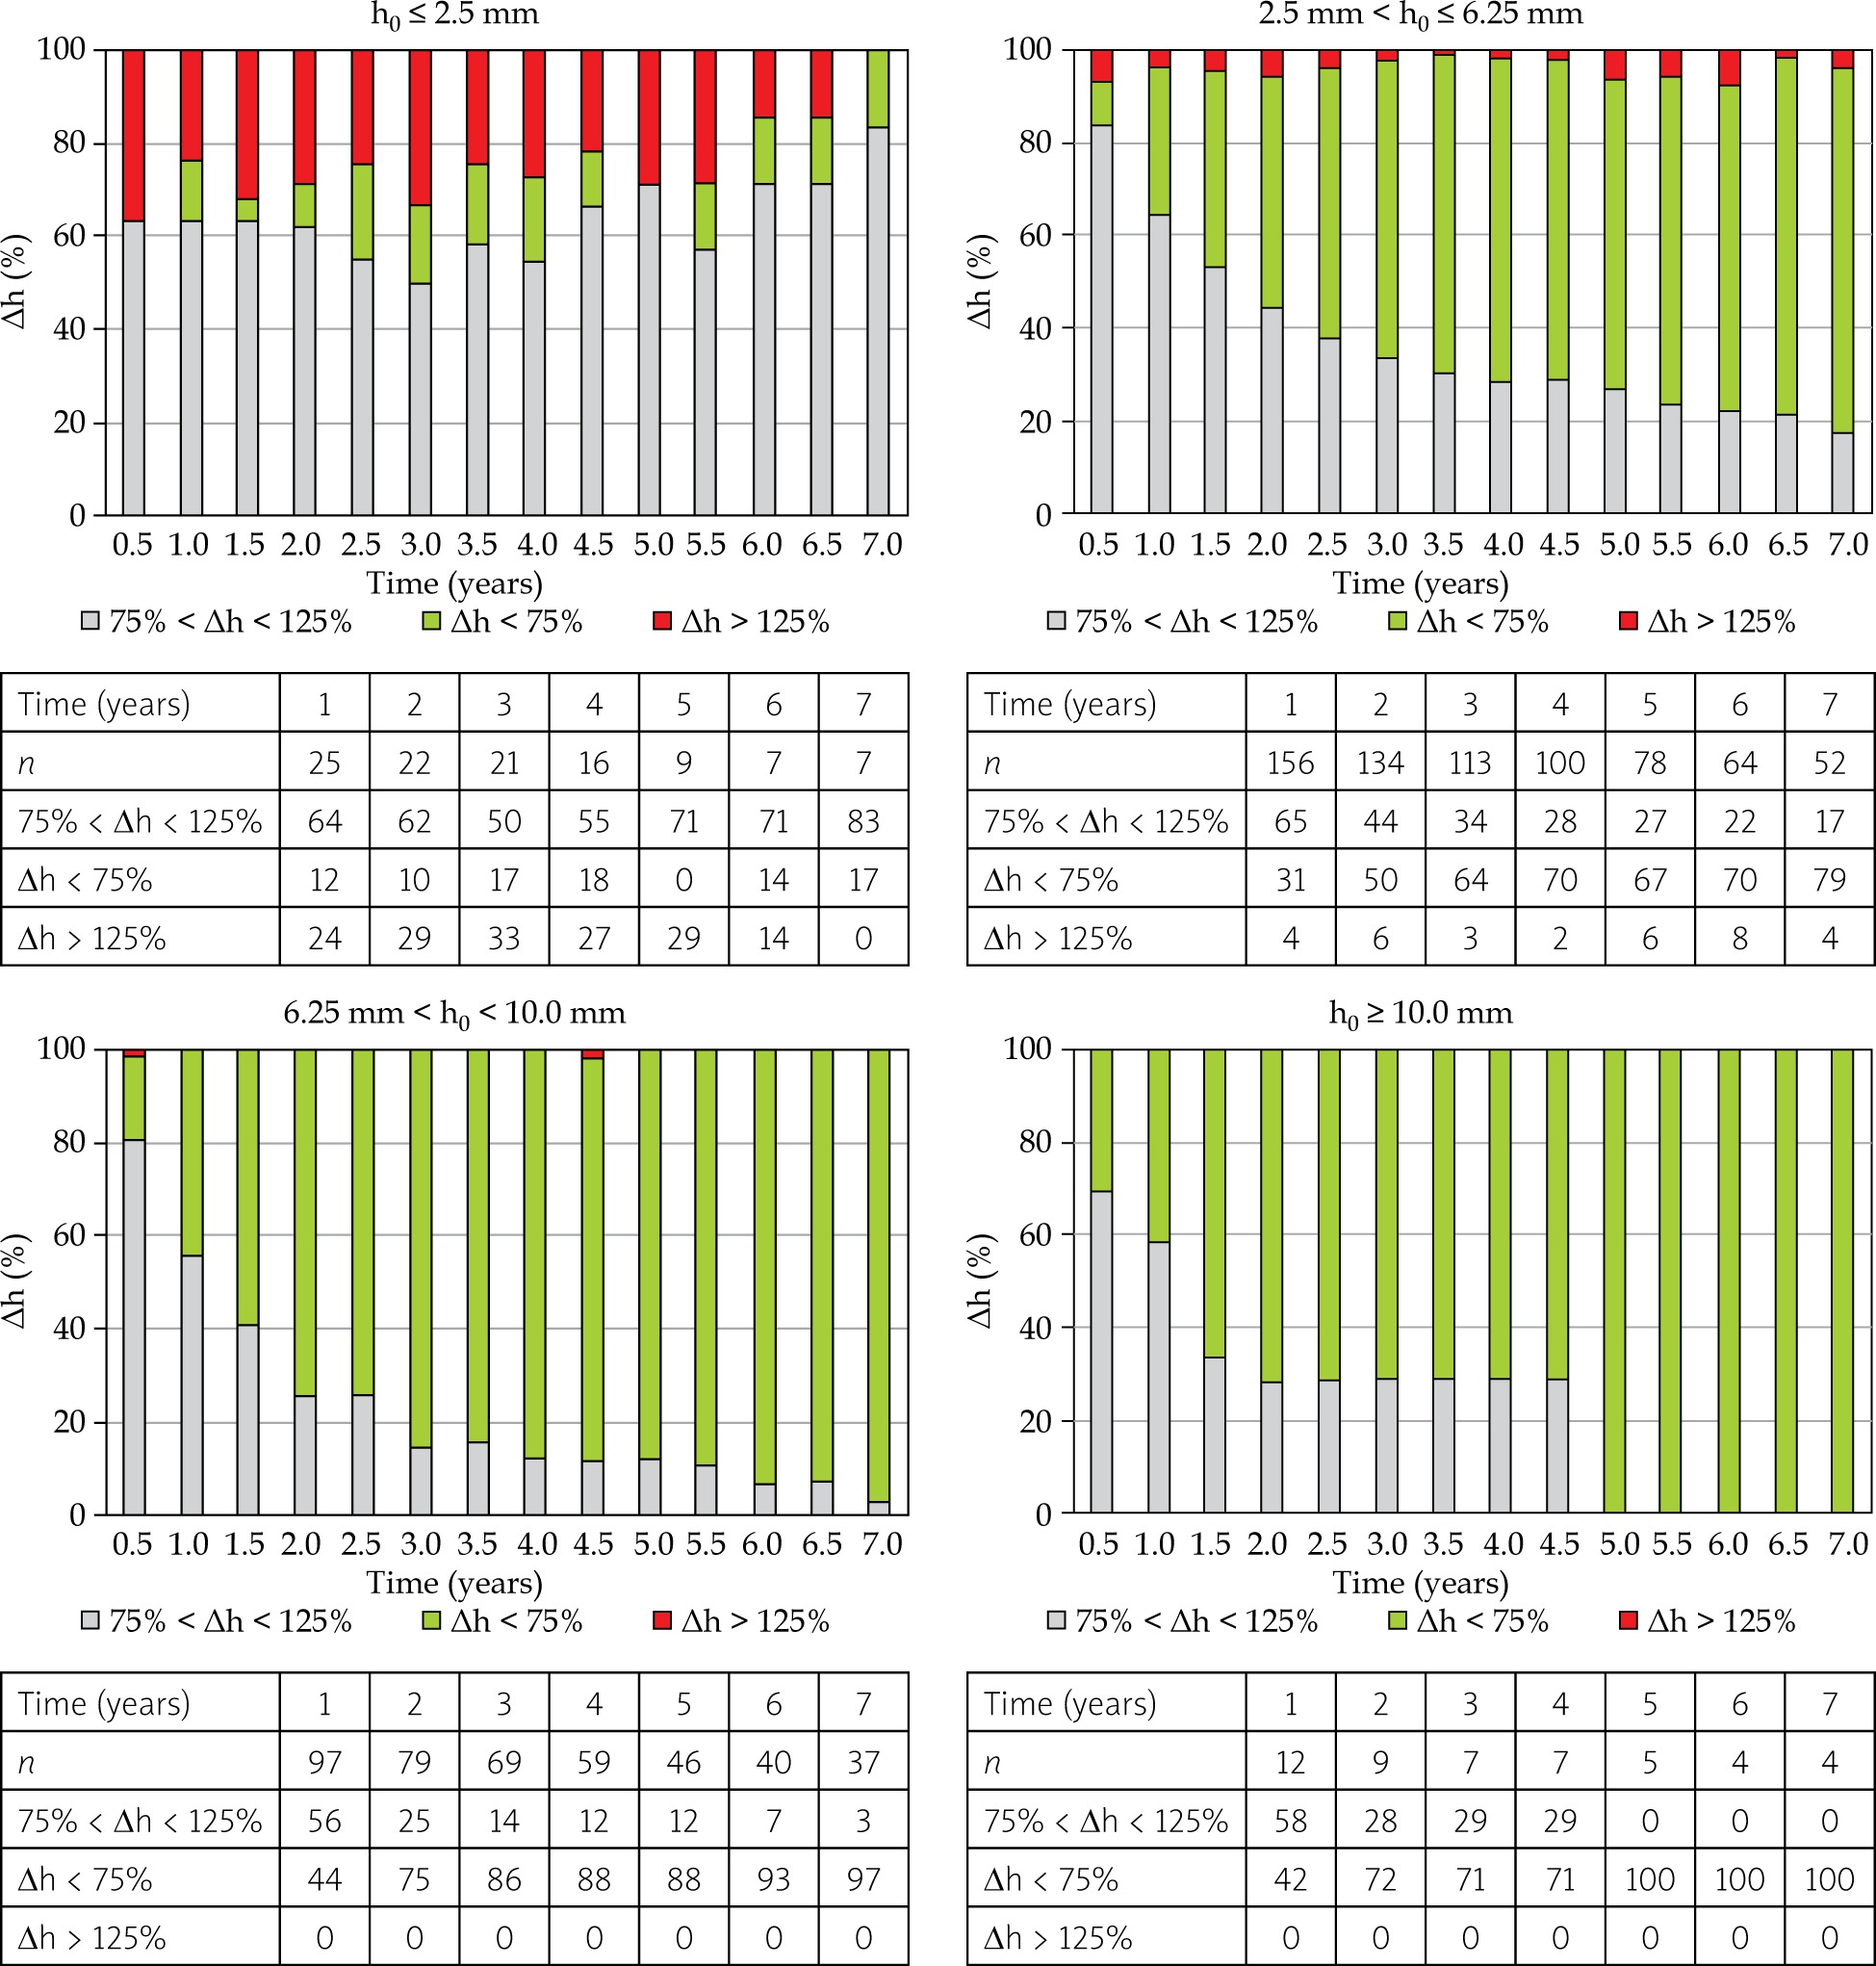
27 of 305 patients were included in this sub-group (8.8% of the total cohort). The median follow-up was 56.8 months (range, 4-162 months). Only a third of the tumors presented a response at 3 years after the treatment. The number of patients who did not respond or whose TAH remained similar was 83%, with a follow-up of 7 years (Figure 1).
Fig. 1
Variation of height (Δh) vs. time in years depending on their initial tumor height (h0). 75% < Δh < 125%, Δh < 75%, and Δh > 125% indicate similar height, decrease, and progression, respectively. T is the time from brachytherapy in years, n is the number of patients in each temporal period, percentages of each situation are shown in rows below; Abscissa – time in years, Ordinate – percentage of patients
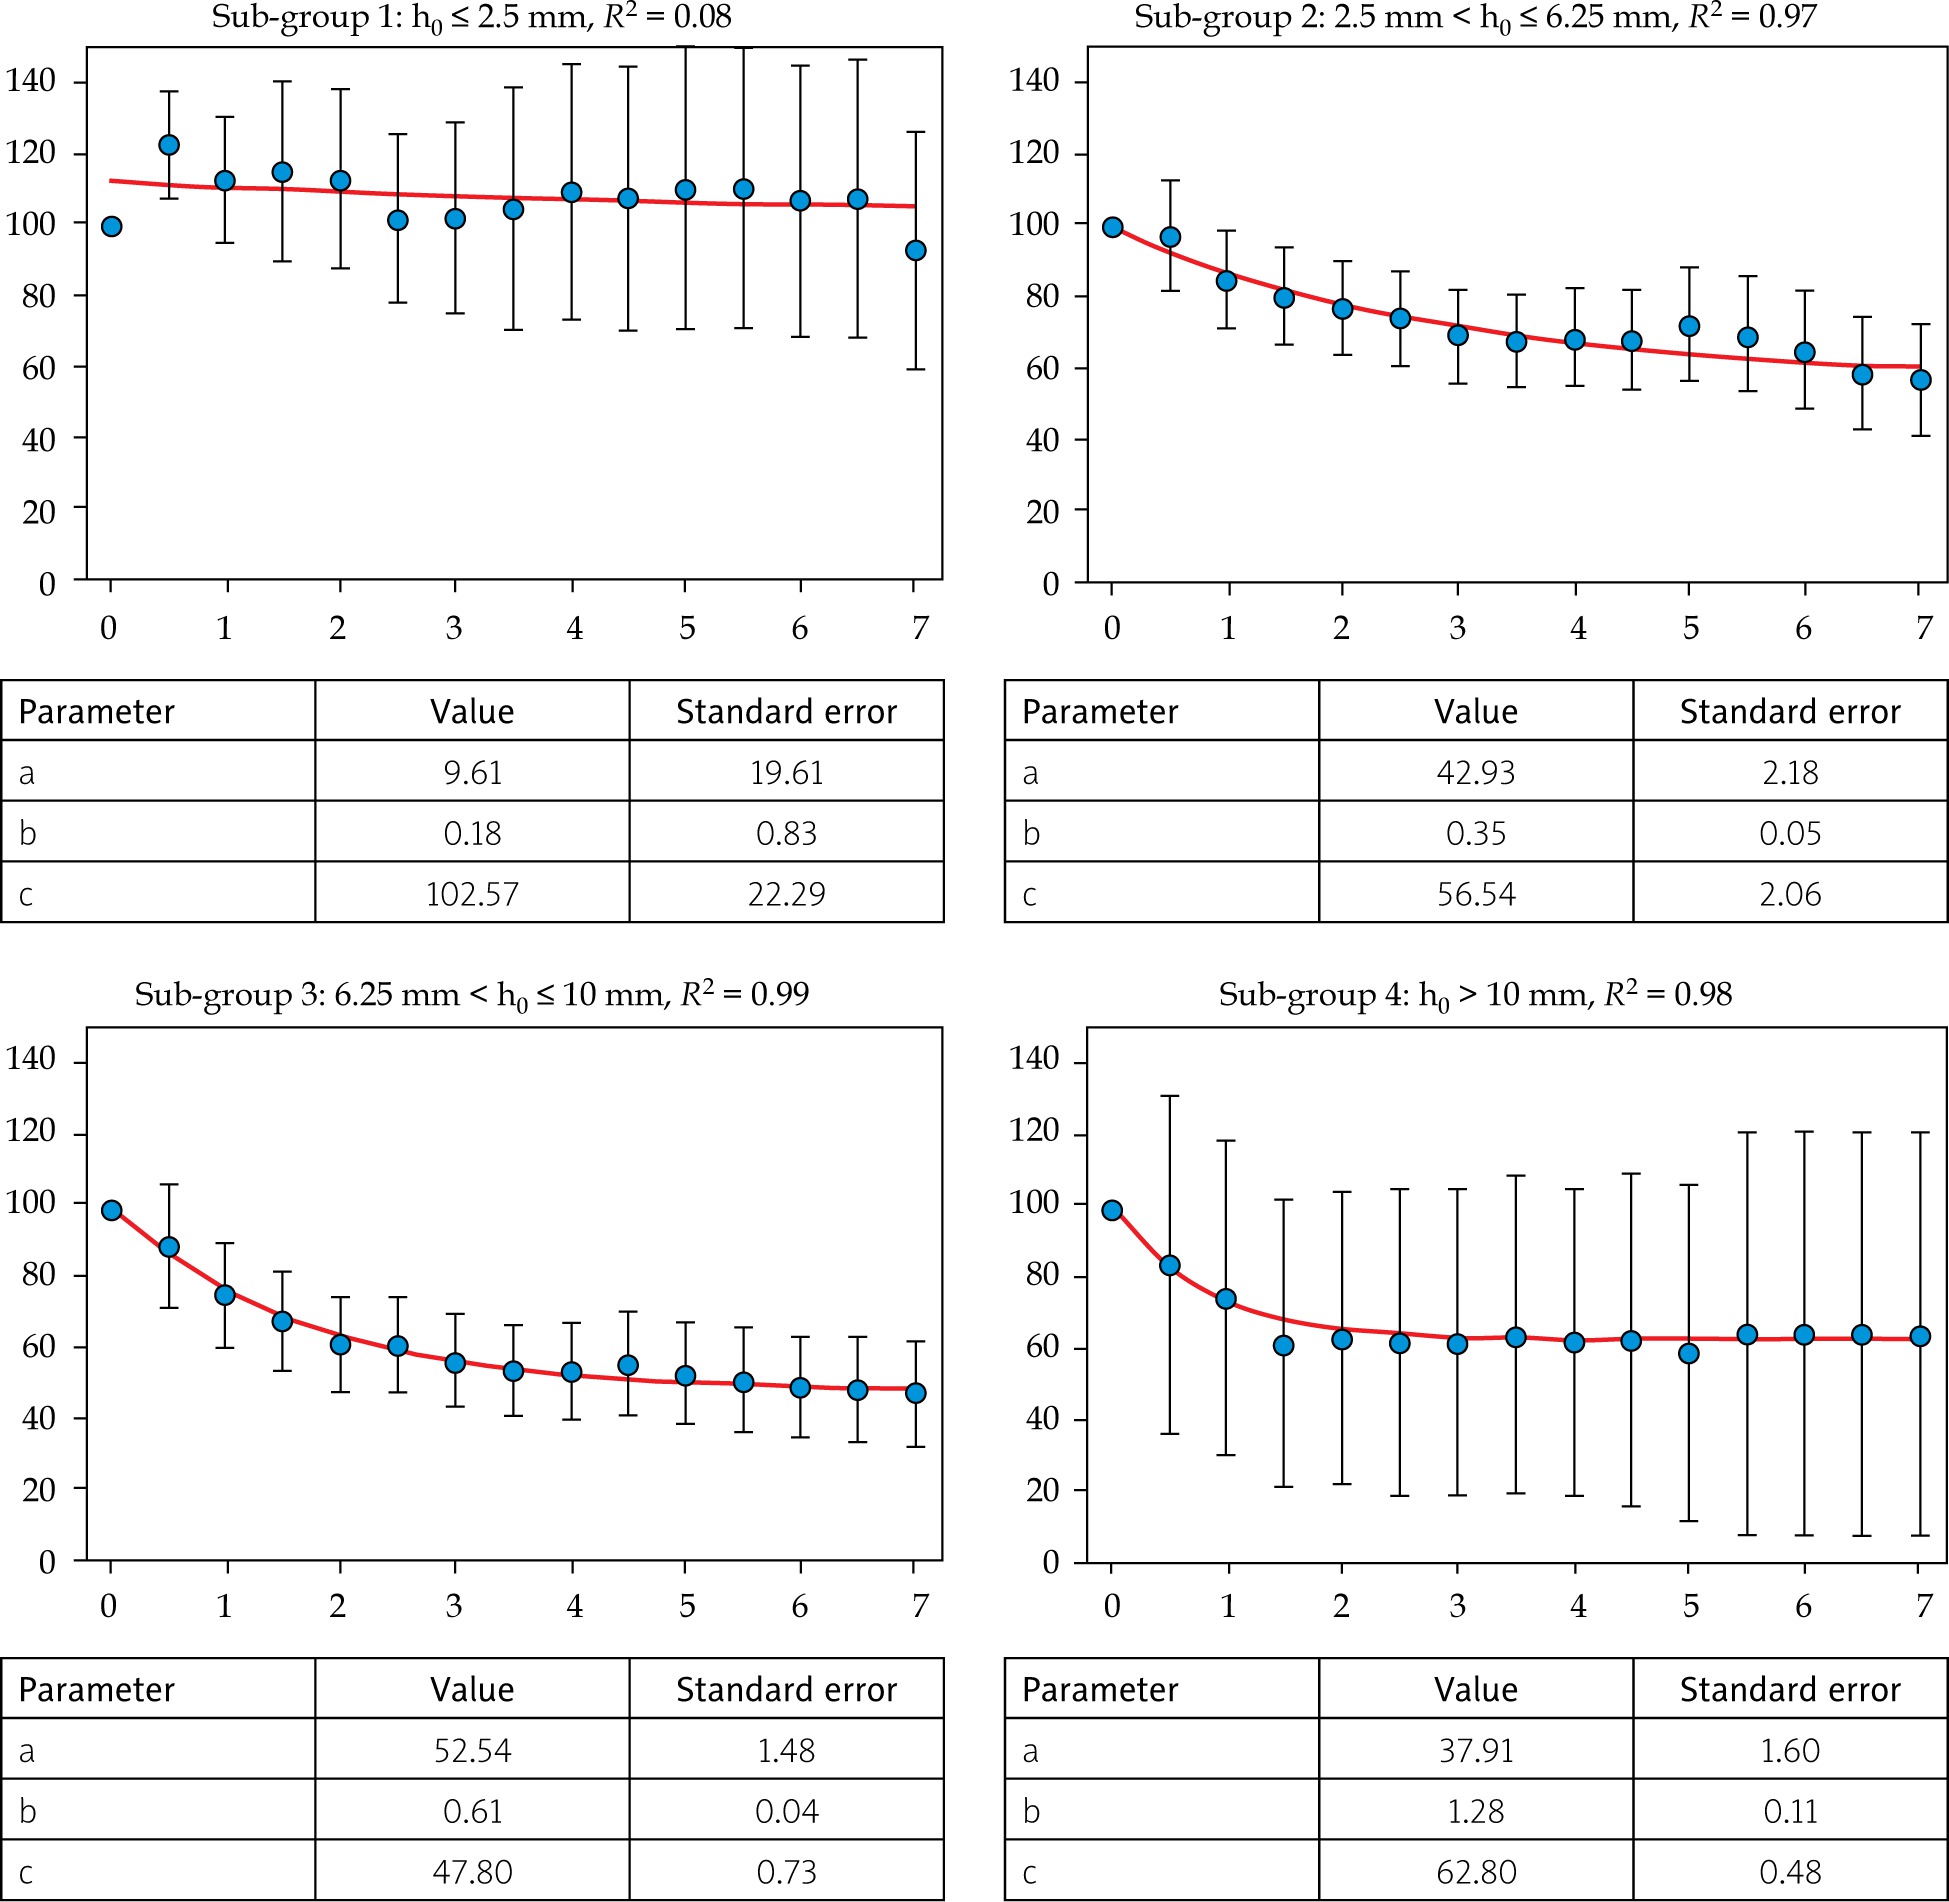
Two-dimensional scatter plot of Δh vs. T (years) and the best-fit curve are presented in Figure 2. None of functions tested yielded statistically significant similarity coefficients. The exponential model: Δh (T) = ae–bT + c, being a, b, and c parameters, was the chosen one in line with the adjustments made for the following sub-sets. Coefficient of correlation was R2 = 0.08. Fit values and standard errors (SE) were a = 9.61 (SE, 19.61), b = 0.18 (SE, 0.83), and c = 102.57 (SE, 22.29). The coefficient of correlation for the other functions tested (in the same order as described in patients and methods) were R2 = 0.07, R2 = 0.07, R2 = 0.08, and R2 = 0.05, respectively.
Fig. 2
Non-linear regressions for height progression in patients depending on their initial tumor heights (h0). For all plots: Abscissa – time in years, Ordinate – Δh defined in the present manuscript. Best-fit (red line) corresponds to the exponential model with the following functional form: Δh (T) = ae–bT + c, R2 is the coefficient of correlation. Vertical black lines are the confidence intervals (CI) where the margin of error is given by derived from the standard normal curve and the standard error of point estimate
At the last follow-up, only 1 patient (4% of sub-group) had a failure of local control (TAH growth) for small-sized tumors. Kaplan-Maier analysis showed that small tumors had a local recurrence-free survival of 88% after 5 years since the treatment. Cox analysis did not indicate statistical significance in any single variable.
Sub-group 2: Initial height 2.5 mm < h0 < 6.25 mm (small-medium)
166 of 305 patients were included in this sub-group (54.8% of the total cohort). The median follow-up was 76.1 months (range, 3-254 months). The number of patients with a decrease in TAH greater than 25% in this sub-group was 79% after 7 years since the treatment (Figure 1).
Two-dimensional scatter plot of Δh vs. T (years) and best-fit curve are presented in Figure 2. The exponential model of three parameters: Δh (T) = ae–bT + c was the chosen one, with a coefficient of correlation of R2 = 0.97. Fit values and SE included a = 42.93 (SE, 2.18), b = 0.35 (SE, 0.05), and c = 56.54 (SE, 2.06). The coefficient of correlation for the other functions tested were R2 = 0.90, R2 = 0.86, R2 = 0.95, and R2 = 0.96, respectively.
Local failure was documented in 7 patients (2 TAH growth, 5 LBD growth), 4% of the sub-group. Local recurrence-free survival at 5 years was 94% using Kaplan-Maier analysis since the treatment. Cox analysis presented statistical significance in predictive local control failure with a value of HR: 6.1 (95% CI: 0.7-58.2%; p = 0.05) for those who remained similar-sized after the treatment (125% < Δh < 75%) until last follow-up. Cox analysis did not indicate statistical significance in any other single variable analyzed.
Sub-group 3: Initial height 6.25 mm < h0 < 10 mm (medium-large)
100 of 305 patients were included in this sub-group (32.8% of the total cohort). The median follow-up was 89.1 months (range, 3-224 months). The number of patients who responded to radiotherapy was increasing, exceeding 97% after 7 years since the treatment (Figure 1).
Two-dimensional scatter plot of Δh vs. T (years) and best-fit curve are presented in Figure 2. The exponential model of three parameters Δh (T) = ae–bT + c was chosen, with a coefficient of correlation of R2 = 0.99. Fit values and SE were a = 52.54 (SE, 1.48), b = 0.61 (SE, 0.04), and c = 47.80 (SE, 0.73). The coefficient of correlation for the other functions tested were R2 = 0.81, R2 = 0.73, R2 = 0.93, and R2 = 0.97, respectively.
Local failure was documented in one patient (TAH growth), 1% of the sub-group. Local recurrence-free survival at 5 years was 99% using Kaplan-Meier analysis since the treatment. Cox analysis did not indicate statistical significance in any single variable.
Sub-group 4: Initial height h0 > 10 mm (large)
13 of 305 patients were included in this sub-group (4.3% of the total cohort). The median follow-up was 100.1 months (range, 3-146 months). None of the tumors grew after the treatment, and the fraction of responding tumors increased five years post-treatment, and all tumors had responded (Figure 1). The exponential model of three parameters Δh (T) = ae–bT + c was the best one once more. The coefficient of correlation was R2 = 0.98. Fit values and SE included a = 37.91 (SE, 1.60), b = 1.28 (SE, 0.11), and c = 62.80 (SE, 0.48). The coefficient of correlation for the other functions tested were R2 = 0.42, R2 = 0.40, R2 = 0.73, and R2 = 0.74, respectively.
Local failure was documented in two patients (both LBD growth), 15% of the sub-group. Local recurrence-free survival at 5 years was 84% since the treatment. Cox analysis did not indicate statistical significance in any single variable.
Discussion
Brachytherapy, along with other radiation modalities, such as proton and other particle therapy (carbon, helium in the past) as well as stereotactic radiation, are all good alternatives to surgery for medium-sized tumors. Brachytherapy has been proven to be very effective and safe way of treatment, providing a good alternative to surgical removal of the eye. In previous studies with a smaller sample of patients, we have reported results in terms of visual acuity outcome [28], local failure, globe preservation, mortality, local control [29], and toxicity [30]. However, there is no gold standard for tumor basal diameter measurement, and these data may be imprecise and impractical in some cases [12]. In various patients, due to spherical shape of the eye, the measurement of LBD can be underestimated [31], resulting in imprecise quantity, particularly for larger tumors [32]. TAH measurements are less likely to present this inaccuracy [31]; however, it is also challenging to measure the correct dose depth with 2-dimensional ultrasound method [33]. Despite this, TAH changes are the main measure of tumor regression.
On the other hand, the American Joint Committee on Cancer has published its staging system based on the TNM concept to unify risk features into a single classification system. In this classification, there is large number of factors to predict the survival of patients [34, 35]. Alternatively, COMS classification based on tumor base and height measurements, have proven validity as treatment and prognostic indicators. Both classifications include very wide range of heights in medium-sized tumors, which constitute the majority of tumors treated with brachytherapy.
The original hypothesis of the present study was whether initial height of tumor predicted tumor regression after treatment in patients divided into sub-groups according to the height. Although tumor regression has been extensively studied, the influence of initial height on the final height of tumors has not been widely considered. Only Demirci et al. [14] addressed that issue, but classification of studied group was performed differently and did not include big tumors.
Several studies considered tumor size as a feature related to local control and prognosis [25, 36-39]. Cruess et al. pointed out that regression of tumors never ends in a flat and depigmented scar [40]. It was found that an average uveal melanoma did not regress rapidly in a flat scar, but in a slow and persistent manner, resulting in a residual mass of roughly 50% thick of the original tumor following cobalt-60 plaque radiotherapy [40]. Abramson et al. [41] classified tumors into three categories according to their behavior after treatment. The first and more common is the one that shows a progressive regression after treatment. In this category, there are also various small tumors that remain stationary until they disappear after many months. The second group in frequency are tumors that have not responded and whose prognosis is uncertain. The third and last group in frequency are these tumors, whose TAH increases progressively after treatment, until half of them metastasize from a distance. Rapid and marked regression of tumor after brachytherapy is an independent factor of poor prognosis [41]. The rate of regression in the first 3 months after treatment is an indicator of metastases, which compromise survival [42]. Recently, Tagliaferri et al. confirmed that a personalized re-treatment approach with plaques may offer high probability of tumor control and eye preservation [43].
Therefore, tumor regression pattern after radiotherapy is complex and depends on many factors, such as radiosensitivity of the tumor cells and their cell death kinetics, ability of the tumor to remove dead cells, tumor stroma, and reaction of the host against residual tumor [44-49]. It is well-known that larger tumors are more prone to contain hypoxic regions, which are likely to be more radioresistant [50]. However, due to steep depth dose fall-off in plaque brachytherapy, bases of larger tumors receive a considerably larger doses than bases of smaller tumors, and this may improve tumor control.
Previously, we have shown that tumor regression is higher for larger tumors and slower for small ones [14]. In spite of that, TAH regression does not guarantee local control because growth can occur at the base edges of tumor, indicating that the tumor is actually active. On the opposite, although the tumor remains the same in TAH, it can be observed by ophthalmoscopy that is in an inactivated state. In some cases, despite increased TAH (more than 125%), this may be not considered a failure in the local control because it can be produced by inflammatory and/or necrotic events. In addition, the accuracy in measures of small tumors is more difficult and, in many cases, may lead to miscalculations. A change of height by 0.5 mm in a tumor of 2 mm represents a 25%, so these measures should be taken with caution. As a result of resolution of measurements for small tumors (h0 < 2.5 mm), we could not conclude any clear evidence because the regression adjustments were not strong enough and did not show a progressive regression. Small tumors growth in the first months is possibly due to an inflammatory process that comes from the treatment and the height remain the same on average, but without a clear regression curve. Small tumors tend to change and scar less [51]. Another possibility for the poor results for small tumors is that underlying blood supply might be less affected, since the dose to that part of retina depends enormously on the prescription point. The further that point from the retina, the higher the dose in the retina. The relatively low recurrence-free survival after 5 years (88%) may be because 15% of them were in juxtapapillary localization with a worse prognosis [29, 52, 53] and lower height, as in Quivey et al. [54]. Moreover, since the spatial resolution of height determination would be a greater fraction of the tumor height for small tumors, this may be the reason why no change in height was observed for small tumors in the analysis.
Among medium-sized tumors (the COMS classification), those with an initial TAH less than 6.25 mm had a low regression rate, and the remaining tumors with a similar size multiplied by 6 the probability of failure in local control. The only treatment parameter of importance in this sub-group was that the prescription dose was 85 Gy at the apex of tumor instead of 85 Gy at 5 mm from the tumor, as recommended by the COMS protocol for tumors smaller than 5 mm. These medium tumors larger than 6.25 mm and smaller than 10 mm had a higher percentage of response than the previous ones, and a faster TAH regression.
Large tumors had a very high percentage of response and their TAH decreased in all cases studied after 7 years; however, there was a failure in local control, which was higher than the other tumors sizes. Kowal et al. [55] noted that in tumors with a height exceeding 10 mm or with bases larger than 15 mm, recurrences are more frequent. Therefore, not all tumors considered as medium decrease at the same rate and largest tumors decrease faster. For small-medium, medium-large, and large tumors, the adjustments had a high statistical significance and confirm that the higher the tumor, the greater the response and the more pronounced decrease of height. The residual value (c) corresponded to the final TAH when the time was long enough. In the cases studied, in all sub-groups, the final TAH ranged between 65% and 50%, confirming a tendency to remain stable after 5 years. Even more, a regression of larger tumors was faster, and the b coefficient from the adjustment rose when TAH increased.
The response to treatment ensures correct local control, except for large melanomas where, despite a tumor reduction, 12% of them had a recurrence at 5 years. The greatest local control (99%) was achieved in tumors with 6.25 mm < h0 ≤ 10 mm.
Study limitations
Cox model generally overestimated the probability of the event of interest, and therefore yielded misleading results in the presence of competing risks when there were few positive events [56].
Conclusions
The pattern of decrease in small tumors was not evaluable. For the remaining groups, tumor apical height changes can be modeled by a negative exponential function of three parameters, with a strong correlation for the first 5 years after the treatment, depending on the initial height for small-medium, medium-large, and large uveal melanomas. The decrease in tumor height may not be the only criterion to consider ensuring local control, especially for large melanomas.


