

Introduction
Immunoglobulin A (IgA) nephropathy (IgAN) is the most common form of primary glomerulonephritis (GN) [1, 2]. The signs and symptoms include abnormal urinalysis (proteinuria, erythrocyturia) and macroscopic hematuria associated with mucosal infections that usually lasts 2-3 days [3]. IgAN is particularly common in the Chinese population, where it accounts for 54.3% of all forms of primary GN [2]. In European countries, this percentage is 30-40% [1]. IgA nephropathy is observed predominantly in young men (in the 2nd and 3rd decades of life) but may also affect children over 4 years of age and less frequently even the younger population [3-5].
Henoch-Schönlein purpura (HSP), also known as IgA-associated vasculitis, is the most common form of vasculitis in children. Typical signs and symptoms include vasculitis in the skin, joints, digestive system, and kidneys [5].
IgA nephropathy was first described in 1968 by Berger and Hinglais as a disease associated with intercapillary deposits of IgA-IgG immune complexes [6]. Immunofluorescence microscopy described in their study still remains the gold diagnostic standard for this disease [6, 7]. Berger also found similar deposits in patients with Henoch-Schönlein nephritis (HSN), also known as IgA vasculitis nephritis (IgAVN) [6].
IgAVN and IgAN share a common histopathological picture and the same patient may present sequentially with each of them at different timepoints [8, 9]. In a published case report, after the same adenoviral infection, one of identical twins developed HSN (IgAVN) while the other developed IgAN [10].
It is now known that mesangial IgA deposits observed in immunofluorescence microscopy coincide spatially with the pathological form of this immunoglobulin, Gd-IgA1, visualized using KM55 mAb [11].
A genome-wide association study showed that the genetic basis for the increased Gd-IgA1 concentration in patients with IgAN is independent from loci associated with IgA and IgA deficiency, which demonstrates IgA independent regulation of Gd-IgA1 [12]. Gd-IgA1-related loci are located on chromosomes 7p21.3 and Xq24 and include C1GALT1 and C1GALT1C1 genes [12]. C1GALT1 encodes a protein responsible for a transfer of galactose from UDP-Gal to GalNAc-alpha-1-Ser/Thr in the heavy chain hinge region in the IgA1 molecule [12]. C1GALT1C1 encodes a protein required for the stability and full activity of galactosyltransferase [12]. Of the two IgA classes, only IgA1 is glycosylated in the hinge region. The sugars attached to the immunoglobulin hinge region can then be bound to sialic acid [5]. Disruption of post-translational IgA1 glycosylation may occur through galactosyltransferase dysfunction or premature binding of sialic acid to GalNAc that prevents galactose binding [5, 12]. This results in the formation of Gd-IgA1, which is the first stage of the development of IgA nephropathy [13].
An IgG autoantibody may be generated against the incorrectly formed Gd-IgA1 hinge region [5]. The type of IgA complexes differentiates HSP from HSN (IgAVN) [14]. Increased concentration of IgA-IgG complexes, in addition to IgA-IgA complexes, is observed only in the course of HSN (IgAVN) [14]. In vitro studies have shown that immune complexes consisting of Gd-IgA1 and anti-Gd-IgA1 IgG in the presence of HSF (heat sensitive factor) induce mesangial proliferation [5].
Tumor necrosis factor α (TNF-α) is secreted by phagocytic and mesangial cells [15]. In an animal model, mesangial cells have been shown to secrete TNF-α in response to stimulation with IgA (AIgA) aggregates [15]. This process is associated with proliferation of mesangial cells, which can be reduced by the administration of TNF-α binding antibody [15]. In patients with IgAN, TNF-α level shows a positive correlation with proteinuria and negative with estimated GFR [16]. TNF-α interacts with effector cells through two receptors – TNFR1 and TNFR2 – of which TNFR1 is expressed in the glomerulus [17, 18].
TNFR1 is expressed in normal endothelium, where it is primarily localized in the Golgi apparatus. During inflammation, TNF activates its receptors in the glomerulus (endothelium, mesangium, and epithelial cells) and in renal tubular cells [19]. TNFR1 modulates the immune response (via IL-6 synthesis) and apoptosis (via apoptotic signaling kinase 1 and NF-κB in mesangium cells) [19]. A relationship between high TNF-α and serum TNFR1 (sTNFR1) levels and the severity of histopathological lesions was observed [16], as well as a positive correlation between TNFR1 concentration in sTNFR1 and urine TNFR1 (uTNFR1) and markers of nephron damage (KIM-1, β2m, L-FABP, NAG) as well as a negative correlation between sTNFR1 and uTNFR1 and estimated GFR [17-20]. Due to the insidious and often subclinical course of IgA nephropathy, as demonstrated by the presence of IgAN lesions in 1.3% of the population in post-mortem studies, it is particularly important to search for new prognostic markers in IgAN [21]. After 20 years, it can lead to end stage renal disease in 14-39% of patients, and is also the main cause of end stage renal disease in the group of young Caucasian adults [22].
The aim of the study is to assess the significance of Gd-IgA1 and TNFR1 (sTNFR1, uTNFR1) levels as prognostic factors in IgAN and IgAVN.
Material and methods
The study was designed as a prospective case-control study in a population of patients with IgAN and IgAVN. The study population consisted of 80 children: 24 IgAN, 36 IgAVN and 20 controls. IgAN and IgAVN were diagnosed based on kidney biopsy, showing predominant IgA deposits.
The study population was recruited from the Polish Registry of Pediatric IgAN and IgAVN including the records of 299 children diagnosed with nephropathy between 2000 and 2018. All children who were under 18 years of age by December 30, 2018, with at least a 3-month follow-up after kidney biopsy with urine and serum samples available, were included in the study. Urine and serum samples obtained from the participants were shipped on dry ice to the study center. The recruitment period was 6 months. Exclusion criteria included other severe chronic diseases or delayed psychomotor development, IgAN in the course of systemic diseases, and IgAVN without kidney biopsy (these patients are not included in the registry), as well as age over 18 years (by December 30, 2018) and follow-up shorter than 3 months (for patients in the registry).
From a total of 92 patients who met the inclusion criteria (including 20 subjects in the control group), serum and urine samples were obtained from 80. The study was approved by the Bioethics Committee, approval no. KB/147/2017.
At the onset of the disease and at the end of follow-up proteinuria, hematuria, serum creatinine as well as IgA and C3 levels were measured and glomerular filtration rate (GFR) was calculated.
During the follow-up, the sGd-IgA1 (Gd-IgA1) and sTNFR1 and uTNFR1 levels were measured. The control group (C) (for sGd-IgA1, sTNFR1, and uTNFR1 levels) consisted of 20 healthy children, recruited for routine check-ups, on an announcement basis. The mean age in the control group was 9.45 ±4.67. The group consisted of 11 boys and 9 girls. The control group did not differ significantly from the study group in terms of sex and age.
Serum creatinine concentration was determined by the enzymatic method and expressed in mg/dl.
Serum IgA and C3 levels were determined by immunoturbidimetry and referred to age-dependent reference ranges.
The GFR value was calculated using the Schwartz formula [23].
Gd-IgA1 serum level was measured using ELISA assay (IBL International) and expressed in ng/ml.
TNFR1 in serum was measured using ELISA assay (SunRed) and expressed in pg/ml (serum).
Proteinuria was measured in a portion of urine using the Exton method and the result was expressed in mg/dl. Values lower than 10 mg/dl were considered normal.
Proteinuria was evaluated in daily urine collection and was expressed in mg/kg/day. Nephrotic proteinuria was defined as proteinuria ≥ 50 mg/kg/day, while proteinuria < 50 mg/kg/day was considered non-nephrotic. Protein to creatinine ratio was evaluated in single urine collection and was expressed in mg/g.
Hematuria was diagnosed in the presence of > 5 erythrocytes per high power field (HPF). Gross hematuria was defined as a change in the color of urine.
Creatinine in the urine portion was evaluated by the enzymatic method and expressed in mg/dl.
Urine TNFR1 was measured using ELISA assay (SunRed) and expressed in ng/g creatinine (urine).
Kidney biopsies were performed in all patients to diagnose nephropathy. Kidney biopsy was evaluated by light and immunofluorescence (IF) microscopy. IgA nephropathy was diagnosed in the presence of IgA deposits that were predominant over other deposits in the IF images.
Kidney biopsy findings were evaluated using the Oxford classification [1 – lesions present, 0 – absent: M – mesangial hypercellularity, E – endocapillary hypercellularity, S – segmental sclerosis/adhesion, T – tubular atrophy/interstitial fibrosis (T0 0-25%, T1 26-50%, T2 > 50%), C – crescents (C0 absent, C1 < 25%, C2 > 25% of glomeruli)] and MEST-C score was calculated as the sum of M, E, S, T, and C.
Statistical analysis
For quantitative variables descriptive statistics (mean, median, standard deviation) were calculated.
Lilliefors and Shapiro-Wilk tests were used to test the normality of the data. Next, parametric tests for normally distributed data were used: Student’s t-test for independent samples (comparison of 2 groups) and ANOVA analysis of variance for the comparison of 3 groups. Non-parametric tests were used for non-normally distributed variables: Mann-Whitney (2 groups) and Kruskal-Wallis (3 groups).
The following variables were non-normally distributed: proteinuria, hematuria, and sGd-IgA1. Serum Gd-IgA1 were logarithmically transformed to obtain a normal distribution.
The statistical significance of the increment of individual variables was evaluated using the Student’s t-test for dependent samples and the Wilcoxon test (normal and non-normal distributions, respectively). In the regression analysis, linear correlation coefficients between variables were calculated.
To compare IgAVN vs. IgAN for the variables urine TNFR, serum TNFR, and log serum Gd-IgA1 between IgAVN and IgAN groups and correlate these variables with age at onset, height, and weight, ANCOVA covariance analysis was performed. The corrected mean values were calculated (correction of average groups) and the homogeneity in IgAVN and IgAN groups for the above variables was confirmed (assumption for ANCOVA).
Results
Clinical parameters of the study group are presented in Tables 1 and 2. In the group of patients with IgAVN compared to IgAN, a significantly lower age at onset and lower creatinine level were observed at the beginning of the study. Complement component C3 level at the beginning of the disease was significantly higher in children with IgAVN. These patients also had higher proteinuria at onset of the disease in comparison to the IgAN group, but the difference was not statistically significant (p = 0.06); 7 (29.1%) children with IgAN and 15 (41.6%) with IgAVN had nephrotic proteinuria. The IgA concentration at onset did not differ significantly between the groups.
Table 1
Characteristics of study group – part 1
Table 2
Characteristics of study group – part 2
A kidney biopsy was performed on average 0.53 ±1.1 years from the onset, and no significant differences in time to kidney biopsy between the IgAN and IgAVN groups were observed.
The mean MEST-C score values did not differ significantly between IgAVN and IgAN groups.
The follow-up duration was 3.68 ±2.78 years from the onset of the disease and did not significantly differ between the groups.
At the end of the follow-up period, there were no significant differences in the mean GFR and creatinine values, but a decrease in GFR was observed in 3 (12.5%) children with IgAN and 1 (2.8%) child with IgAVN; the concentration of the complement component C3 did not differ between the IgAN and IgAVN groups. In the group of children with IgAN, a significantly higher mean IgA concentration at the end of the follow-up was observed as compared to the IgAVN group.
Proteinuria and hematuria at the end of follow-up were significantly lower in children with IgAVN.
Serum Gd-IgA1 uTNFR1 and sTNFR1 levels in children with IgAN, IgAVN and in the control group are shown in Table 3, Figures 1-3.
Fig. 1
Gd-IgA1 in children with IgA nephropathy (IgAN), IgA vasculitis nephritis (IgAVN) and control group
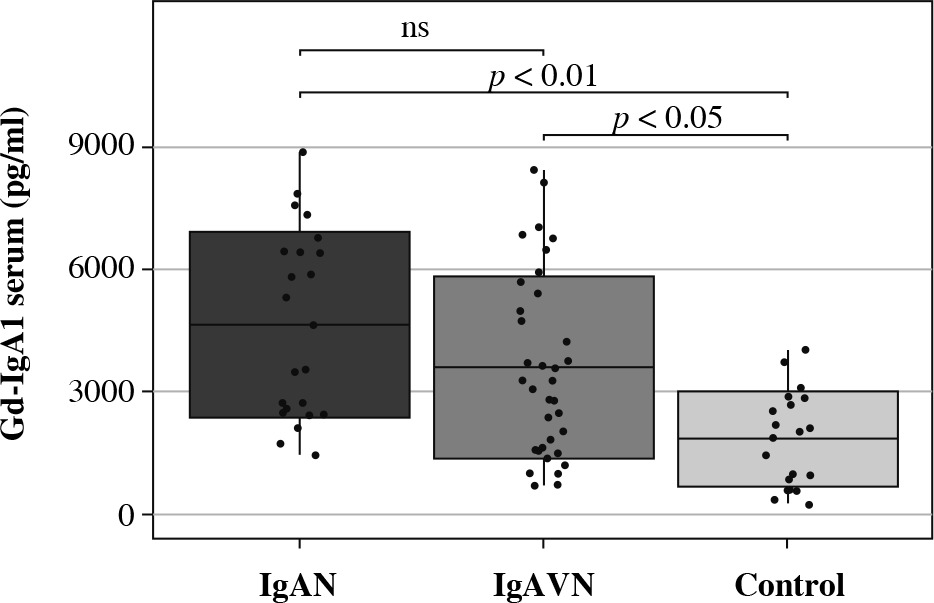
Fig. 2
Serum TNFR1 in children with IgA nephropathy (IgAN), IgA vasculitis nephritis (IgAVN) and control group
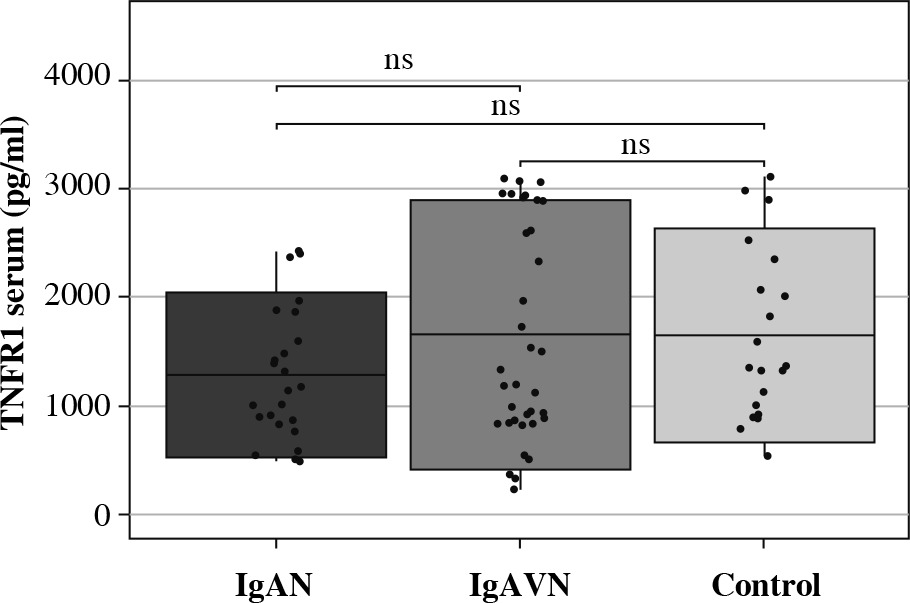
Fig. 3
Urine TNFR1 in children with IgA nephropathy (IgAN), IgA vasculitis nephritis (IgAVN) and control group
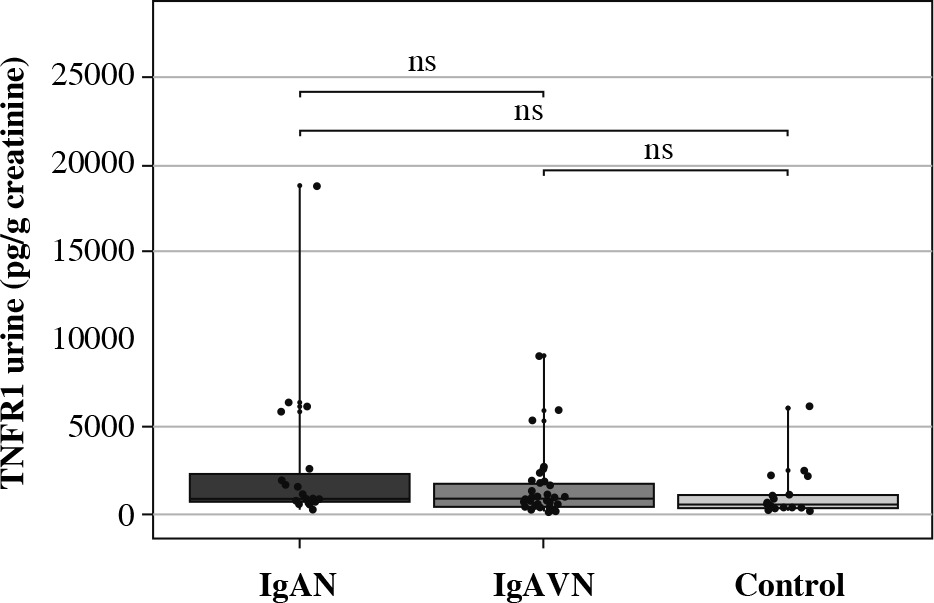
Table 3
Serum Gd-IgA1 and serum and urine TNFR1 in IgA nephropathy (IgAN), IgA vasculitis nephritis (IgAVN) and control group
In children with IgAN (p < 0.01) and IgAVN (p < 0.05), significantly higher Gd-IgA1 serum levels were found as compared to the control group; no difference was observed between IgAN and IgAVN. There were no significant differences between the concentration of TNFR1 in urine in children with IgAVN and in the control group.
No significant differences in sTNFR1 concentrations were observed in children with IgAN, IgAVN and in the control group.
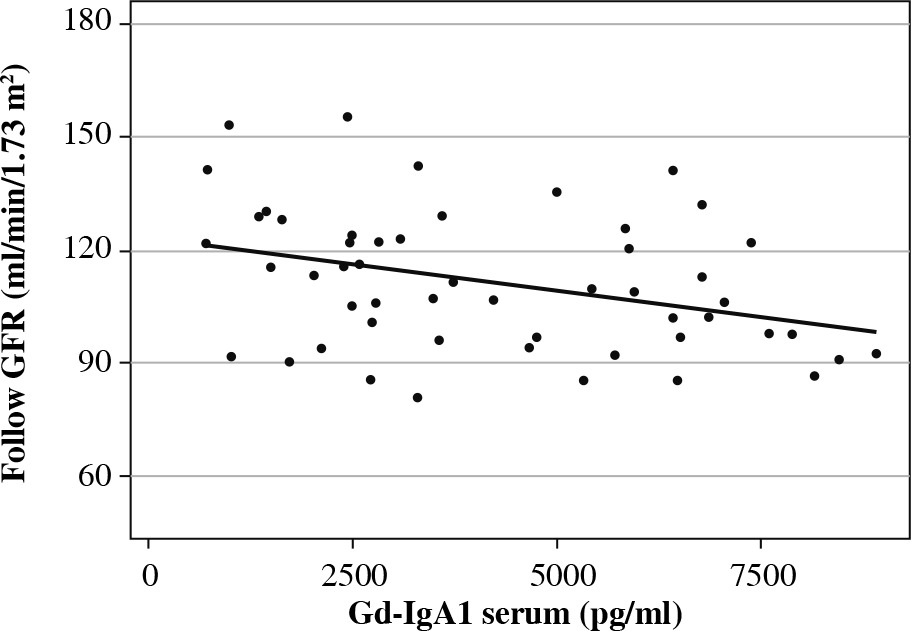
The analysis of the relationship between sGd-IgA1 and the clinical parameters of the study group showed a positive correlation with age at onset, IgA concentration and height at the beginning of the observation, as well as creatinine level, erythrocyturia, IgA, height and weight at the end of the follow-up. Gd-IgA1 concentration showed a negative correlation with GFR at the end of follow-up (Fig. 4).
Subgroup analysis for IgAN and IgAVN was also performed.
Serum and urine TNFR1 level did not correlate with GFR or proteinuria. At the end of follow-up, there was no correlation between uTNFR1 and the studied parameters. The only significant observation was that uTNFR1 level negatively correlated with age at onset (r = –0.39).
Serum TNFR1 also showed a negative correlation with age at onset (r = –0.29), height (r = –0.31) and weight (r = –0.34) at the beginning of the observation and with C3 (r = –0.39) at the end of the follow-up. Serum TNFR1 was not associated with GFR, creatinine, or severity of proteinuria at the beginning or the end of follow-up. The above data are shown in Table 4.
Table 4
Correlations between studied markers and clinical parameters in children with IgA nephropathy (IgAN) and IgA vasculitis nephritis (IgAVN)
After dividing the study group into subgroups depending on the level of proteinuria at the beginning of the study it was found that the non-nephrotic proteinuria subgroup (below 50 mg/kg/day) had a significantly higher GFR level, total protein concentration, albumin, IgA, and IgG at the beginning of the study and a higher IgA/C3 level at the end of follow-up. The subgroup with nephrotic proteinuria (≥ 50 mg/kg/day) had a significantly higher level of C4 during follow-up. These biochemical parameters, including Gd-IgA1 and TNFR1, in patients with nephrotic and non-nephrotic proteinuria are shown in Supplementary Table S1.
No statistically significant differences in the studied parameters were observed after dividing the study group into subgroups depending on the MEST-C value, but higher total protein levels (p < 0.05) and albumin level (p < 0.01) at the beginning of the disease were found in the group with the MEST-C score on biopsy > 2 compared to the group with the score ≤ 2 (Table 5).
Table 5
Comparison of studied parameters in subgroups depending on the MEST-C value
Logarithmic transformation of the studied parameters allowed a statistically significant correlation (Table 6) to be obtained with creatinine concentration (log serum TNFR1 r = –0.26), hematuria (log TNFR1 urine/creatinine r = 0.27), albumin concentration (log TNFR1 urine/creatinine r = –0.35) and weight (log TNFR1 urine/creatinine r = –0.30), which was not observed for sTNFR1 and uTNFR1.
Table 6
Correlations between serum Gd-IgA1 and serum and urine TNFR1 logarithmic values with selected clinical parameters
In addition to the similar correlations as observed for Gd-IgA1, a positive correlation between log Gd-IgA1 and serum creatinine (r = 0.40), IgA concentration (log Gd-IgA1 r = 0.65), height (log Gd-IgA1 r = 0.45), weight (log Gd-IgA1 r = 0.39) and disease duration (r = 0.30) at the end of follow-up was observed. Log Gd-IgA1 also showed a negative correlation with GFR level (log Gd-IgA1 r = –0.36) at the end of follow-up.
IgA/C3, GdIgA/C3, and Gd-IgA1/IgA ratios did not show better diagnostic value than the parameters separately (Supplementary Table S2).
Discussion
The study was performed in a population of children with IgAN and IgAVN in the Polish Registry of Pediatric IgAN and HSN. The size of the study group depended on the presence in the register.
In the clinical characteristics of the present study group, there are visible differences in creatinine levels between IgAN and IgAVN, which may result from a significantly lower age at onset of IgAVN. At the beginning, the disease was more severe in children in this group, which can be demonstrated by higher proteinuria, a greater number of children with nephrotic proteinuria, as well as higher C3 levels. This is consistent with data suggesting that IgAVN is an acute inflammatory process (nephritis).
After almost 4 years of follow-up, the median proteinuria in the examined group of 60 children with IgAN and IgAVN was 0, and mean GFR values were normal in both groups. However, a reduction in GFR was found in 3 (12.5%) children with IgAN and 1 (2.8%) child with IgAVN, which may have been due to persistent chronic inflammation and interstitial fibrosis.
Current data on sGd-IgA1 as a prognostic marker are still not conclusive. According to studies performed in adults and in children, Gd-IgA1 was not associated with the severity of proteinuria in IgAN, which is also supported by our data [24, 25]. Camilla et al. did not find any association between Gd-IgA1 and GFR, but there was a correlation between Gd-IgA1 and GFR/total IgA1 ratio [25].
In our study, we found a significantly higher concentration of Gd-IgA1 in children with IgAN and IgAVN than in the control group, and a negative correlation with GFR was observed in this study group.
Further analysis of the relationship between Gd-IgA1 and the severity of proteinuria, by comparing the subgroups with nephrotic and non-nephrotic proteinuria, revealed significantly lower GFR at the beginning of observation in children with nephrotic proteinuria and a significantly greater decrease in GFR in this group, but neither sGd-IgA1 nor sTNFR1 and uTNFR1 levels differed significantly between the groups, as observed by Jiang et al. and Hastings et al. for Gd-IgA1 [26, 27].
Contrary to our data, Sonoda et al. observed a relationship between sTNFR1 and GFR and interstitial fibrosis in IgAN; however, that study was performed in an adult population, 70% of whom had abnormal GFR [20], while in our study only 7% of children had abnormal GFR. There was also no correlation between TNFR1 and MEST-C score.
This is the first study on the TNFR1 value in children. A study performed by Murakoshi et al. in a group of adults found significantly higher serum TNFR1 levels in patients with GFR < 60 ml/min [28].
Kurashina et al. detected a relationship between serum TNFR1 and TNFR2 and GFR in adult patients with non-diabetic nephropathy. The authors found a negative correlation between GFR and TNFR1 and TNFR2, but multiple logistic regression analysis confirmed that only TNFR2 was associated with GFR in the range of 60-90 ml/min [29].
The study reported by Zhu et al. showed increased TNFR1 expression in the glomeruli of patients with World Health Organization (WHO) class III and IV lupus nephritis [30].
In summary, some authors question the role of TNFR1 in glomerulonephritis, while others confirm it.
The limitation of our study is the low number (n = 4) of subjects with reduced GFR at the end of follow-up (81.3-86.6 ml/min), which could have affected the results obtained, especially for TNFR1.