

Introduction
Type 2 diabetes mellitus (T2DM) is a metabolic disorder characterized by hyperglycemia and altered lipid metabolism, which is caused mainly by non-functional or lack of secretion of insulin by β pancreatic cells [1]. T2DM is a major health problem worldwide, but it is most notable in low- and middle-income countries, including Mexico [2]. Moreover, obesity-associated chronic inflammation is a key contributing factor to develop T2DM, and several studies have clearly demonstrated that both immune system and metabolism are highly linked [3-5]. Previous studies, such as of Hotamisligil et al. [6], established the concept of obesity-induced inflammation demonstrating high levels of TNF-α in obese mice with insulin resistance, and this phenomenon was ameliorated after TNF-α neutralization. Subsequently, other cytokines were associated with insulin resistance and diabetes [7]. Also, immune cells were associated to obesity and T2DM [3, 4], especially monocytes and macrophages. Thus, monocytes from T2DM patients exhibit a pro-inflammatory profile, secreting high levels of IL-6, IL-8, TNF-α, and IL-1β [8]. These cytokines induce insulin resistance with inhibition of signaling via the insulin receptor [7]. Interestingly, recent findings have shown that cells from the adaptive immune system could also contribute to inflammation associated to T2DM [3, 9].
Regulatory T cells (Treg) play an important role in the maintenance of homeostasis of the immune system [3]. These cells prevent inflammatory responses, through the suppression of effector T cells to self-antigens, commensal microorganisms, allergens, and pathogens [10]. On the other hand, Th17 cells are characterized by producing IL-17. The IL-17 is comprised of a family of cytokines such as IL-17A to IL-17F. The IL-17A is the most important member, because it promotes inflammation through the activation of several cells including monocytes, fibroblasts, and endothelial cells, which produce pro-inflammatory cytokines as well as the stimulation, mobilization, recruitment, and activation of granulocytes [11, 12]. Furthermore, visceral adipose tissue demonstrated that CD4+Th1 cells and CD4+CD25h Treg play an important role in the regulation of body weight, adipocyte hypertrophy, insulin resistance, glucose tolerance, and T2DM progression in both mice and humans [13, 14]. Another study showed that cells producing IL-17 depended on the pro-inflammatory cytokine IL-6 in spleen of obese mice, suggesting that IL-17 may contribute to inflammation in T2DM and insulin resistance [15]. To date, the role of Th17 and Treg cells in chronic systemic inflammation in T2DM is unclear and controversial. The aim of this study was to identify and evaluate the proportions of Th17 and Treg cells in patients with different times of T2DM progression and metabolic control (depending on HbA1c levels) as well as their correlation with various biochemical and anthropometric parameters.
Material and methods
T2DM patients and control subjects
Forty T2DM patients were included. They were classified into two groups: the first group included 20 patients with less than 10 years of disease progression (T2DM< 10), and the second group consisted of 20 patients with equal or more than 10 years of disease progression (T2DM ≥ 10). Additionally, 19 controls were included. It is important to mention that this group was designated as a control in spite of being composed of lean, overweight, and obese individuals, but none suffering from T2DM, infections, or any other disease. All subjects were attending at the Medical Research Department of Guanajuato University, in Leon Guanajuato, Mexico. T2DM patients were diagnosed according to the American Diabetes Association. Patients suffering from any inflammatory disease, abnormal liver, renal failure, or abnormal thyroid function as well as those under treatment with steroids, insulin, or anti-inflammatory drugs were excluded. Serum lipid profile, fasting plasma glucose (FPG), and HbA1c levels were measured using standard laboratory protocols. Additionally, a statistical analysis was performed according to the metabolic control, depending on HbA1c levels, thus the T2DM patient group was divided according to the percentage of HbA1c into 3 groups as previously described [16, 17]: acceptable metabolic control (T2DM-AC) with HbA1c < 7.0%, moderate metabolic control (T2DM-MC) with HbA1c ranging from 7.0% to 8.0%, and poor metabolic control (T2DM-PC) with HbA1c > 8.0%. The study was conducted according to the ethical guidelines outlined in the Declaration of Helsinki. Moreover, this protocol was approved by the local bioethics committee, and a written informed consent was obtained from each participant.
Flow cytometric analysis of Th17 and Treg cells
Peripheral blood mononuclear cells (PBMCs) were isolated from 20 ml of peripheral blood samples by Ficoll-Hypaque density gradient centrifugation (Sigma-Aldrich, St. Louis, MO, USA). For Th17 cells analysis, PBMCs were suspended at a density of 1×10⁶ cells/ml in complete culture medium (RPMI 1640 supplemented with 100 U/ml penicillin, 100 µg/ml streptomycin, 2 mM glutamine, and 10% heat-inactivated fetal calf serum; Gibco BRL, Carlsbad, CA, USA). Then, 2 × 10⁶ cells were transferred into individual wells of 24-well plates and stimulated with both phorbol myristate acetate (PMA, 50 ng/ml) and ionomycin (2 µM) (Sigma-Aldrich, St Louis, MO, USA) for 4 hours. Next, the cells were collected and treated with the BD Cytofix/Cytoperm™ Plus Fixation/Permeabilization kit, which contains brefeldin A to block cytokine secretion, and according to the manufacturer’s instructions. Finally, the cells were stained with fluorescein isothiocyanate (FITC) anti-human CD4 and phycoerythrin (PE) anti-human IL-17A. Th17+ cells were quantified in gated CD4+ subset as previously described [18, 19].
For Treg cells analysis, the Treg detection kit (CD4/CD25/FoxP3) was used (MiltenyiBiotec Inc., Auburn, CA, USA), according to the manufacturer’s instructions. To identify the Tregs subsets, a gate was performed on CD3+CD4+ double positive lymphocytes, and then expression of CD25 vs. FoxP3 was analyzed. Therefore, the classic Treg cells CD4+CD25 and CD4+CD25h were identified. In all cases, mAb isotype controls were included and cells were preincubated with 10% heat-inactivated autologous serum to block the Fc receptors. Detection of different cell types was carried out on same day of blood sample collection after in vitro stimulation, as above indicated. For Th17 and Treg FACS analysis, cells were gated using forward and side scatter to exclude dead cells. All FACS assays were performed using FACS Canto II (Becton Dickinson, San Jose, CA, USA).
Statistical analysis
The U-Mann-Whitney and Kruskal-Wallis tests were used to determine differences between groups. In addition, Spearman test was used to analyze the association between two variables. Statistical analyses were performed using SPSS 18.0 software (SPSS Science, Chicago, IL, USA) and GraphPad Prism 6 V software (La Jolla, CA, USA). The p< 0.05 was considered statistically significant.
Results
T2DM is a chronic disease that causes long-term complications, affecting several organs as a result of uncontrolled levels of glucose in the blood. Here, we determined how the short (< 10 years) and long-term (> 10 years) progression of T2DM affects the metabolic parameters in patients with T2DM through fasting glucose, HbA1c, and lipid profile. In Table 1, the metabolic and anthropometric parameters from both T2DM patients and controls are presented. As expected, FPG, HbA1c, triglycerides, and VLDL cholesterol were significantly higher in both groups of T2DM patients compared with controls. Moreover, it was also observed that both groups of T2DM patients were older than control group. Interestingly, no differences in urea, creatinine, total cholesterol, HDL, and LDL plasma levels were observed between both groups of T2DM patients and control group. A slight increase in BMI was detected on T2DM < 10 group compared with both T2DM ≥ 10 and control group.
Table 1
Metabolic and anthropometric characteristics of the studied populations
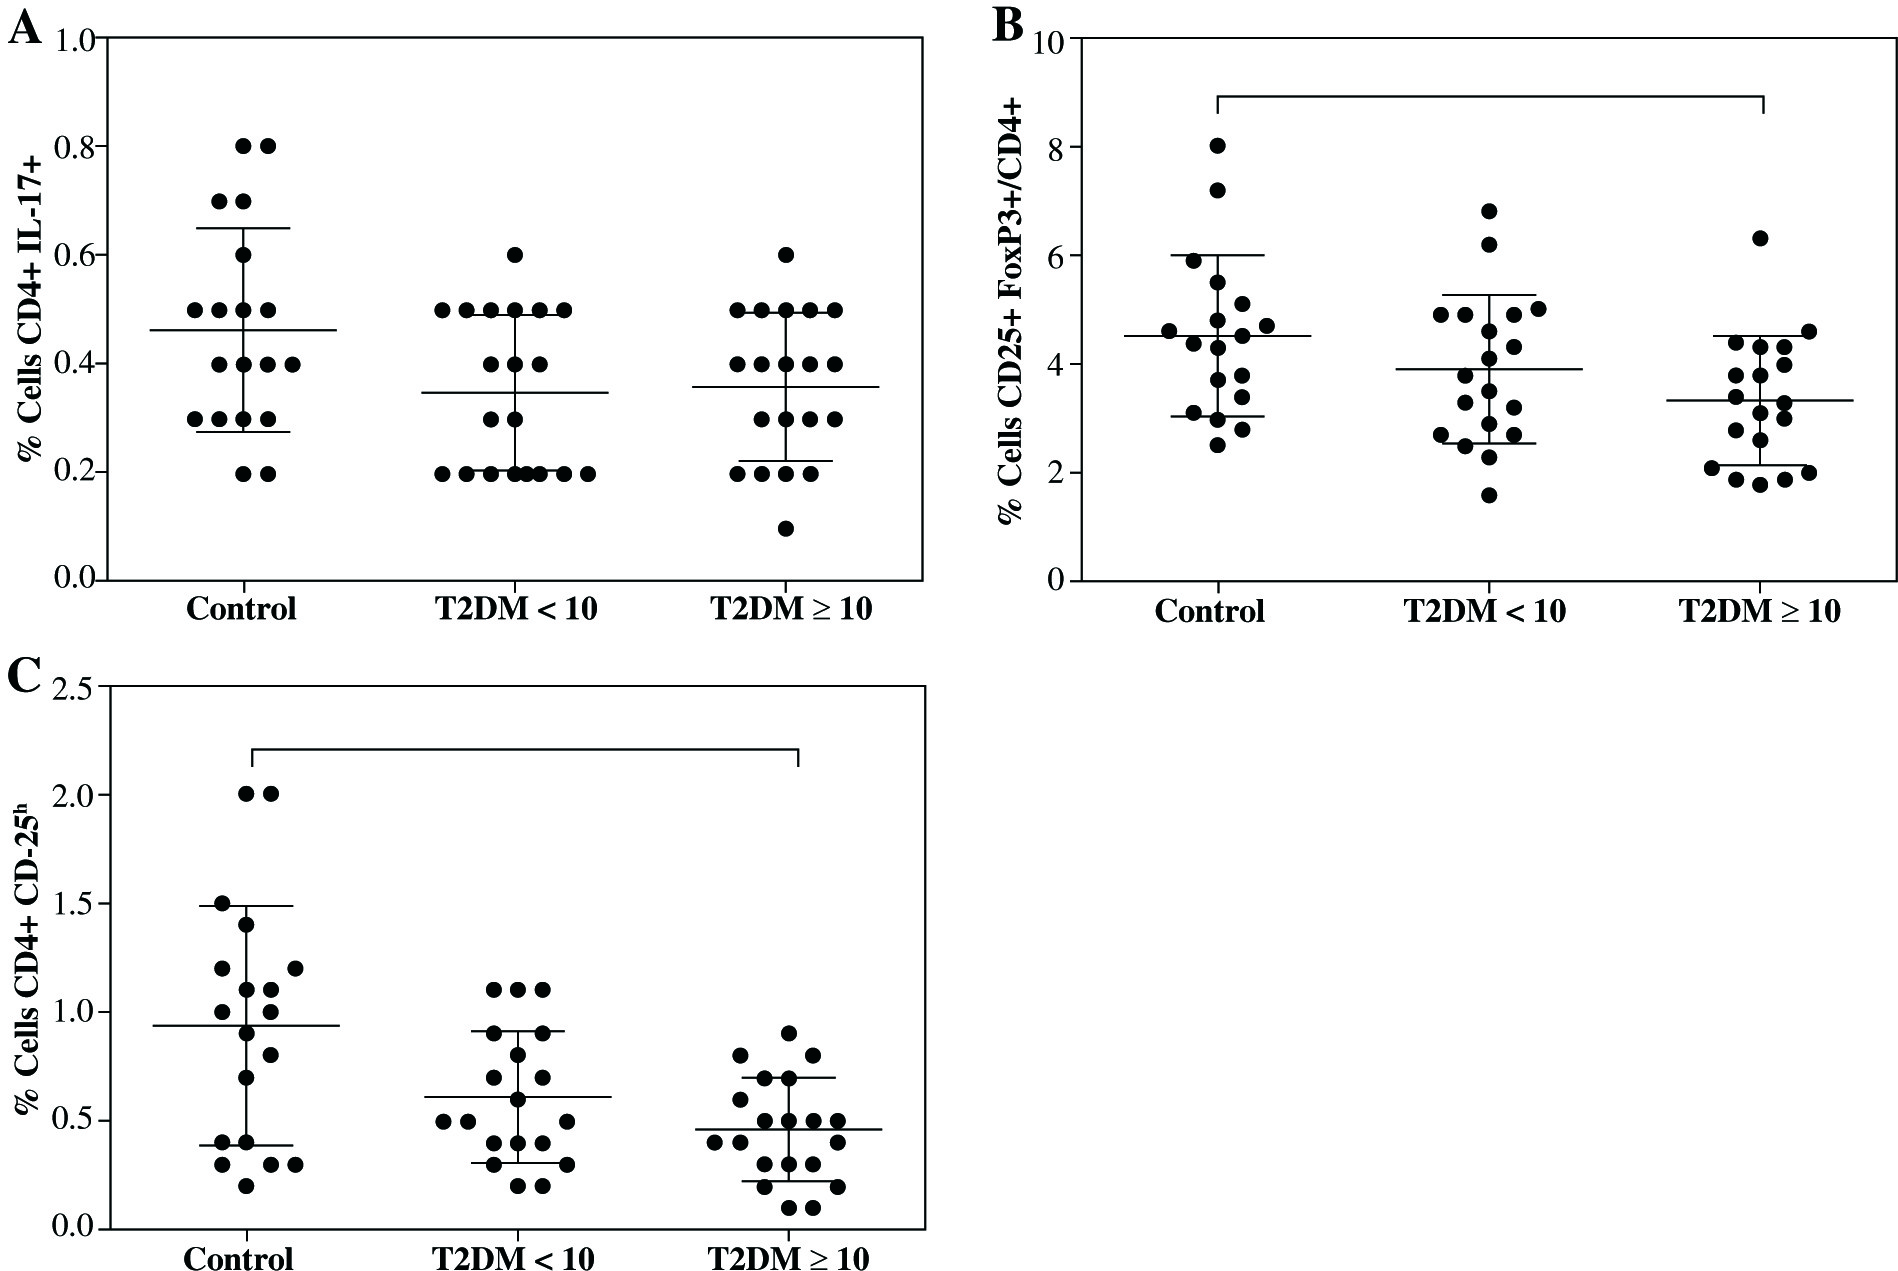
Likewise, not differences were observed in the proportion of CD4+Th17+ cells between controls (0.46 ±0.18%) and both T2DM < 10 (0.34 ±0.15%) nor T2DM ≥ 10 (0.36 ±0.13%) groups (Fig. 1A). Although, there was a clear downward trend of CD4+Th17+ cells in both T2DM groups. Moreover, we did not find difference in the proportion of Treg cells expressing CD4+CD25+FoxP3+ between controls (4.51 ±1.46%) and T2DM < 10 patients (3.90 ±1.36%), but a significant decrease was observed in the group of T2DM ≥ 10 patients (3.33 ±1.17%) compared to control with p = 0.034 (Fig. 1B). Additionally, CD4+CD25h T cells were analyzed and similarly to CD4+CD25+FoxP3+Treg, an important decrease was found in T2DM ≥ 10 patients compared with controls (Fig. 1C, p = 0.009), and no differences were observed in T2DM < 10 patients.
Fig. 1
Percentages of Th17 and Treg cells from patients with short-term (T2DM < 10) or long-term progression of type 2 diabetes mellitus (T2DM > 10). Both Th17 and Tregs from peripheral blood were stained and analyzed according to the protocol described in the material and methods section. A) Th17+CD4+ expressing cells, B) CD4+CD25+FoxP3+ expressing Treg cells, C) percentage of Treg cells (CD4+CD25h). Data represent the arithmetic mean and SD of the percent each cell subset, respectively; * p < 0.05 by Kruskal-Wallis test
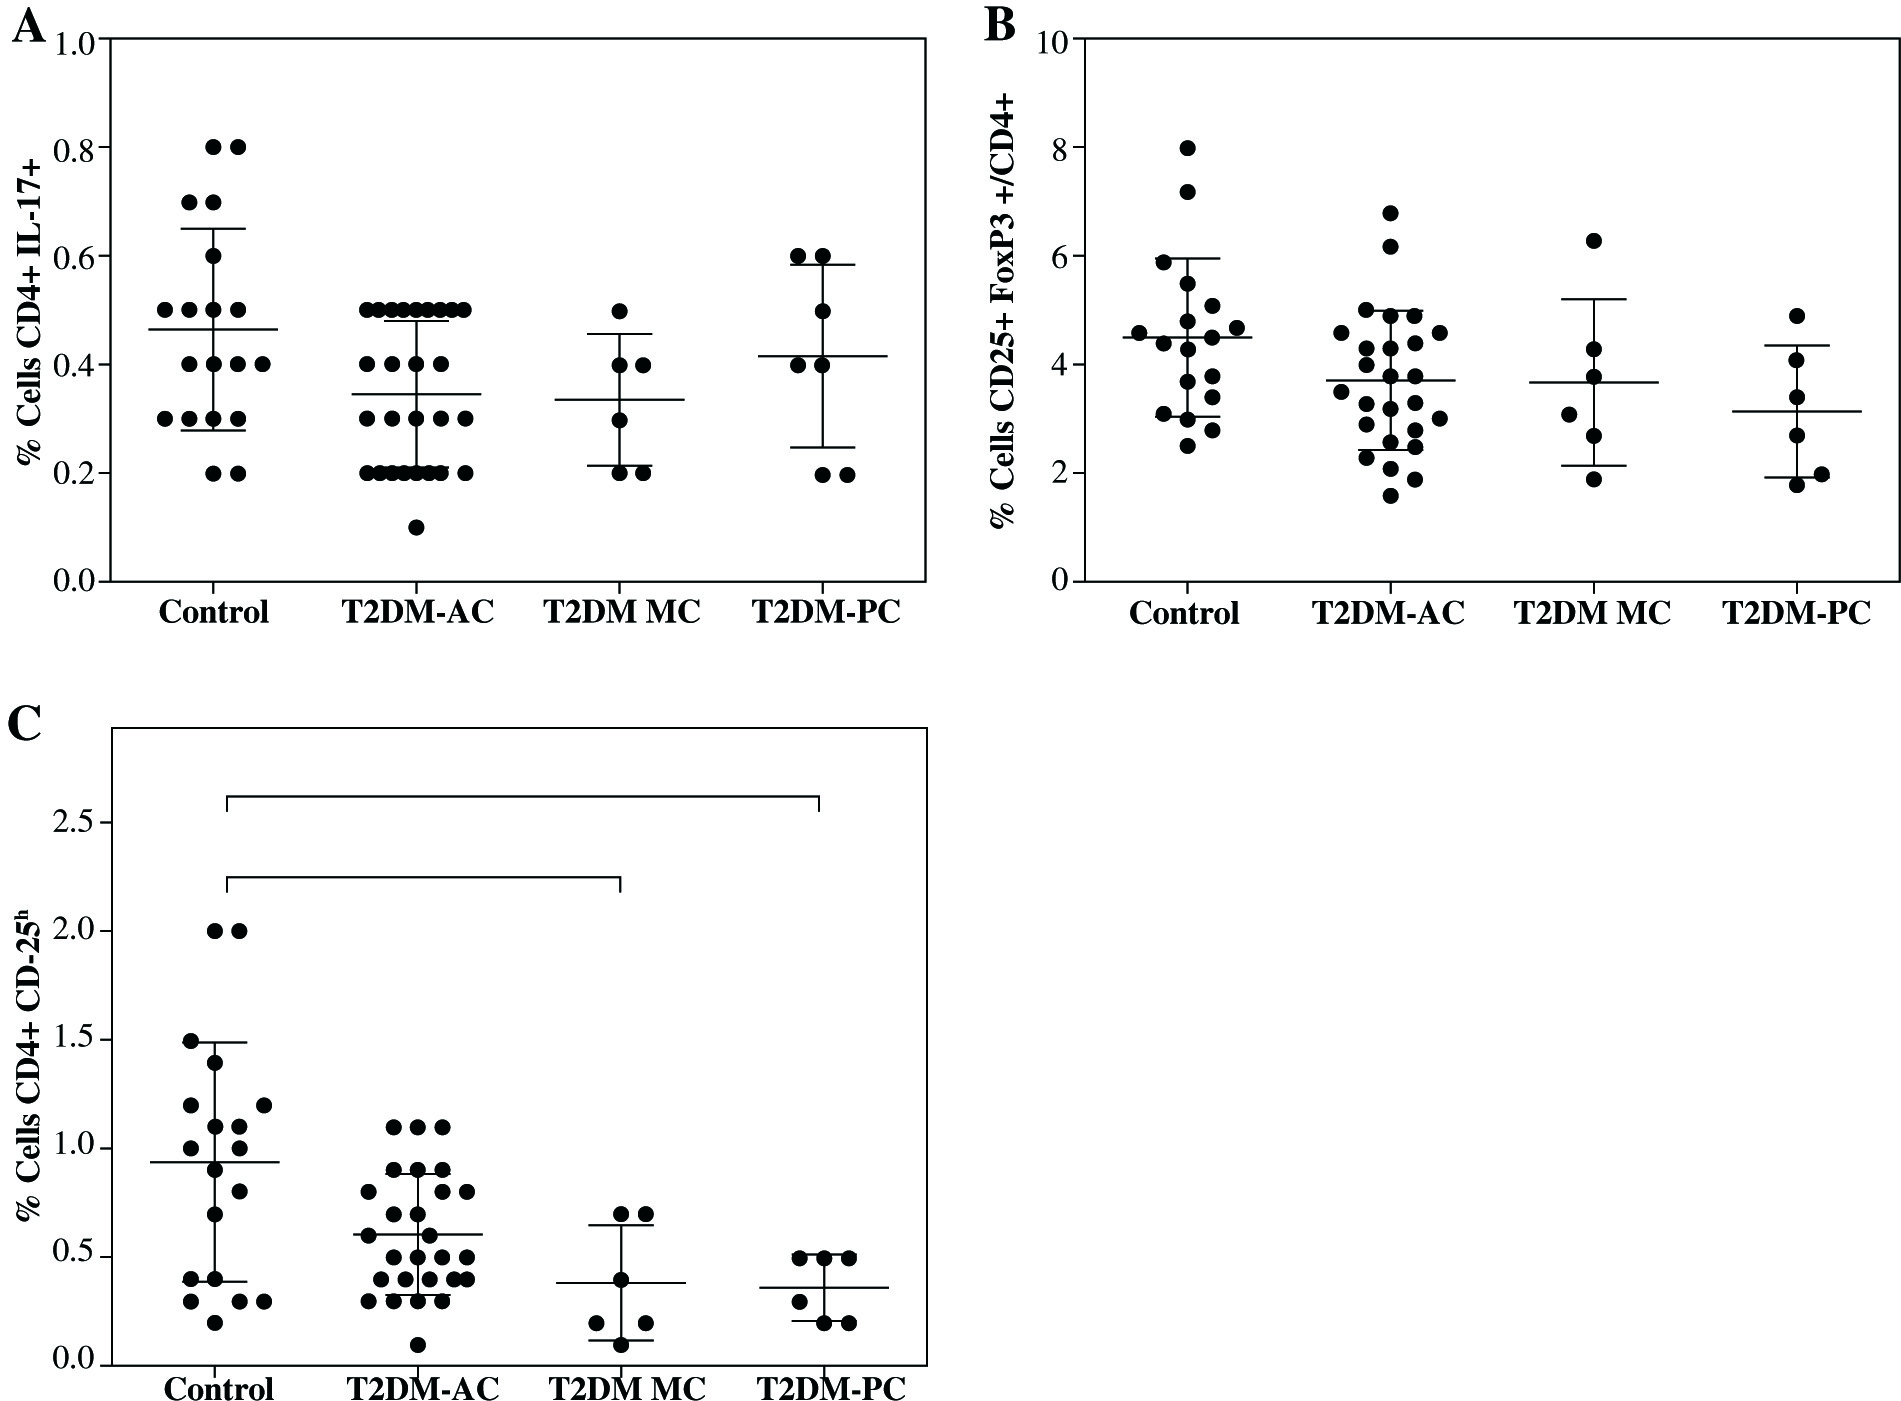
In addition, when the patient data were divided and analyzed according to their metabolic control, a significant decrease was observed in CD4+CD25h cells in patients with moderate metabolic control (T2DM-MC; 0.38 ±0.26%) and poor metabolic control (T2DM-PC; 0.36 ±0.15%) compared to control group (0.93 ±0.54%) (Fig. 2C, both p< 0.05), while a downward trend in the percentage of Treg cells was observed in the T2DM patient groups (Fig. 2B), and no significant difference was observed in the percentage of TH17 cells between control and patient groups (Fig. 2A).
Fig. 2
Analysis of Th17 and Treg cells from type 2 diabetes mellitus patients according to their metabolic control. The T2DM patient group was divided as per the percentage of HbA1c into 3 groups: acceptable metabolic control (T2DM-AC), moderate metabolic control (T2DM-MC), and poor metabolic control (T2DM-PC). The percentages of A) Th17+CD4+ expressing cells, B) CD4+CD25+ FoxP3+ expressing Treg cells, and C) Treg cells (CD4+ CD25h) is shown, respectively. Data represent the arithmetic mean and SD of the percent each cell subset, respectively; * p < 0.05 by Kruskal-Wallis test
It is important to note that despite the limited number of participants recruited for this study, statistical differences were found in both Treg cells expressing CD4+CD25+FoxP3+ and CD4+CD25h in T2DM ≥ 10 patient group, but not in T2DM < 10 patients. Also, a downward trend of Th17 cells in both T2DM patients’ groups was observed. An additional statistical analysis was performed to compare control group and all T2DM patients (Fig. 3). In this way, an important decrease was observed in the proportion of Th17 cells from 0.46 ±0.18% in control to 0.35 ±0.14% in T2DM patients (Fig. 3A, p = 0.045). Similarly, there was an important decrease in both Treg cells subsets expressing CD4+CD25+FoxP3 (Fig. 3B, p = 0.032) and CD4+CD25h (Fig. 3C, p = 0.011) in T2DM patients compared to control group.
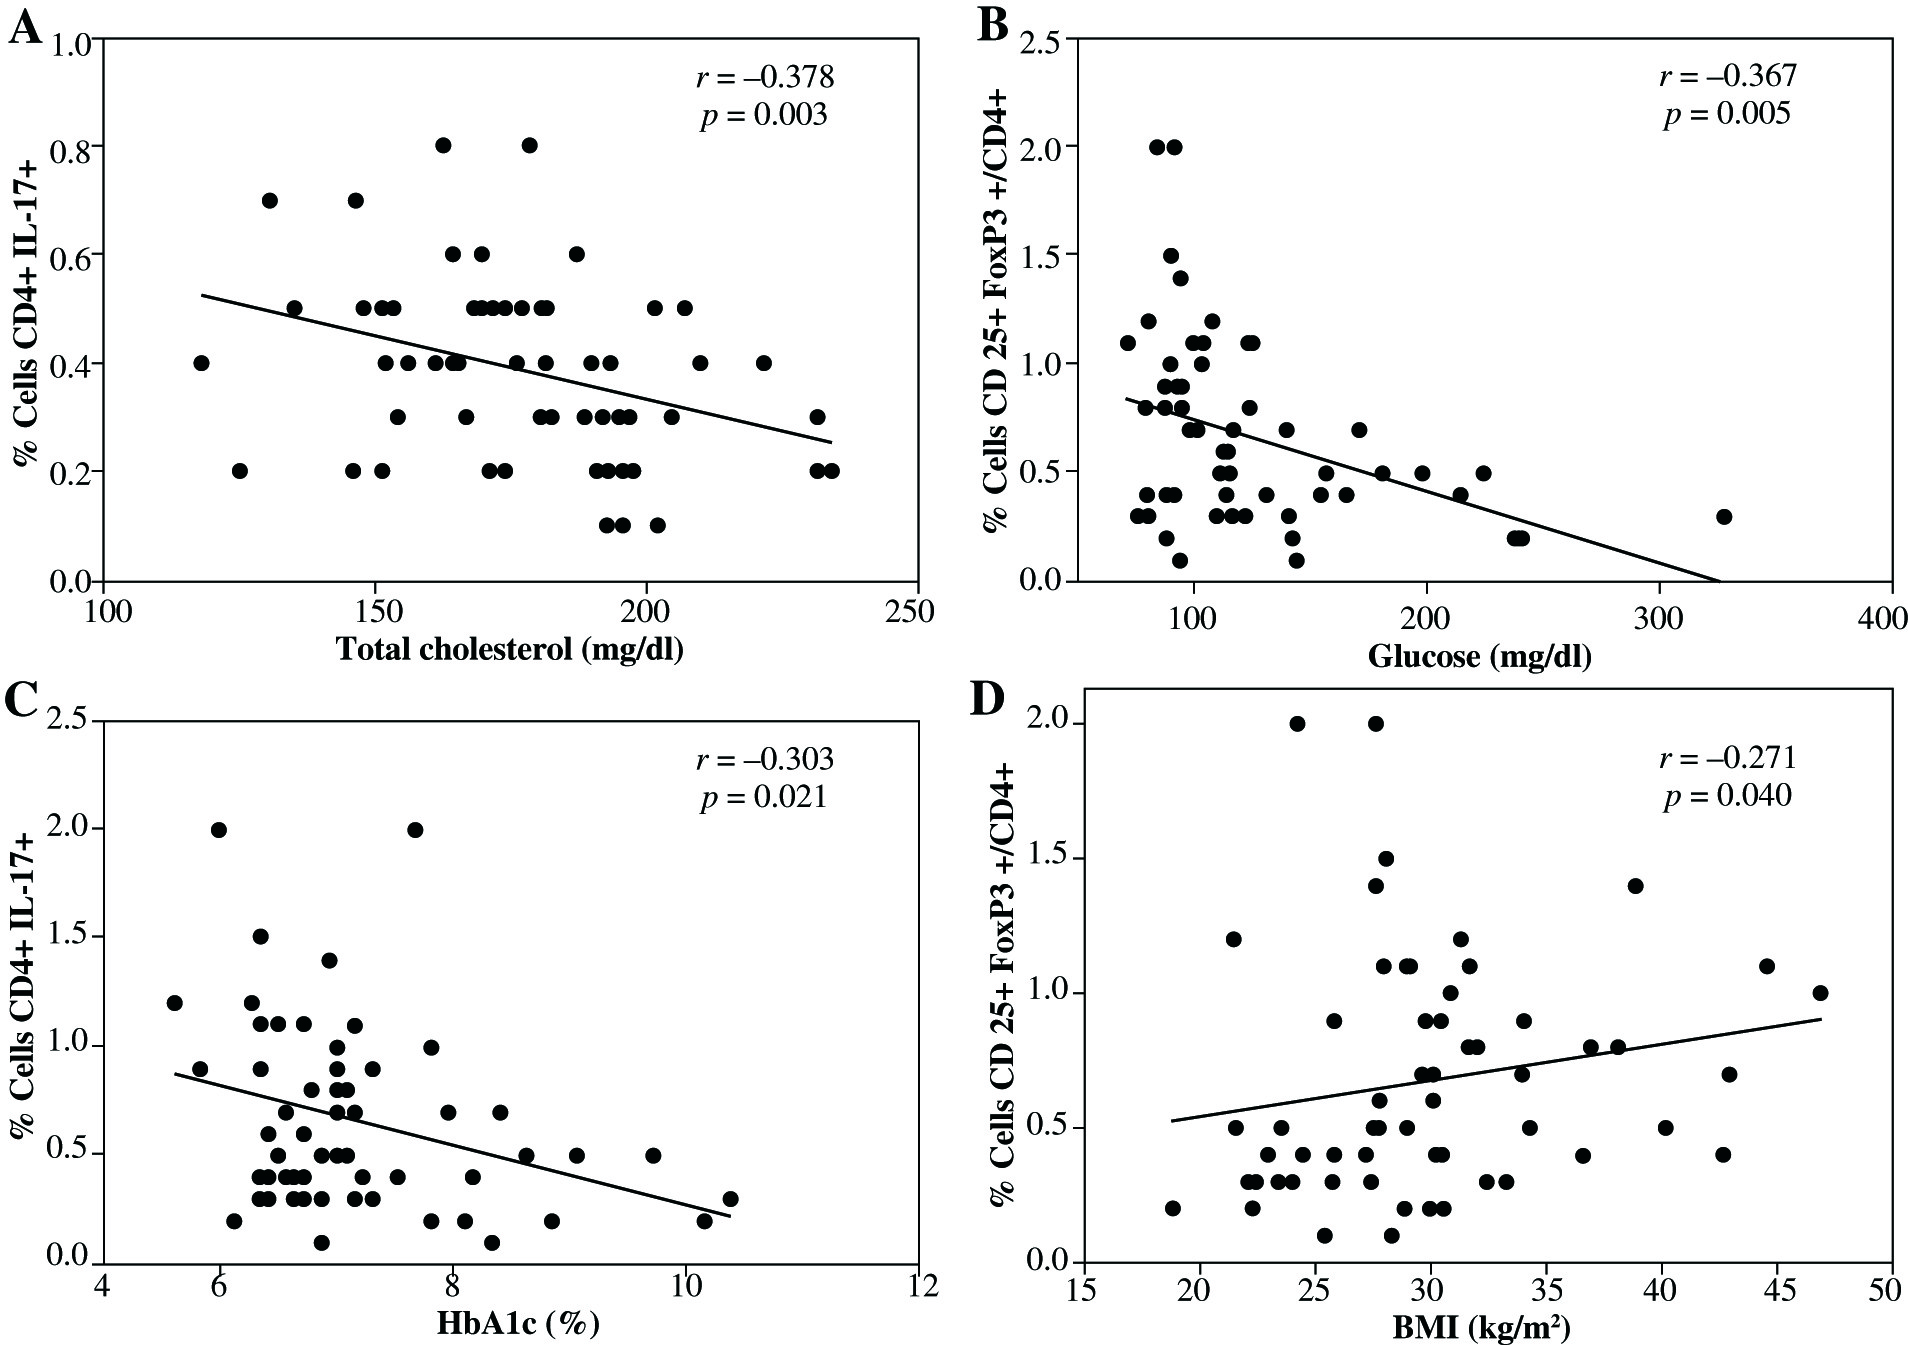
Finally, statistical correlation between CD4+Th17 cells, Treg cells expressing CD4+CD25+FoxP3+, and CD4+CD25h T cells with some metabolic or anthropometric parameters were analyzed on all volunteers. We found a negative correlation between CD4+Th17+ cells and total cholesterol levels (Fig. 4A). Similarly, as shown in Figure 4B and 4C, CD4+CD25h T cells showed a negative correlation with glucose levels as well as with HbA1c, whereas positive correlation was observed between CD4+CD25h T cells and BMI (Fig. 4D). No statistical correlation was detected between Treg cells CD4+CD25+FoxP3+ and any biochemical and anthropometric parameters (data not shown).
Fig. 3
Comparison of both Th17 and Treg cells from control individuals and T2DM patients as a group. A) Th17+CD4+ expressing cells, B) CD4+CD25+FoxP3+ expressing Treg cells, C) percentage of Treg cells (CD4+ CD25h). Data represent the arithmetic mean and SD of the percent each cell subset, respectively; * p < 0.05 by U Mann-Whitney
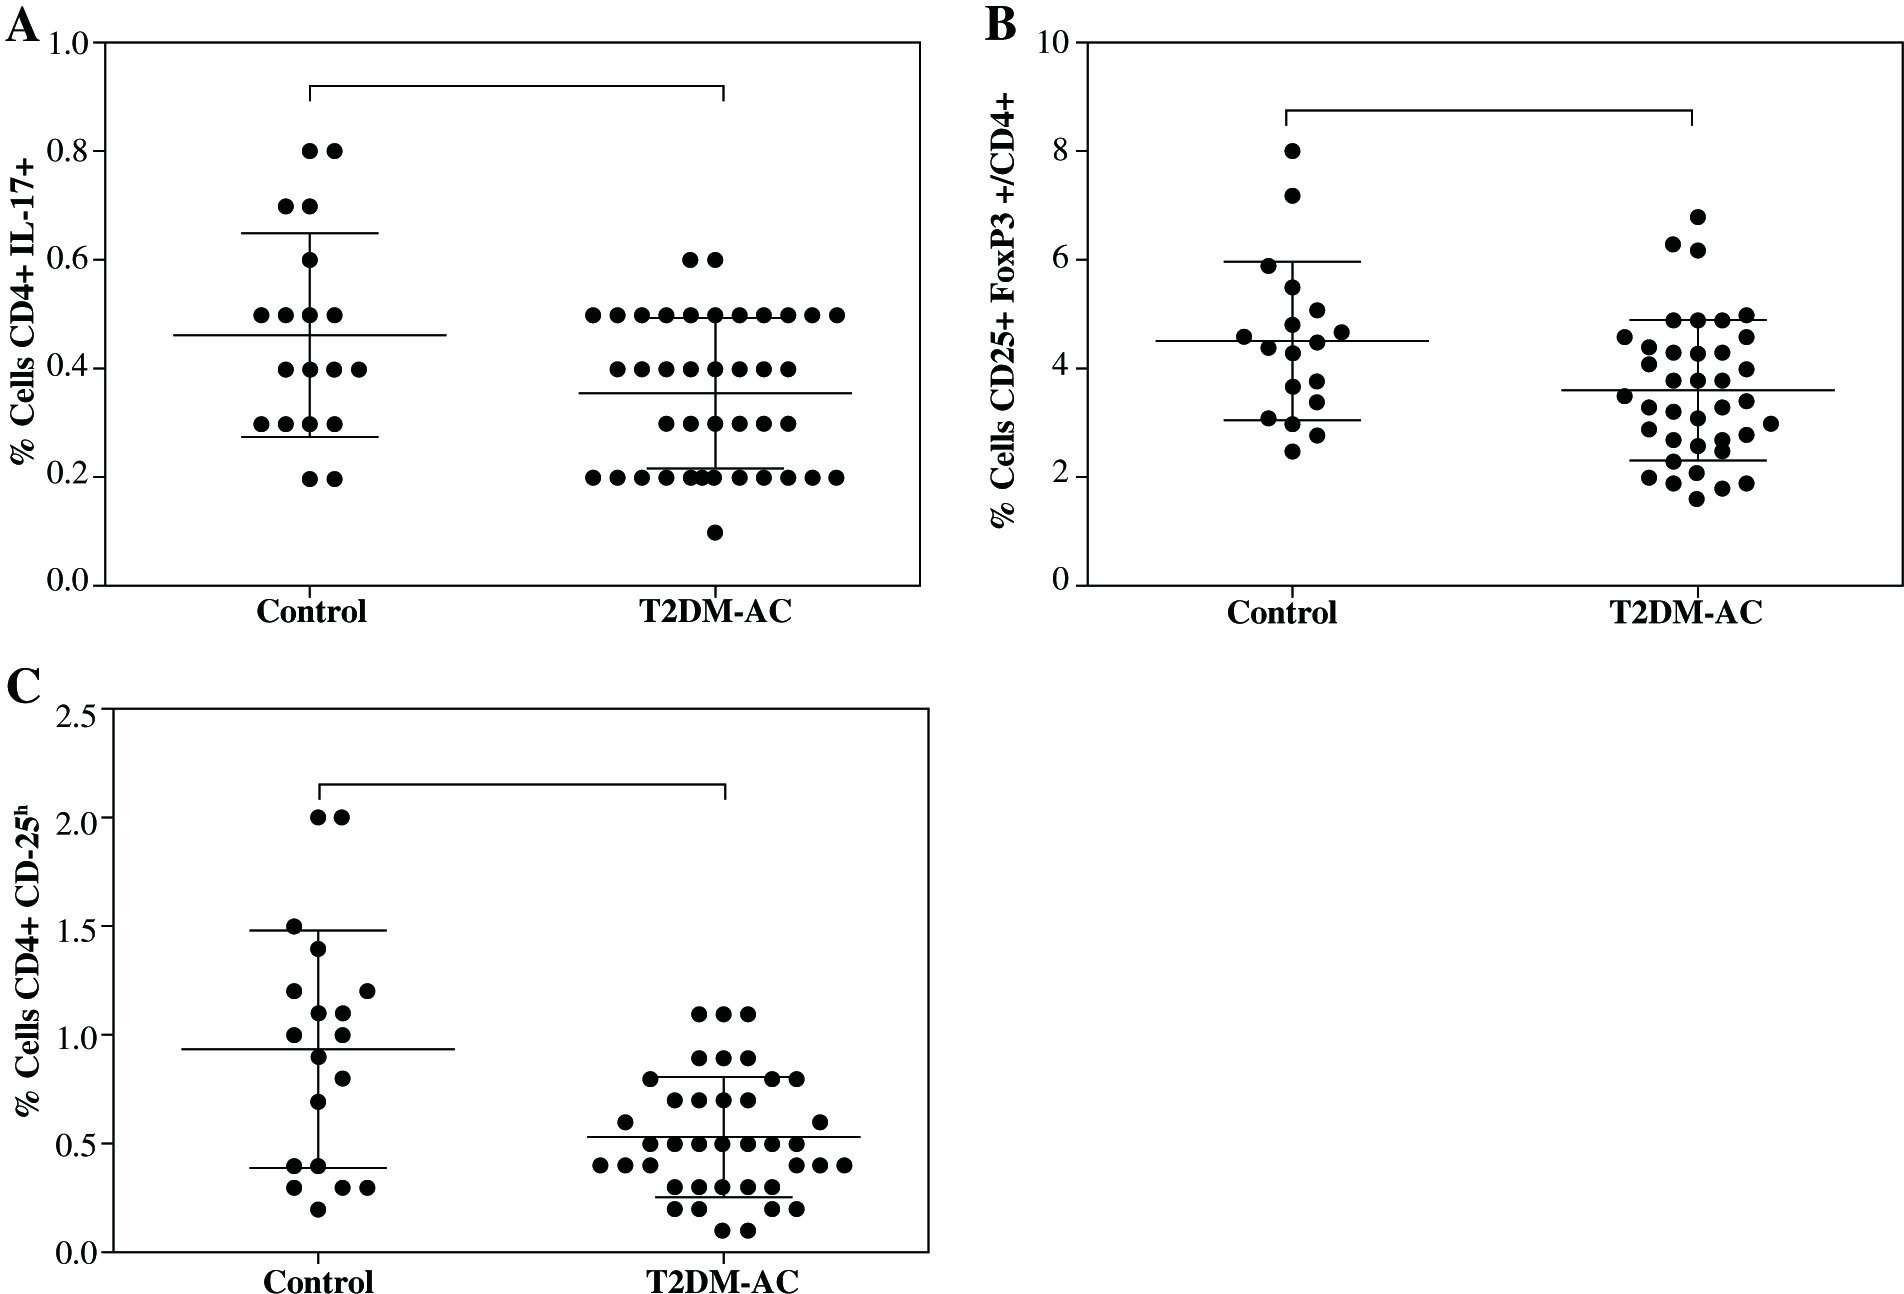
Fig. 4
Statistical correlations between CD4+Th17 cells, CD4+CD25+FoxP3+Treg cells, or CD4+CD25h T cells, with various metabolic or anthropometric parameters. A) Correlation between CD4+Th17 cells and total cholesterol, B) correlation between CD4+CD25h T cells and blood glucose levels, C) correlation between CD4+CD25h and HbA1c, D) correlation between CD4+CD25h T cells and BMI. Spearman test was used to analyze the association between two variables
Discussion
T2DM is a chronic disease affecting multiple organs. The strong link between the immune system and T2DM is clear, mainly through chronic systemic inflammation. This phenomenon involves several molecules and cells, including Th17 and Treg cells [3, 4, 9]. However, the role of Th17 and Treg cells in chronic systemic inflammation in T2DM is controversial and even poorly understood. Here, we studied the proportion of both Th17 and Treg cells in patients with short-term (T2DM < 10 years) and long-term (T2DM ≥ 10 years) progression of T2DM as well as its correlation with anthropometric and biochemical parameters and the possible effect of metabolic control on the proportion of these subsets. In our experience, times of progression of T2DM are determined based on the fact that health alterations associated with the progression of T2DM occurs mostly after 10 years of illness; therefore, our study evaluated the proportions of the Treg and TH17 cells in two important stages of the disease.
With respect to Th17 cells, we did not find significant differences in the proportion of Th17 cells between T2DM <1 0, T2DM ≥ 10, neither control group, not even when the statistical analysis was performed according to T2DM patients metabolic control. However, a downward trend of Th17 cells was present in both groups of T2DM patients. This decrease of Th17 cells was more evident when a statistical analysis was performed in all T2DM patients as a study group. These results contrasted with two previous reports from Chinese and American populations, where a significant increase of Th17 cells in T2DM patients was observed [18-20]. Moreover, the proliferation of Th17 cells under a pro-inflammatory environment has been reported, so we expected an increase of these cells in T2DM patients, since chronic systemic inflammation has been associated with T2DM [3, 15, 21]. It is possible that the disagreement between our results and the others previously reported are due to methodological differences or to the age of patients in studied groups. Here, the age range in T2DM patients was from 24 to 85 years, while the one reported in the Chinese population was 33 to 77 years. In addition, a larger number of participants were included in the Chinese study: 117 controls and 181 T2DM patients [18], whereas in our study, 19 control subjects and 40 T2DM patients were included only. Additionally, in both studies performed in either USA or China, a chemokine receptor was used to characterize Th17 cells [19, 20]. Controversially, a decrease in the proportion of Th17 cells in T2DM patients has been reported [22, 23], with a similar decrease founded in our study.
On the other hand, it is important to mention that most of the T2DM patients included in our study were on treatment with either metformin or a combination of metformin-glibenclamide. Interestingly, it has previously been reported that metformin therapy could regulate the differentiation of both Th17 and Treg cells through the STAT3 activation [24]. Therefore, it is possible that treatment with hypoglycemic drugs, such as metformin, may induce a decrease of Th17 cells in peripheral blood of T2DM patients. Of note, in previous studies about Th17 cells and T2DM, the medical therapy of T2DM patients were not specified [18-20].
With regards to CD4+CD25+FoxP3+Treg cells, a significant decrease in T2DM patients has been previously reported [20, 25]. Similarly, we found a decrease in the proportion of CD4+CD25+FoxP3+Treg cells in T2DM ≥ 10 patients, and a downward trend in TD2M < 10 patients as well as in patients with poor metabolic control, as reported by Haseda et al. [26]. In addition, a significant decrease of CD4+CD25h cells was detected in T2DM ≥ 10, T2DM-MC, T2DM-PC, and in all T2DM patients analyzed as a group. Therefore, these findings suggest that the time of evolution of the disease and the metabolic decontrol could be associated with a reduction in the proportion of both Treg CD4+CD25+FoxP3+ cells and CD4+CD25h cells, supporting the previous findings reported in the Chinese population [18]. Hence, we may suggest that a decrease of Treg cells in patients with T2DM could promote a chronic systemic inflammation, because the main function of Treg cells is to inhibit inflammatory responses [10].
To date, the pathogenesis of T2DM was not completely understood. For this reason, further studies should be performed to determine whether the decrease of the proportion of CD4+CD25+FoxP3+Treg cells is a consequence of the T2DM pathogenesis or could be a trigger for T2DM development. However, it has been suggested that a decreased proportion of Treg cells in T2DM patients is due to an increased susceptibility to apoptosis [18].
Moreover, the role of Treg cells in metabolic disorders has been demonstrated using mice experimental models. In this respect, it has been showed that in vivo expansion of Treg cells resulted in an improved glucose tolerance and insulin resistance in obese mice, and this phenomenon was dependent on IL-10 production [13, 14]. In contrast, it was shown that Treg cell depletion increased the metabolic alterations [14, 27].
In addition, the link between hyperglycemia and inflammation in T2DM [28] suggests that low number of Treg cells could be associated with the inflammatory environment in T2DM. Here, we found a negative correlation between the proportion of CD4+CD25h cells and glucose blood levels. Similar results were observed in mice treated with γ-aminobutyric acid in which, an important increase of the proportion of Treg cells was linked to reduction in both glucose blood levels and inflammatory markers, with a subsequent improvement in insulin sensitivity [29]. Controversially, Wagner et al. did not find a correlation between Treg cells and glucose levels, although the patients included in their study were obese [30]. However, a negative correlation was found between the percentage of Treg cells and levels of HbA1c, supporting our findings in T2DM patients. However, a positive correlation between Treg cells CD4+CD25h and BMI was found here, it is in disagreement with a previous report from American population [20]. Nevertheless, previous findings on morbid obesity subjects have shown similar to our results [31].
It is important to note that our study showed a significant limitation in the number of included participants as well as an age difference between patients and controls. However, interesting data were found including a negative correlation between Th17 cells and total cholesterol levels as well as a negative correlation between CD4+CD25h cells and blood glucose levels. In addition, a significant reduction of the proportion of CD4+CD25+FoxP3+ and CD4+CD25h cells in patients with T2DM, and a slight decrease of CD4+CD25h T cells in T2DM < 10 patients was also observed. Therefore, we propose that the long-term progression of T2DM may affect the proportion of cells that regulate the function of the immune system. Consequently, this deregulation could induce chronic systemic inflammation associated with T2DM. It is worth to mention that the majority of patients with T2DM included in this study were under treatment with metformin or a combination of metformin-glibenclamide. In this regard, previous studies have shown anti-inflammatory properties of these drugs [24, 32]. Therefore, diabetes treatment may affect the proportion of Th17 and Treg cells. Thus, in order to determine the role of these hypoglycemic drugs in the proportion of regulatory T cells in patients with T2DM, more studies should be conducted.
Conclusions
T2DM is a chronic disease that affects multiple organs, and most of the complications appear in patients with a long-term progression of the disease. In this study, we demonstrated important changes in proportion of both Th17 and Treg cells in patients with T2DM. Therefore, we propose that the long-term progression of T2DM as well as uncontrolled blood glucose levels may affect the proportion of cells that regulate the function of the immune system.