

Introduction
Cervical cancer (CC) is one of the most common malignancies in women worldwide [1, 2]. Surgery is the preferred treatment for patients with early CC [3]. Recent studies reported that the use of anesthetics during surgery may affect CC progression [4]. Sevoflurane (Sev) is a commonly used inhaled anesthetic in clinical practice; it plays a vital role in the progression of various tumor cells, including CCs [5-7]. However, it is still unclear whether Sev has an impact on the tumor microenvironment.
Macrophages differentiate from monocytes under the influence of macrophage colony stimulating factor, and are further divided into pro-inflammatory (M1 polarization) and anti-inflammatory (M2 polarization) subtypes [8]. Tumor associated macrophages (TAMs) are among the first preinvasive tumor-infiltrating immune cells and persist in invasive cancer. Further tumor cell-derived factors drive macrophage polarization in one of the TAM subpopulations manifesting the M2 phenotype and contribute to cancer development and progression [9]. The acquisition of pro-tumoral M2 functions by TAMs occurs predominantly in CC development [10]. Therefore, based on M1 vs. M2 polarization of TAMs, the inhibition of M2- and activation of M1-inducing signals were proposed as a possible strategy for CC treatment.
Sev function is mediated via NF-κB signaling, which has been reported as the main regulator for macrophage polarization [11]. In this study, using RNA-sequencing (RNA-seq) technology, we found that Sev regulates multiple elements in NF-κB signaling, including mitogen-activated protein kinase kinase kinase 7 (MAP3K7, also termed TAK1) in TAMs, which is closely related to the malignant biological behavior of tumors and promotes the development of CC [12].
The first step in gene expression is mRNA transcription, which is regulated both transcriptionally and post-transcriptionally. As a novel post-transcriptional regulation, N6-methyladenosine (m6A) epitranscriptional modification has recently attracted substantial attention [13]. Given that sevoflurane regulates m6A modification of many targets [14, 15], we suspect that sevoflurane may also impact the m6A patterns of MAP3K7. In this study, we confirmed the above conjecture and found that m6A patterns of MAP3K7 mediate the regulatory effects of sevoflurane on CC proliferation.
Material and methods
Cell culture
HeLa (cat # CL0134), THP-1 (cat # CL0318) and HEK293T (cat # CL0133) cells were purchased from Hunan Fenghui Biotechnology Co., Ltd, and were used in this study. Mycoplasma testing has been done for all the cell lines used. All the cells have been authenticated by short tandem repeat (STR) identification. THP-1 and HeLa cells were cultured in Roswell Park Memorial Institute (RPMI-1640) medium containing 10% fetal bovine serum at 37oC and 5% CO2. HEK293T were cultured in Dulbecco’s Modified Eagle’s Medium (DMEM) containing 10% fetal bovine serum at 37oC and 5% CO2.
Sev-treated macrophage cells
THP-1 cells were seeded in a six-well culture plate (5 × 10⁵/well) and cultured in RPMI 1640 media with PMA (100 ng/ml, Sigma, USA) for 48 hours, which were considered as M0 macrophages. M0 macrophages were treated with interleukin (IL)-4 (20 ng/ml) and IL-13 (20 ng/ml) for 24 hours to induce M2 macrophages. M0 macrophages that were not treated with IL-4 and IL-13 were used as controls. Subsequently, the cells were transferred to a closed plexiglass box after changing to fresh culture medium. The air inlet of this plexiglass box was connected to the anesthesia vaporizer. The air outlet was connected to the gas analyzer. A gas composition of 5% CO2, 21% O2, and 74% N2 was initially maintained. Before the experiment, Sev gas was delivered to the plexiglass box at a flow rate of 3 l/minute with an anesthetic vaporizer. The Sev gas level was monitored with a gas analyzer. When the content of Sev was 3%, the air inlet and outlets were closed. The cells in the closed plexiglass box were incubated at 37o for 3 hours, and then were transferred to another 37oC incubator for 24 hours, and the supernatant was collected as the M2 macrophage condition. To characterize the effect of M2 macrophages on CC cells, M2 macrophage supernatant was added to Hela cells at 30%.
Transwell assay
The Transwell assay to determine the migration and invasion was conducted using the procedure described in the previous report [16]. Transwell chambers (Corning) without and with a basement membrane coating (Corning) were used to detect the migration and invasion of Hela cells, respectively. For the migration test, cells were placed into chambers of Transwell inserts (2 × 10⁴/well) without basement membrane coating; for the invasion test, cells were placed into chambers of Transwell inserts (2 × 10⁴/well) with basement membrane coating. After incubating the cells with conventional culture medium (control group) or 30% M2 macrophages supernatant supplemented medium (3%Sev group) at 37°C for 24 h, we moved the nonmigratory or noninvasive cells, which were still on the upper surface, by cotton swab. For the migratory or invasive cells, we fixed and then stained with 4% paraformaldehyde and 10% crystal violet respectively, and then counted the cells under a microscope (Olympus Corporation, Tokyo, Japan).
Real-time quantitative PCR
Total RNA was extracted from cells with TRIzol reagent (Thermo Fisher Scientific) and reverse-transcribed using the Eppendorf RealPLEX4 System under the following parameters: 65°C for 5 minutes, 37°C for 15 minutes, and 98°C for 5 minutes. The quantitative PCR (qPCR) parameters were: 95°C for 30 seconds, followed by 40 cycles of 95°C for 5 seconds, 60°C for 5 seconds, and 72°C for 30 seconds. GAPDH was used as the internal control for data normalization.
Primers were as follows:
MAP3K7
Forward: 5'-ACTCACTTGATGCGGT-3'
Reverse: 5'-CGGCGATCCTAGCTTC-3'
TRAF6
Forward: 5'-ATGCGGCCATAGGTTCTGC-3'
Reverse: 5'-TCCTCAAGATGTCTCAGTTCCAT-3'
IKKβ
Forward: 5'-CCGACAGAGTTAGCACGACA-3'
Reverse: 5'-GGCAATCTGCTCACCTGTTT-3'
GAPDH
Forward: 5'-CACCCACTCCTCCACCTTTG-3'
Reverse: 5'-CCACCACCCTGTTGCTGTAG-3'
RNA-seq assay
Technical assistance for RNA seq assay, including total RNA extraction, library construction and sequencing, was provided by BioGenius Bioinformatics Institute (Shanghai, China) as described in their protocols online (https://www.biogenius.cn/). The differential expression analysis on the sequencing data between group was performed using DESeq2. Transcripts with the log |fold change| > 1 and the p-value < 0.05 were identified as significantly differentially expressed between different groups.
Bioinformatics analysis
The Metascape database (https://metascape.org/) is an efficient tool for comprehensive analysis and interpretation of omics in the era of big data, with multiple functions such as function enrichment, interactive analysis, gene annotation, etc. [17]. The differentially expressed targets identified through RNA-seq analysis were imported into the Metascape database for Gene Ontology (GO, p < 0.01 as cutoff value) function.
Luciferase assay
The wild-type (WT) sequence of 3' untranslated regions (3' UTRs) of MAP3K7 and the A-to-T mutant sequence of the specific m6A site were synthesized by FitGene (Guangzhou, China). These sequences were inserted into the pLuciferase reporter vector (pLuc). HEK293T cells were seeded in 12-well plates at 105 cells/well. Subsequently, the cells in specific wells were transfected with 10 ng of the pLuc vectors together with 1 ng of the control luciferase vector using 0.08 µl of the GeneJuice transfection reagent (Merck Millipore, Darmstadt, Germany). Luciferase activity was measured via Dual-Luciferase Reporter Assay (Promega) 48 hours after the transfection.
Anti-m6A RNA immunoprecipitation (anti-m6A RNA-IP)
Anti-m6A RNA-IP analysis was used according to a reported method [18]. Briefly, mRNA was fragmented using RNA fragmentation reagent (Invitrogen) at 70°C for 15 minutes. A small amount of the fragmented RNA was left aside as input RNA. Fragmented RNA was immunoprecipitated with anti-m6A antibody coupled to Dynabeads (Invitrogen) in immunoprecipitation buffer at 4°C for 2 hours. m6A containing mRNAs were eluted twice with 6.7 mM N6-methyladenosine 5'-monophosphate sodium salt (Sigma-Aldrich) at 4°C for 1 hour and precipitated with 5 mg of glycogen (Life Technologies, AM9510), one-tenth volumes of 3 M sodium acetate (Sigma-Aldrich) in 2.5 volumes of 100% ethanol at –80oC overnight. The m6A enrichment was formed by qPCR analysis.
Western blot detection
Cells were lysed, and SDS-PAGE loading buffer was then added to the lysate in the proportion of 1 : 2, incubated at 100oC in a metal bath for 10 min, and then SDS-PAGE electrophoresis was carried out. After that, trarsmembrane was performed using 250 mA constant current with rotation for 90 min. After sealing with a TBST solution containing 5% milk for 2 h, primary antibodies and second antibodies were used to incubate the membrane in a certain order. Thereafter, the membrane was developed by the chemiluminescence method using a gel imager. The primary antibody for MAP3K7 was purchased from Abcam (cat # ab109526).
In vivo tumor-bearing mice
The in vivo HeLa tumor-bearing mice were treated according to the previous report [19]. Female Balb/c nude mice were inoculated subcutaneously with HeLa cells (1.0 × 10⁶ cells/mouse) in the right armpit. When the tumor size reached 100 mm3, the mice were randomly divided into the normal group, Sev group, LPS group and Sev + LPS group. The normal group mice were exposed to air as negative controls and the Sev group were exposed to 1.5% Sev for 1.5 h once a day, for the first three consecutive days, according to the previous report [20]. The Sev + LPS group received a 4 µg/g lipopolysaccharide (LPS) intraperitoneal injection once daily after full recovery from sevoflurane exposure for three consecutive days. The mice without sevoflurane exposure that only received 4 µg/g of LPS were allocated to the LPS group as a control. Each group consisted of 8 mice. The body weight and the tumor volume were measured throughout the experiment. The endpoint was set as 16 days after Sev treatment. Tumor tissues were harvested, with a portion being minced into 2-4 mm pieces and digested with collagenase. Tumor tissues were homogenized thoroughly, and were used for ELISA assay on arginase-1 (Arg-1) and transforming growth factor β (TGF-β). These in vivo experiments were approved by the Experimental Animal Welfare and Ethics Committee of Shandong Provincial Third Hospital (approval number: SYDW-202404).
Statistical analysis
The data are expressed as mean ± standard deviation. These experiments were carried out in triplicate. SPSS16.0 software (SPSS, Inc., Chicago, IL, USA) was used to conduct the two-tailed t-test to determine the differences between groups. P < 0.05 was considered a statistically significant difference.
Results
3% Sev enhanced TAMs’ M2 polarization
First, THP-1 cells were induced to M2 macrophages, with or without 3%Sev exposure. Twenty-four hours later, the cells were harvested and M2 markers were determined. Compared with the control THP-1, 3%Sev exposed THP-1 cells expressed more M2 markers IL-10 and TGF-β (Fig. 1A).
Fig. 1
3%Sev promotes cervical cancer (CC) cell proliferation, migration and invasion by enhancing TAMs’ M2 polarization. A) THP-1 cells were pretreated with 100 ng/ml phorbol myristate acetate (PMA) and used as M0 macrophages. PMA-treated THP-1 cells (M0) were treated with IL-4 and IL-13 to induce M2 macrophages, with or without 3%Sev exposure. Twenty-four hours later, the M2 markers of the macrophages, including IL-10 and TGF-β, were determined by ELISA on cell-free supernatant. B-D) Hela cells were cocultured with M2 conditional medium from the 3%Sev group or control group, and the cell migration rate (%) and invasion rate (%) were determined by a transwell assay. B) Representative microscopic image of migratory cells and invasive cells in control group and 3%Sev treated group; C) Statistical cell migration rate (%) results; D) Statistical cell invasion rate (%) results. Data are expressed as mean ± standard deviation. These experiments were carried out in triplicate. *p < 0.05, **p < 0.01, ***p < 0.001
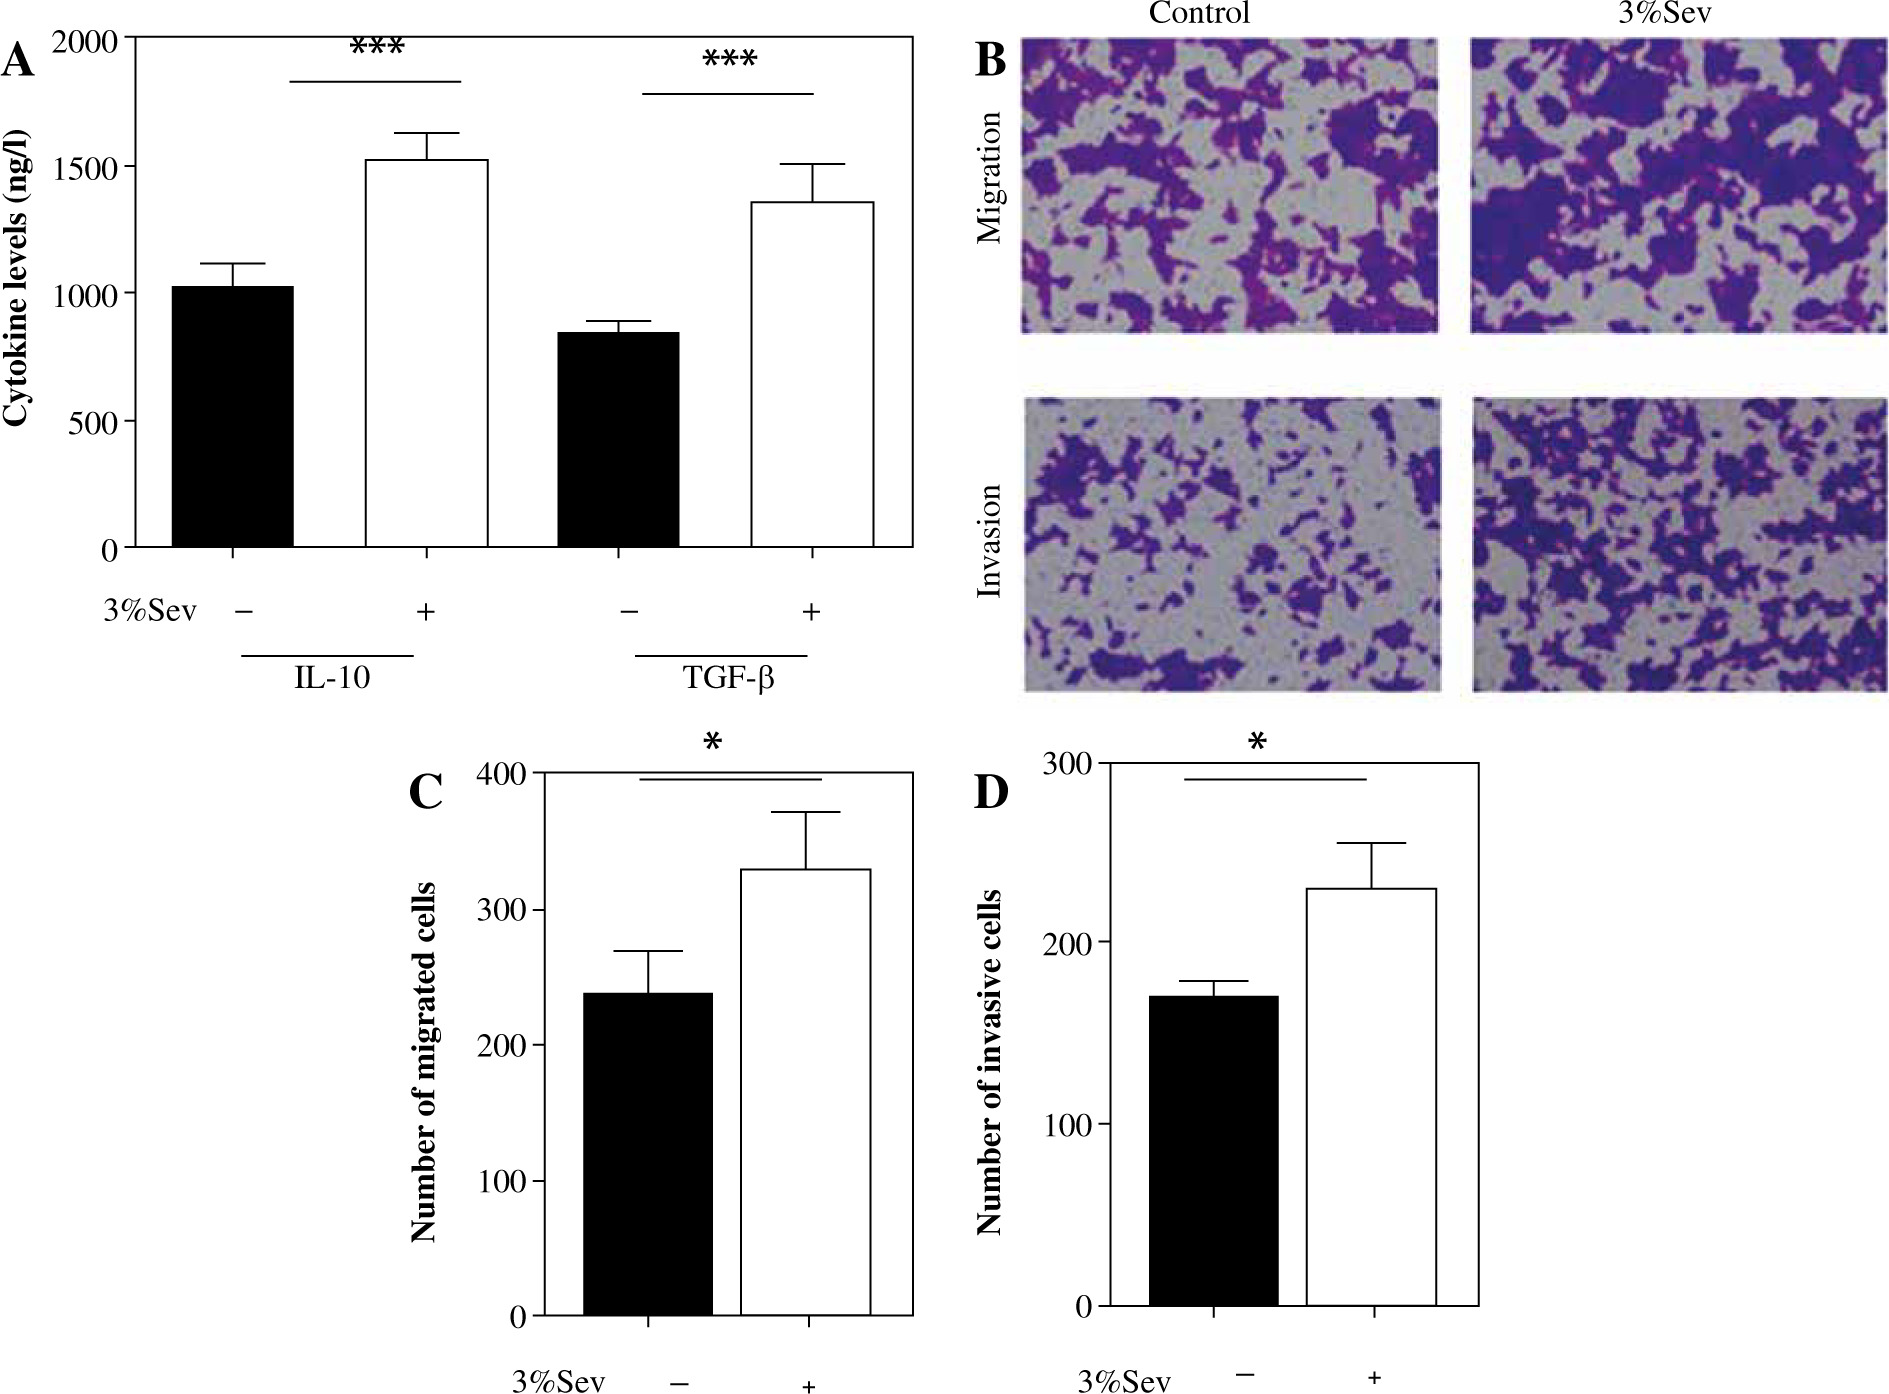
Next, we cocultured Hela cells with M2 conditional medium from the 3%Sev group (M2 macrophages were treated with 3%Sev) or control group (M2 macrophages were not treated with 3%Sev). The results of the Transwell assay revealed that the cell migration and invasion (Fig. 1B-D) were higher in the 3%Sev group than the control group. The above results demonstrated that 3%Sev could up-regulate the TAMs’ M2 polarization and therefore enhance the stimulatory effect of M2 TAMs on the migration and invasion of CC cells.
3%Sev inhibits NF-κB signaling activation in M2 macrophages in an MAP3K7 dependent manner
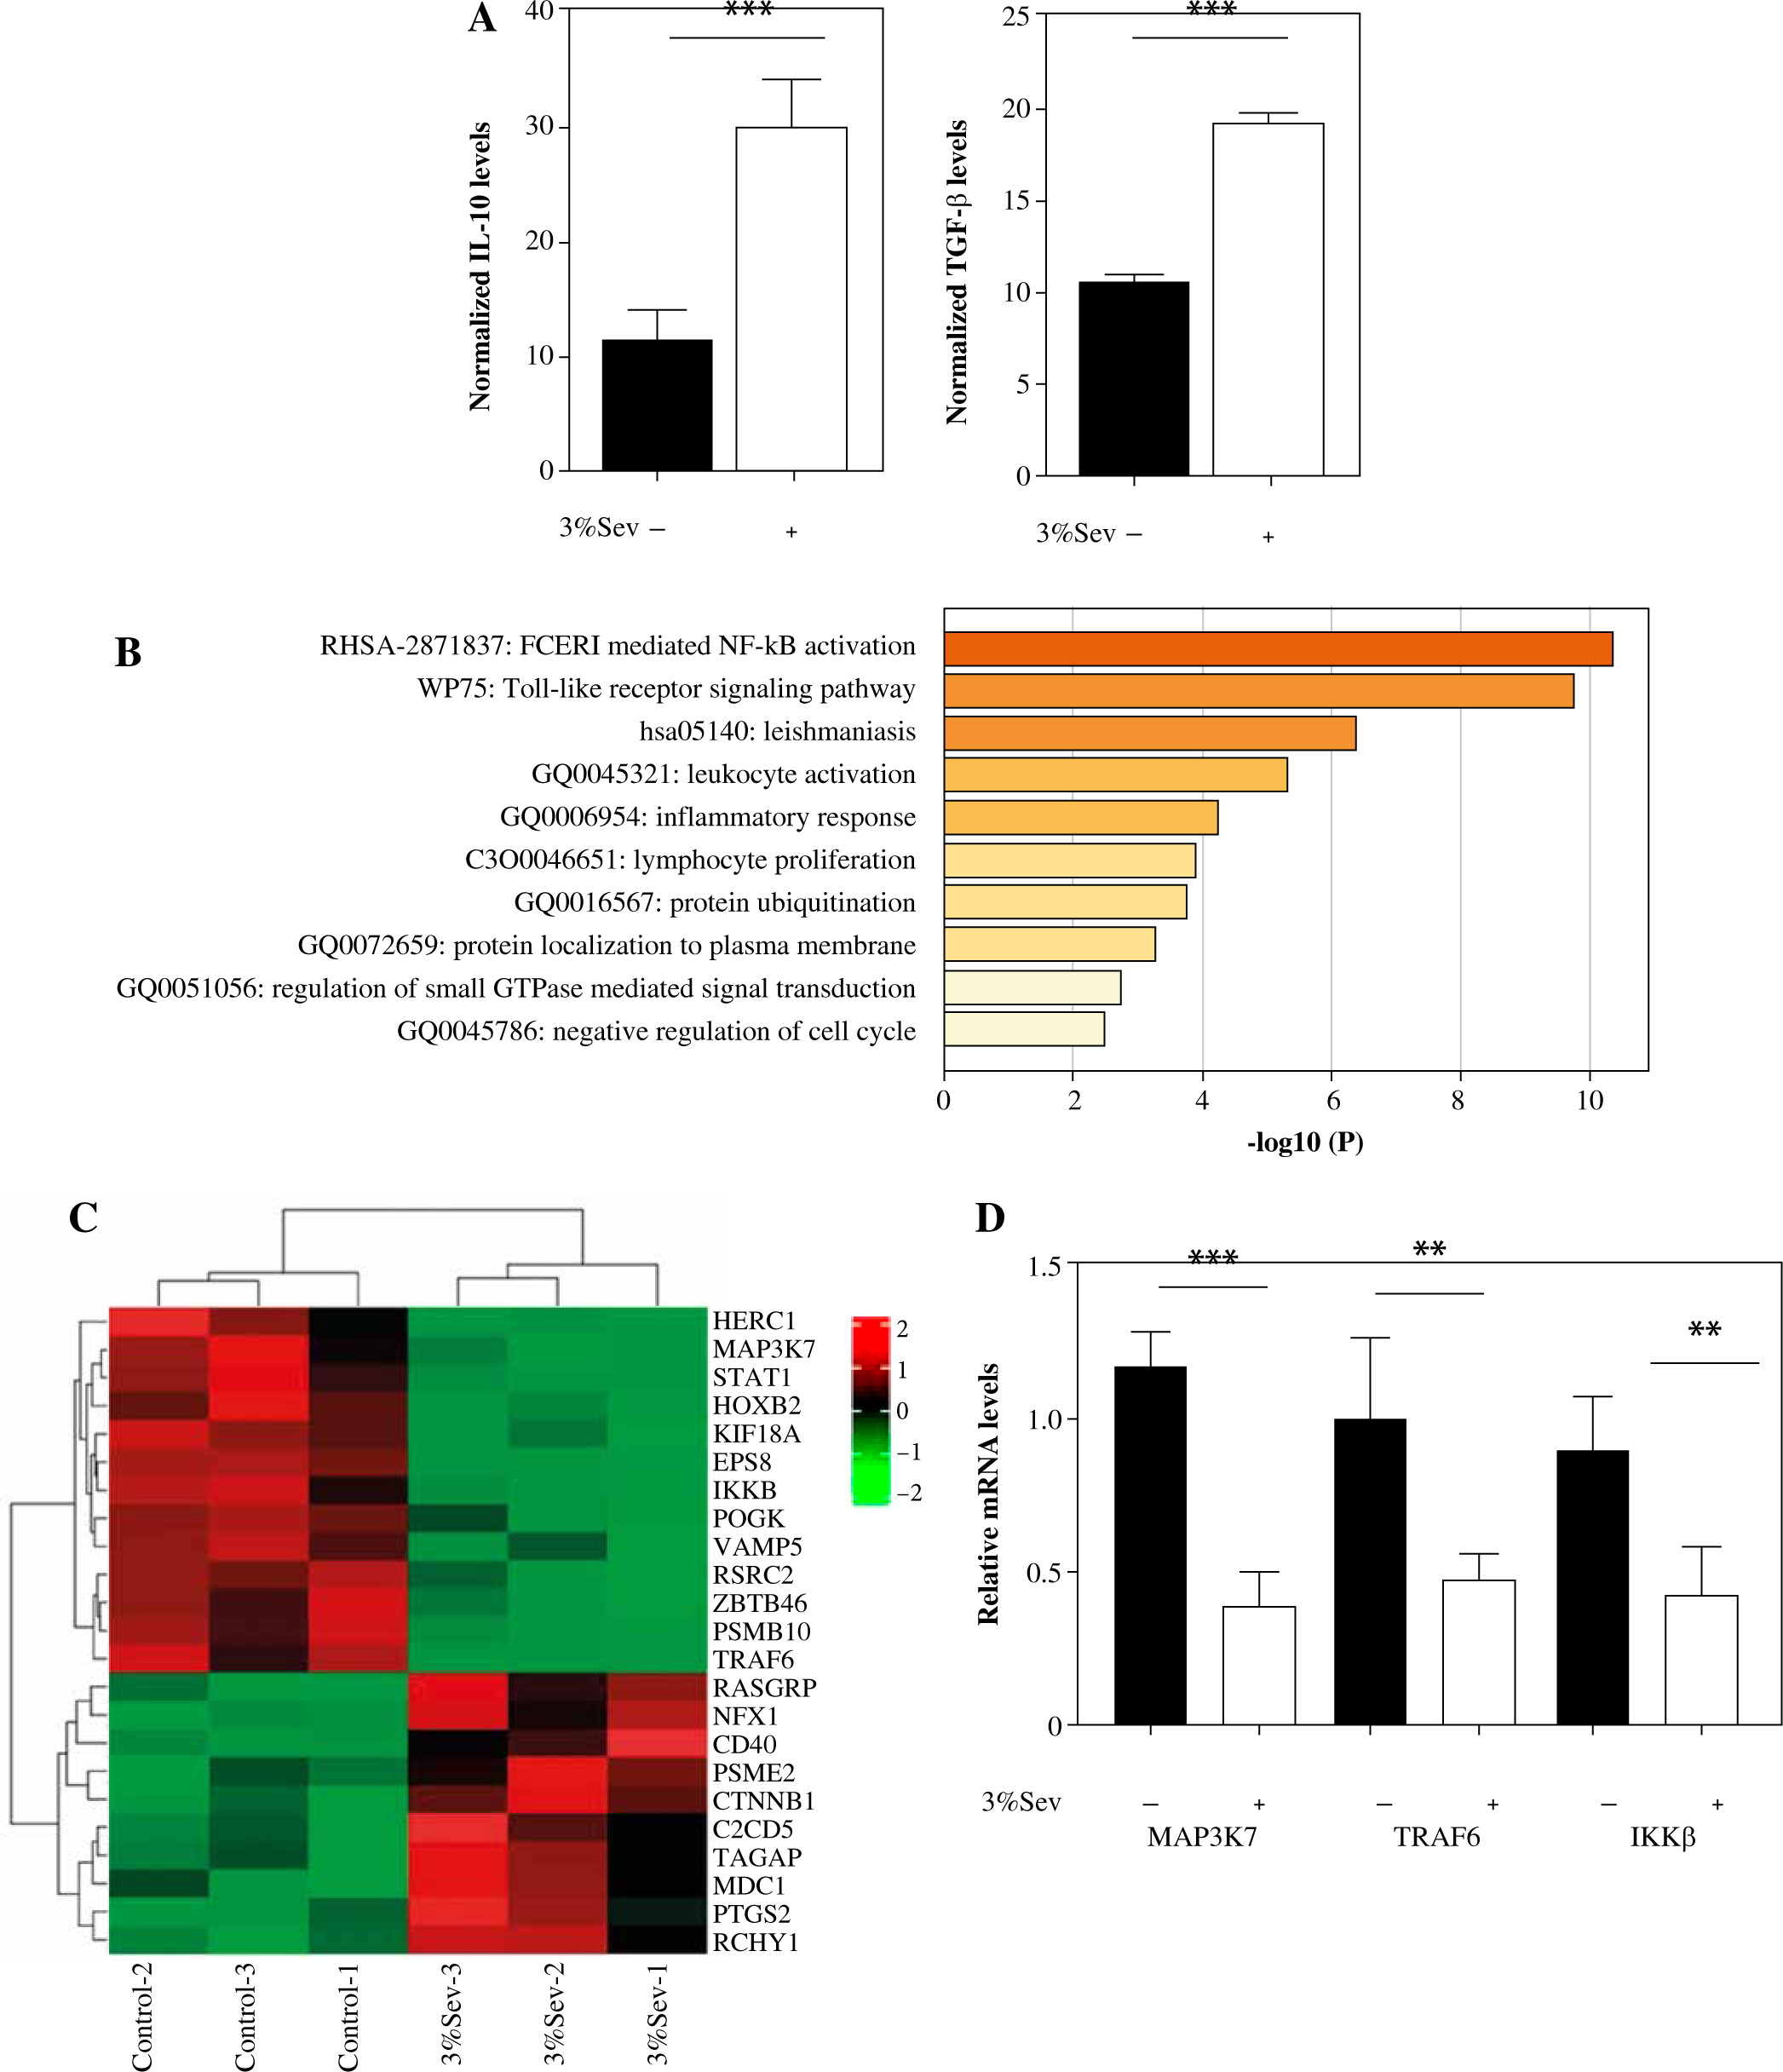
Next, we treated the M2 THP1 cells with or without 3%Sev, followed by RNA-seq to identify the differentially expressed transcripts. The RNA-seq results indicated that IL-10 and TGF-β transcripts were both enhanced by 3%Sev (Fig. 2A, B), which is in accordance with their protein expression trends (Fig. 1A). GO enrichment analysis of all the differentially expressed targets (including both down-regulated targets and up-regulated targets) was conducted by Metascape: we found that among the 3%Sev regulated targets, a series of targets were strongly involved in NF-κB activation (Fig. 2C). The heatmap in Figure 2D shows that the NF-κB pathway involved a cluster. Then, we tested several important targets by qRT-PCR, confirming that the key regulators of NF-κB signaling, such as TRAF6, MAP3K7 (TAK1) and IKKβ, were all decreased by 3%Sev exposure (Fig. 2E).
Fig. 2
Identification of 3%Sev-related pathway via RNA-seq combined with bioinformatics analysis. A-C) M2 THP1 cells were treated with or without 3%Sev, followed by RNA-seq to identify the differentially expressed transcripts. A) Comparison of differences of IL-10 and TGF-β transcripts between the cells in the 3%Sev group and control group, based on RNA-seq results. B) The top-level GO biological processes of the differentially expressed transcripts between the cells in the 3%Sev group and control group. The plot was determined and drawn by Metascape Gene List Analysis. C) Heatmap showing the differentially expressed transcripts involved in NF-κB signaling between the cells in the 3%Sev group and control group. D) qRT-PCR to confirm the MAP3K7, TRAF6 and IKKβ levels in the cells described in Figure 2A-C
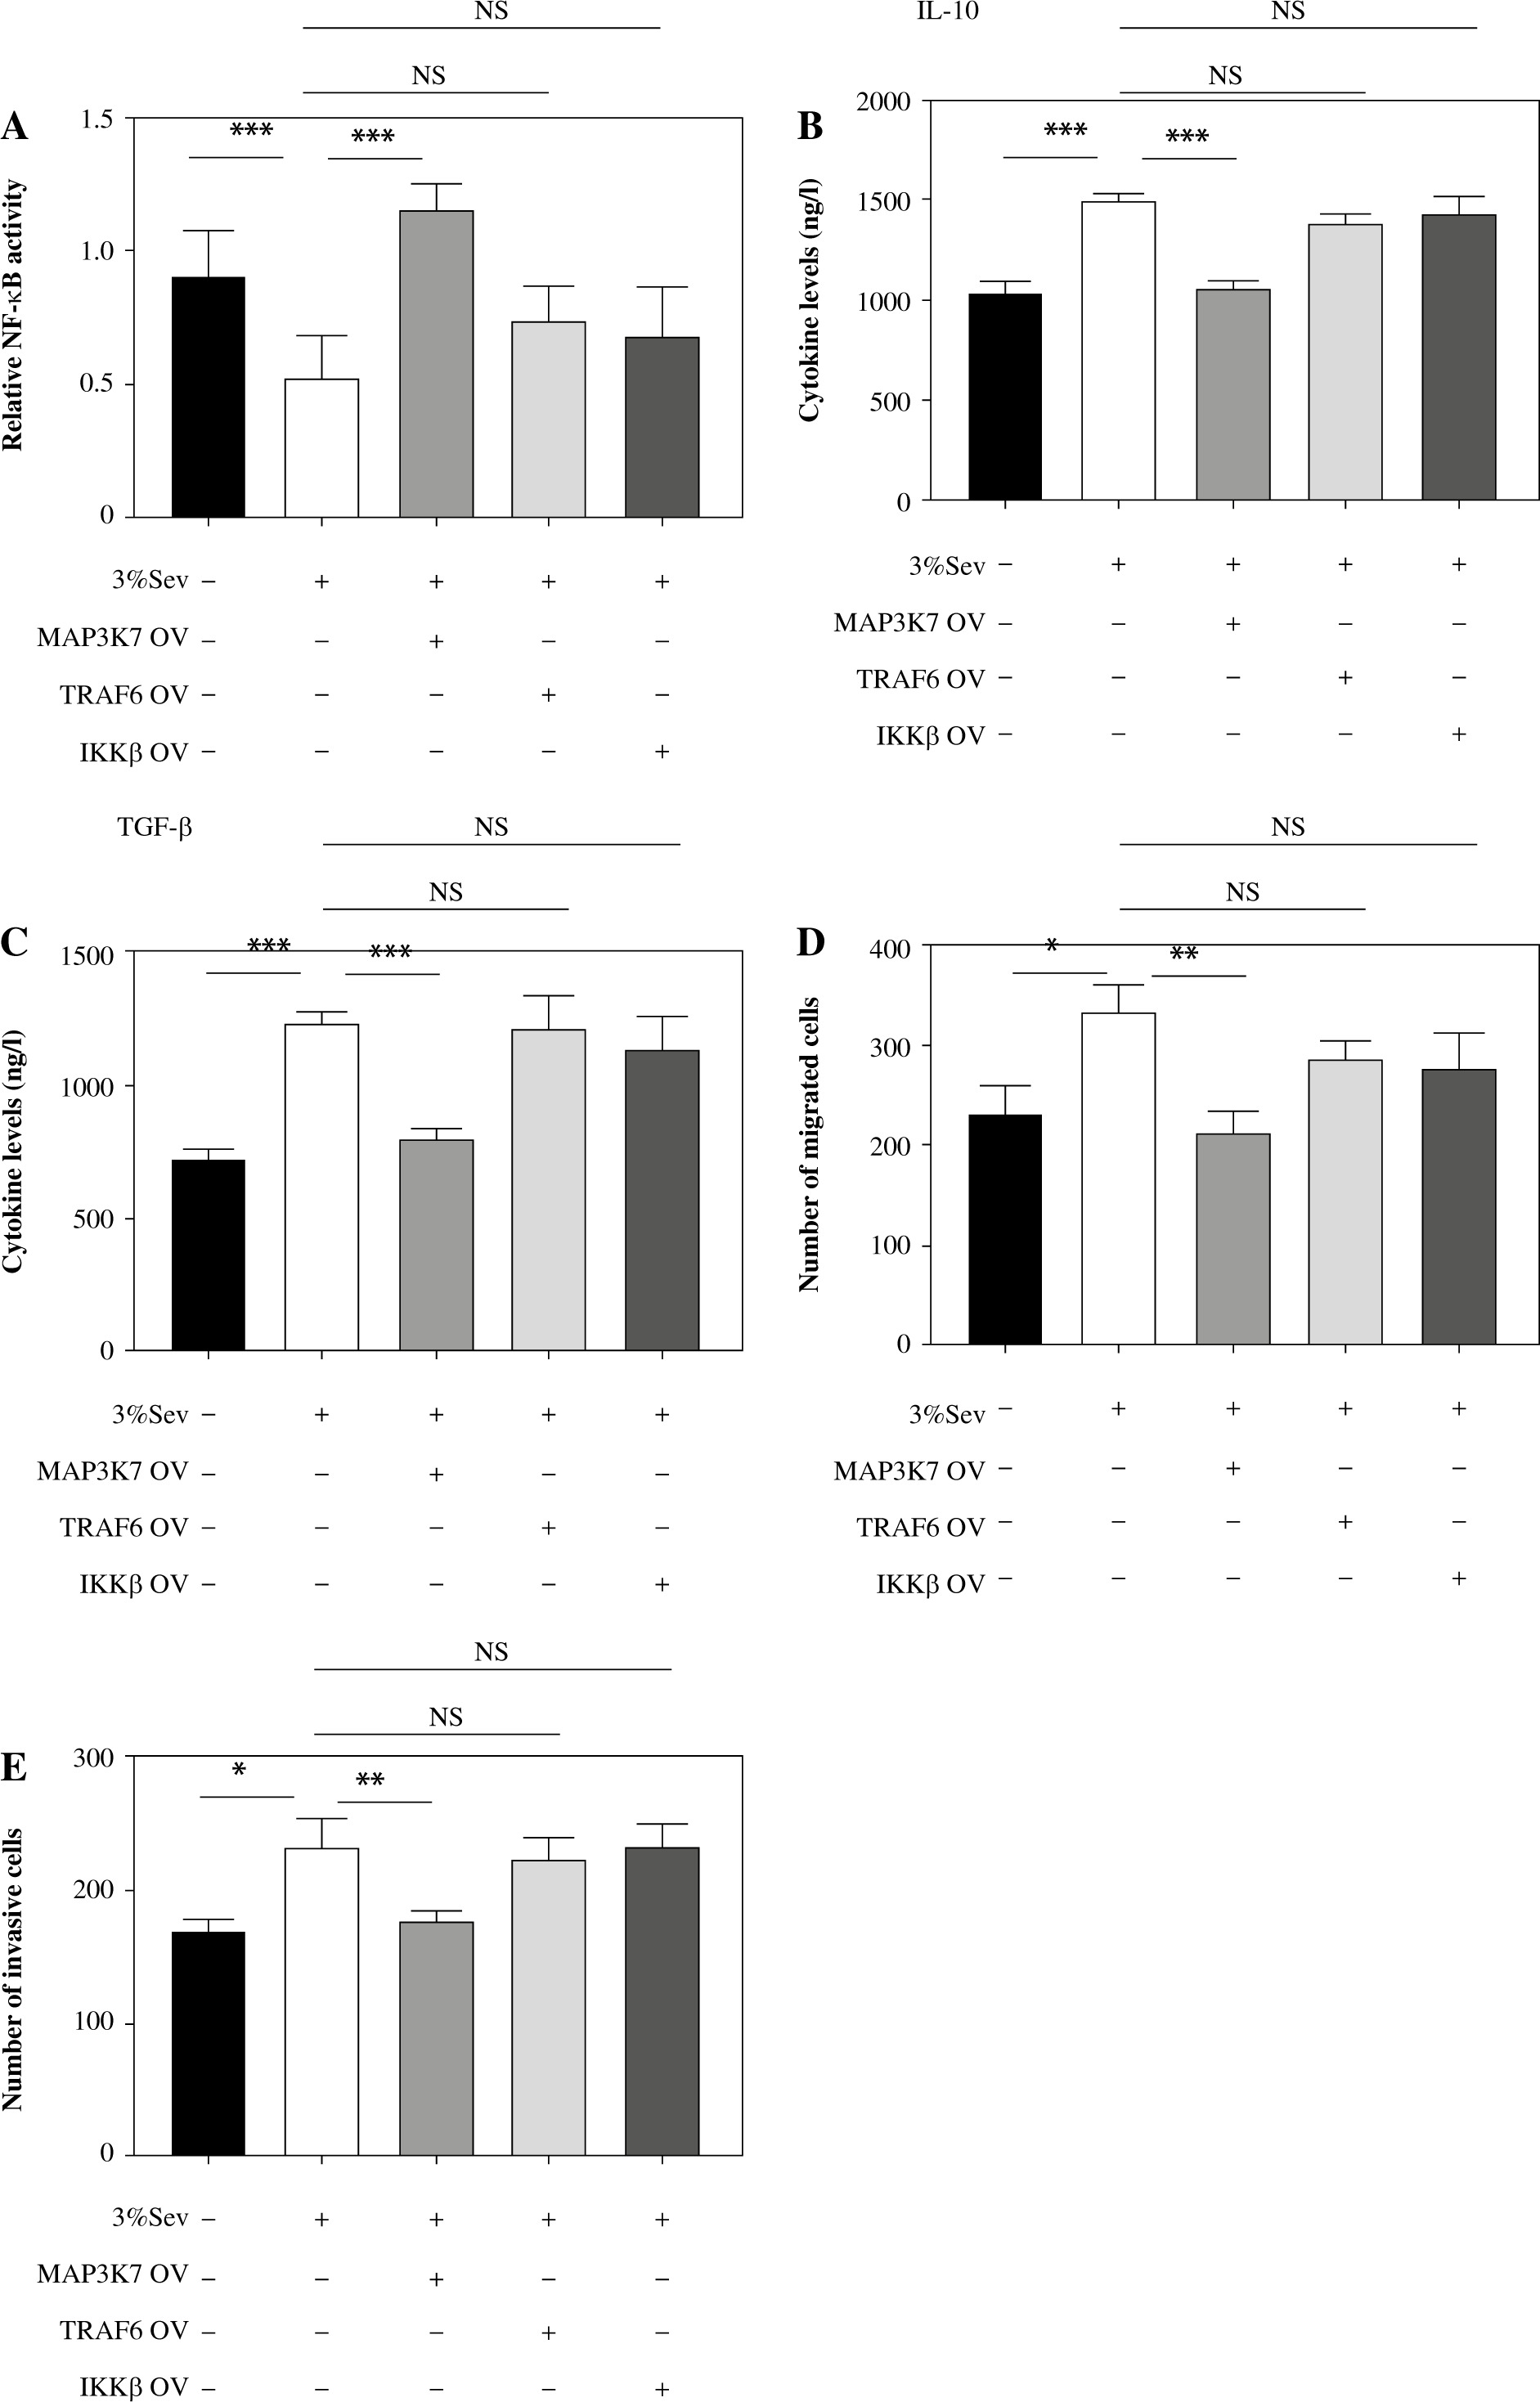
Next, we performed luciferase reporter assay in HEK293T cells to monitor the NF-κB activity, finding that 3%Sev decreased the NF-κB activity, which was reversed by MAP3K7 overexpressing plasmid (MAP3K7-OV), independent of TRAF6 or IKKβ overexpressing plasmid (TRAF6-OV and IKKβ-OV) (Fig. 3A). Meanwhile, we pre-transduced MAP3K7, TRAF6 or IKKβ overexpressing lentivirus (MAP3K7-OV, TRAF6-OV or IKKβ-OV) into the M2 THP-1 cells, with or without subsequent 3%Sev exposure to determine the regulatory effect of TRAF6, MAP3K7 and IKKβ on 3%Sev function. We found that 3%Sev-enhanced IL-10 and TGF-β (M2 marker) levels could be reversed by MAP3K7-OV, independently of TRAF6-OV or IKKβ-OV (Fig. 3B, C). Further, we cocultured Hela cells with indicated M2 conditional media which were harvested from the above M2 THP-1 cells. We found that the cell migration and invasion (Fig. 3D, E) of Hela cells, which were increased in the 3%Sev group, could be reversed in the MAP3K7-OV group, but could not be regulated in the TRAF6-OV or IKKβ-OV group. Collectively, these results indicated that 3%Sev inhibits NF-κB signaling activation in M2 macrophages, and MAP3K7, but not TRAF6 and IKKβ, mediates NF-κB signaling and M2 polarization alternation regulated by 3%Sev.
Fig. 3
3%Sev inhibits NF-κB signaling activation in M2 macrophages in MAP3K7 dependent manner. A) HEK293T cells were pre-treated with or without MAP3K7, TRAF6 or IKKβ overexpressing plasmid (MAP3K7-OV, TRAF6-OV or IKKβ-OV) and NF-κB luciferase reporter for 24 hours, followed by treatment with or without 3%Sev for 3 hours. They were transferred to a 37oC incubator for another 24 hours. The NF-κB activation was performed by luciferase reporter assay. B, C) THP-1 cells were pretreated with 100 ng/ml phorbol myristate acetate (PMA) and used as M0 macrophages. PMA-treated THP-1 cells (M0) were pre-transduced with or without MAP3K7, TRAF6 or IKKβ overexpressing lentivirus (MAP3K7-OV, TRAF6-OV or IKKβ-OV) for 48 hours, and then were treated with IL-4 and IL-13 to induce M2 macrophages, with or without 3%Sev exposure. Twenty-four hours later, the B) IL-10 and C) TGF-β were determined by ELISA on cell-free supernatant. D, E) CC cells were cocultured with indicated M2 conditional medium described in Figure 3B, C. Twenty-four hours later, the D) cell migration rate (%) and E) invasion rate (%) were determined by a transwell assay. Data are expressed as mean ± standard deviation. These experiments were carried out in triplicate. *p < 0.05, **p < 0.01, ***p < 0.001
3% Sev decreases MAP3K7 levels partly post-transcriptionally by modifying MAP3K7 m6A methylation
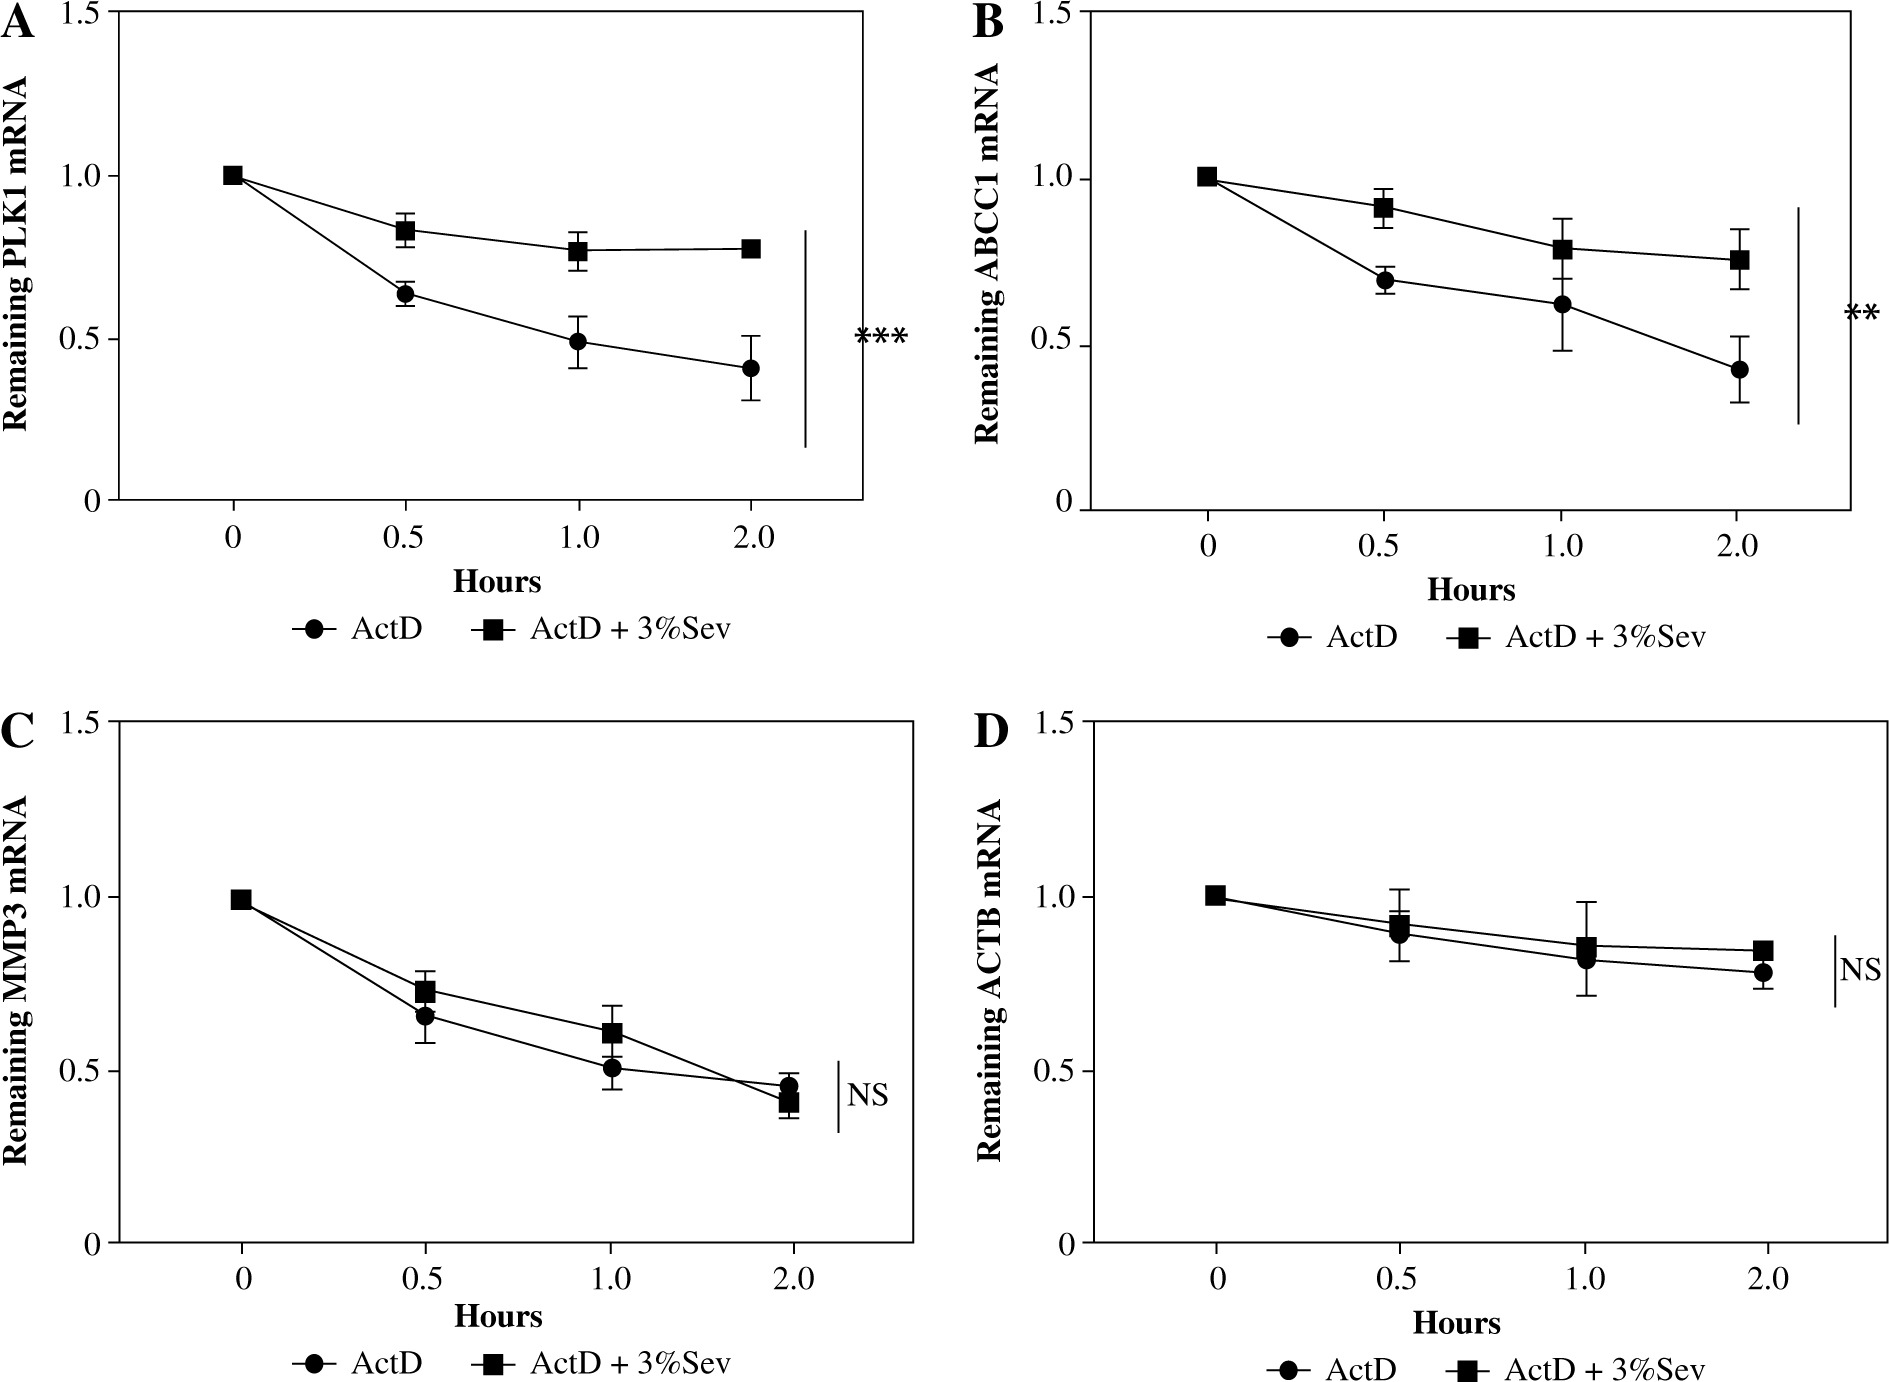
The mRNA levels may be induced transcriptionally or post-transcriptionally [21]. Post-transcription regulation was tested using the transcription inhibitor actinomycin D (ActD) in M2 THP-1. The TRAF6, MAP3K7 and IKKβ transcripts decayed significantly (Fig. 4A-C), while the control ACTB decayed little within 4 hours of ActD treatment (Fig. 4D). Treatment with 3%Sev 3 hours prior to ActD addition significantly accelerated TRAF6 and MAP3K7 mRNA decay (Fig. 4A, B). In contrast, we observed little effect of 3%Sev on IKKβ decay (Fig. 4C).
Fig. 4
3%Sev decreases TRAF6 and MAP3K8 levels partly post-transcriptionally. THP-1 cells were pretreated with 100 ng/ml phorbol myristate acetate (PMA) and used as M0 macrophages. PMA-treated THP-1 cells (M0) were treated with IL-4 and IL-13 to induce M2 macrophages, with or without 3%Sev exposure and 5 mg/ml ActD treatment (ActD was added 3 hours before 3%Sev exposure). After adding ActD for the indicated period (0-4 hours), the transcripts of A) MAP3K7; B) TRAF6; C) IKKβ and D) ACTB were measured by qRT-PCR. Data are expressed as mean ± standard deviation. These experiments were carried out in triplicate. *p < 0.05, **p < 0.01, ***p < 0.001
The m6A methylation in 3' UTR is a new type of post-transcriptional regulation involved in RNA stability [22]. We then performed anti-m6A RNA-IP in M2 THP-1 and found that MAP3K7 mRNA precipitated less efficiently following 3%Sev treatment. Pre-transducing with METTL3 overexpressing lentivirus up-regulated the m6A levels in both 3%Sev and control groups equally efficiently (Fig. 5A). These results indicated that 3%Sev exposure regulated MAP3K7 m6A methylation via a METTL3-dependent pathway.
Fig. 5
3%Sev modifies MAP3K7 m6A methylation. A) THP-1 cells were pretreated with 100 ng/ml phorbol myristate acetate (PMA) and used as M0 macrophages. PMA-treated THP-1 cells (M0) were pre-transduced with or without METTL3 overexpressing lentivirus (METTL3-OV) for 48 hours, and then were treated with IL-4 and IL-13 to induce M2 macrophages, with or without 3%Sev exposure. Twenty-four hours later, the cells were harvested to perform anti-m6A RNA-IP. B) Predicted m6A site in 3' UTR of MAP3K7. C) Reporter assays using HEK293T cells: The cells were transfected with the WT MAP3K7 3' UTR luciferase reporter and ABCDE mutant MAP3K7 3' UTR luciferase reporter for 24 hours. They were then treated with or without 3%Sev exposure. Twenty-four hours later, the cells were harvested to perform the luciferase reporter assay. Data are expressed as mean ± standard deviation. These experiments were carried out in triplicate. *p < 0.05, **p < 0.01, ***p < 0.001 D) Reporter assays using HEK293T cells: The cells were transfected with the WT MAP3K7 3' UTR luciferase reporter and the MAP3K7 3' UTR luciferase reporter with the indicated site mutation for 24 hours, and treated with or without 3%Sev exposure. Twenty-four hours later, the cells were harvested to perform the luciferase reporter assay. The histogram represents the luciferase fold change expressed by 3%Sev group/control group for each reporter. E) THP-1 cells were pretreated with 100 ng/ml phorbol myristate acetate (PMA) and used as M0 macrophages. PMA-treated THP-1 cells (M0) were pre-transduced with or without METTL3 overexpressing lentivirus (METTL3-OV) for 48 hours, and then were treated with IL-4 and IL-13 to induce M2 macrophages, with or without 3%Sev exposure. Twenty-four hours later, the cells were harvested and the MAP3K7 protein levels were determined by western blotting assay. Data are expressed as mean ± standard deviation. These experiments were carried out in triplicate. *p < 0.05, **p < 0.01, ***p < 0.001
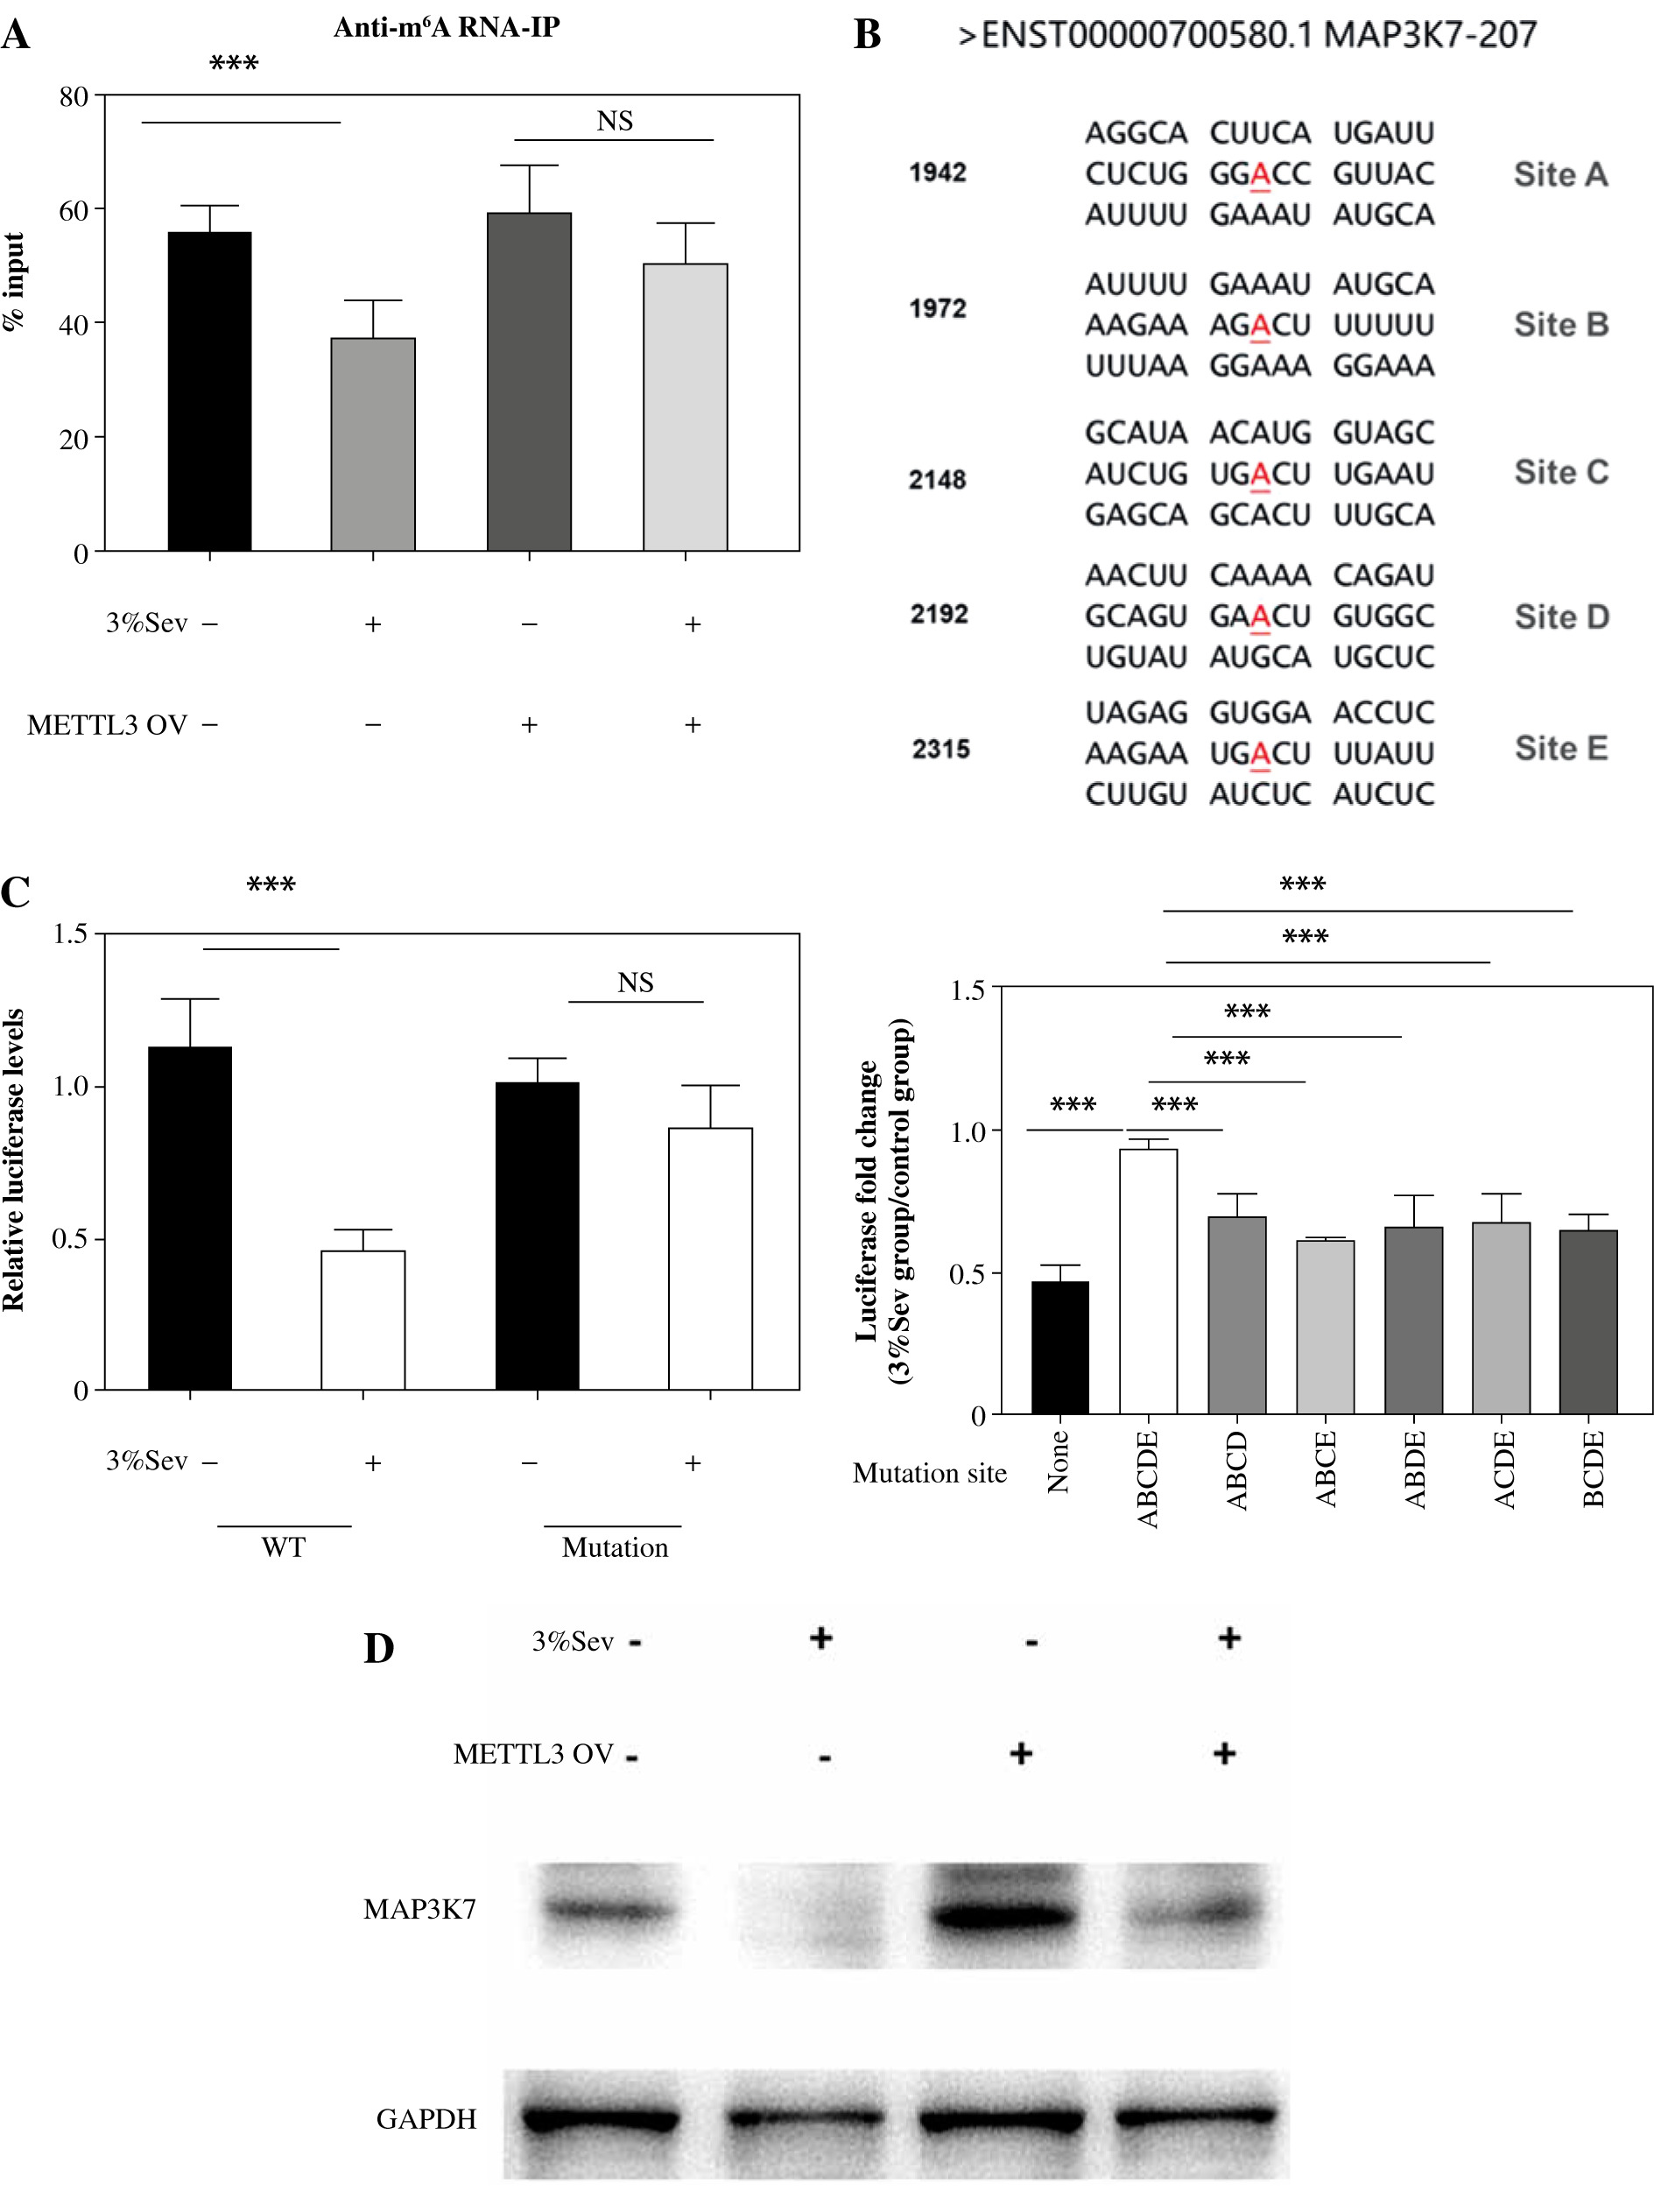
Using the SRAMP program [23], we predicted that MAP3K7 carries five potential m6A methylation sites (Fig. 5B). We constructed a luciferase reporter containing WT MAP3K7 3' UTR, or the mutant of all five m6A sites (ABCDE), and performed the luciferase reporter assay in HEK293T cells. The luciferase levels of the WT MAP3K7 3' UTR group (lacking mutation sites) were significantly decreased in response to 3%Sev, with a decrease rate of approximately 60%. This down-regulation was significantly weakened in the mutant group (ABCDE) (Fig. 5C). We mutated 4 m6A sites in different combinations (leaving one unchanged), and tested the fold changes in luciferase levels between 3%Sev and control groups. The fold changes in groups with ABCD, ABCE, ABDE, ACDE, and BCDE mutants were all higher than in the ABCDE mutant group (Fig. 5D). These results indicated that all five m6A sites were modified by 3%Sev. Next, we performed western blotting assay in M2 THP-1 and found that MAP3K7 was lower in 3%Sev treatment, compared with the control group. Meanwhile, pre-transducing with METTL3 overexpressing lentivirus could enhance the MAP3K7 levels in both 3%Sev and control groups equally efficiently, confirming that 3%Sev regulated the MAP3K7 levels through the METTL3/m6A pathway (Fig. 5E).
Sev promotes CC cells growth and TAM M2 polarization in vivo
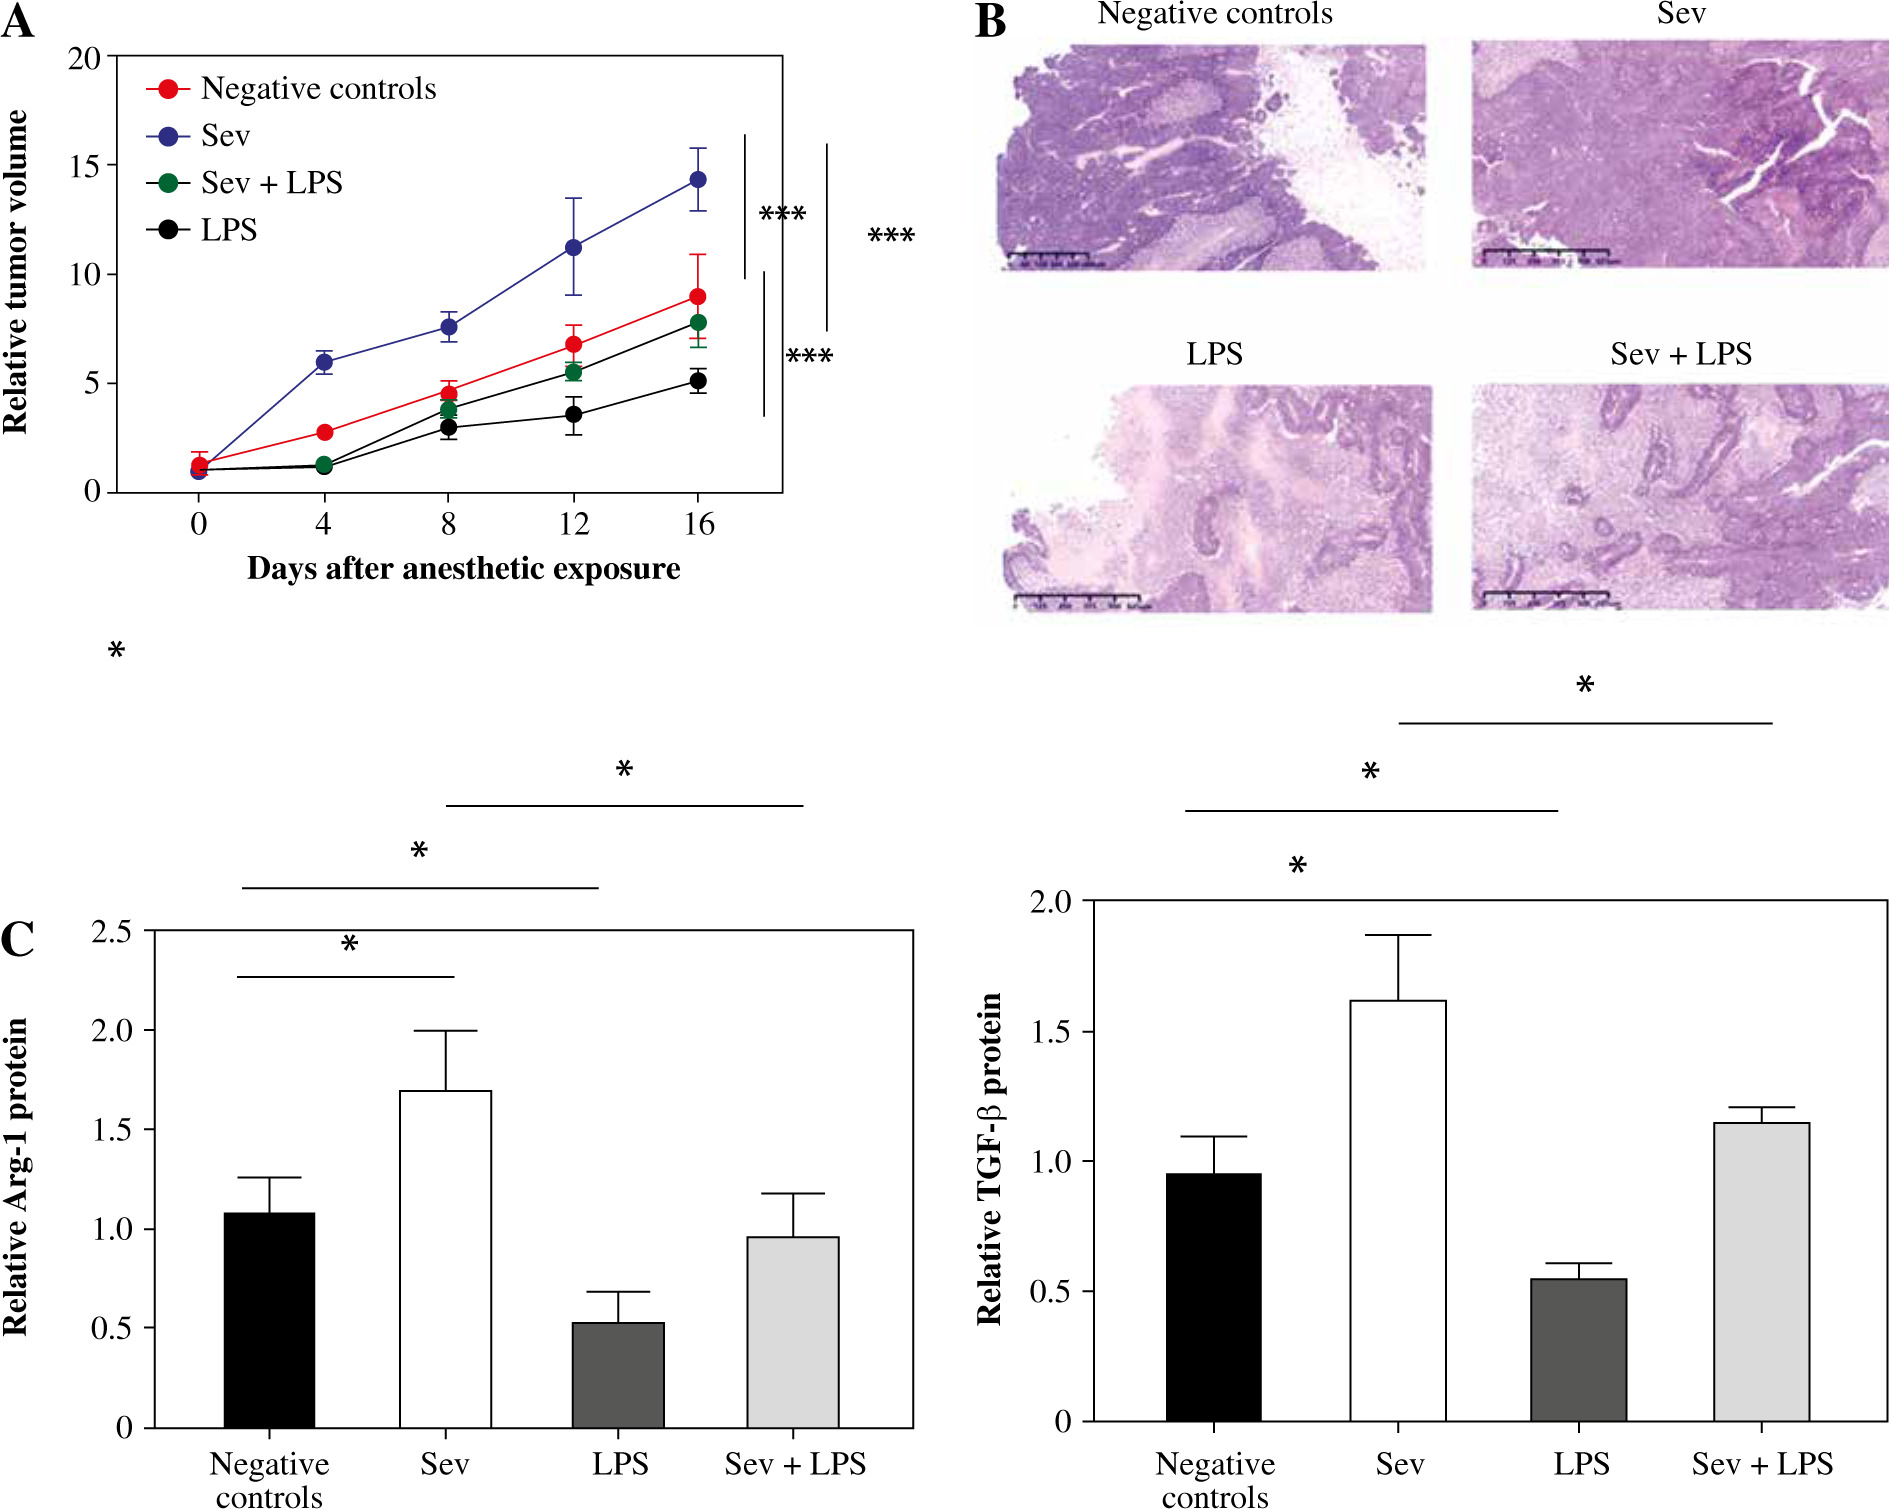
Next, Hela cells were used to construct tumor bearing mouse models for the exploration of the effect of Sev. As shown in Figure 6A, the tumor volume in the Sev group increased more rapidly than the negative control group, while LPS displayed significant tumor growth inhibition. The promoting effect of Sev on tumor growth was reversed in the Sev + LPS group. Meanwhile, tumor tissues were processed for H&E staining assay and we found that there was a large area of tumor tissue in the negative control group, which also exhibited inflammation and vascular proliferation. In the Sev group, the tumor area was even larger than that in the negative control group, and this trend could be reversed by LPS (Fig. 6B). We further detected the M2 markers in tumor tissues of differently treated mice to verify that the Sev effect was associated with M2 macrophages. The results showed that the expression of Arg-1 and TGF-β in the tumor tissue of mice was upregulated, while that in the Sev + LPS group showed reversed results (Fig. 6C). These results indicated that Sev promotes CC cell growth and TAM M2 polarization in vivo.
Fig. 6
Sev promotes cervical cancer (CC) cell growth and TAM M2 polarization in vivo. Female Balb/c nude mice were inoculated subcutaneously with HeLa cells (1.0 × 10⁶ cells/mouse) in the right armpit. The mice were grouped as the negative control group, Sev group, LPS group and Sev + LPS group according to the specific treatment described in materials and methods section. A) Tumor volume development among the groups after anesthetic exposure; B) H&E staining of tumor tissue sections among the groups after anesthetic exposure; C) Comparison of specific M2 markers Arg-1 and TGF-β among the groups at the endpoint of the experiments. Data are expressed as mean ± standard deviation. Each group includes 8 mice. *p < 0.05, **p < 0.01, ***p < 0.001
Discussion
Recent research findings on exploring Sev’s regulation of CC development are controversial. Zhang et al. found that Sev can promote the proliferation of HeLa cells [6], while Ding et al. discovered that Sev has anti-cancer effects [4]. Furthermore, it was reported that Sev can regulate key immune cells in the tumor microenvironment through different signaling pathways [24]. All of these findings suggest that Sev may have multiple regulatory roles in tumor progression.
We compared the transcripts of M2 THP-1 between 3%Sev and control groups by RNA-seq to explore the genome-wide regulatory mechanism of sevoflurane in TAM cells. Based on bioinformatics analysis of the RNA-seq data, followed by qRT-PCR, we identified a cluster of genes, strongly associated with NF-κB signaling, most of which were decreased, suggesting a key role in sevoflurane-regulated activity. MAP3K7 is among the most significantly down-regulated targets. MAP3K7-OV effectively reversed 3%Sev-decreased NF-κB activation, and reversed 3%Sev-enhanced TAMs M2 polarization.
MAP3K7 is a key factor regulating NF-κB-mediated inflammation, thereby affecting the progression of macrophage polarization [25]. In view of the important role of MAP3K7 in the tumor microenvironment and tumor development, we further explored the regulatory mechanism of 3%Sev in MAP3K7 expression. By using ActD, we confirmed that 3%Sev decreased the mRNA stability of MAP3K7. Also, we identified the mechanism of 3%Sev-decreased MAP3K7 mediated via dynamic m6A modification of the MAP3K7 3' UTR. It is well known that the formation of m6A is triggered by m6A “writers”, including METTL3, METTL14, and WTAP [26]. Our results indicated that METTL3 overexpression eliminated the gap between cells treated with 3%Sev and controls, indicating that the function of 3%Sev was mediated via a METTL3-dependent pathway.
Previous experiments demonstrated that m6A preferably forms on the DRACH motif, and occurs more frequently on the GAC than AAC in vivo [27]. Zhou et al. extracted and integrated the sequence and predicted structural features around m6A sites using a machine learning framework and built a mammalian m6A site predictor: SRAMP [23]. Using this predictor, we identified 5 m6A sites in the 3' UTR of human MAP3K7. Our results derived from the 3' UTR reporter assay suggest that sevoflurane regulated the methylation level of all these m6A sites.
The present study also confirmed that Sev promotes CC cell growth and TAM M2 polarization in vivo, and LPS injection after Sev exposure induced tumor volume reduction. It is widely recognized that LPS can change the TAM polarizations in the tumor microenvironment. For example, it was reported that LPS injection into xenograft mice modulated the macrophage phenotype polarization in blood and spleen, and changed M1 or M2 macrophage infiltration into the xenograft tumor and spleen [28]. Therefore, our results demonstrated that the switch of TAM M1/M2 polarization would be a mediator for the function of Sev in CC.
In addition to Sev, many other anesthetics have been proven to regulate macrophage M2 polarization. For example, by modulating signaling pathways such as STAT6 and PI3K/Akt, lidocaine and ropivacaine can enhance the IL-10 and TGF-β levels, inhibit pro-inflammatory cytokines, and promote M2 macrophage polarization [29]. Also, propofol could enhance M2 polarization through PPARγ/STAT3 signaling [30]. These results indicated that the promoting effect of anesthetics on macrophage M2 polarization is a widespread phenomenon.
Anesthetic-related macrophage M2 polarization has both beneficial and detrimental effects on the host. On one hand, it is of significant importance as it promotes anti- inflammatory and tissue repair responses. On the other hand, this effect provides a favorable environment for tumor growth. Therefore, further research is needed to control anesthetic-related macrophage M2 polarization.