INTRODUCTION
Overweight and obesity, characterized by excessive accumulation or abnormal distribution of body fat are chronic metabolic disorders arising from the complex interplay of genetic predisposition and environmental influences [1]. In recent decades, these conditions have emerged as severe global public health challenges [2]. Epidemiological data indicate that approximately 2.1 billion adults worldwide are currently overweight or obese, with projections suggesting this figure will rise to 3.3 billion by 2035 [3, 4]. A growing body of evidence demonstrates that excess body fat significantly increases the risk of non-communicable diseases (NCDs) [5], including reduced cardiac and pulmonary function [6], atherosclerosis [7], type 2 diabetes [8], and secondary hypertension [9]. These comorbidities contribute to elevated all-cause mortality and exacerbate the global disease burden.
Exercise is widely recognized as a cornerstone strategy for preventing and managing overweight and obesity [10]. Among various exercise parameters, the scientific selection of aerobic exercise intensity plays a pivotal role in determining the effectiveness of training programs [11]. The intensity corresponding to maximal fat oxidation (FATmax) has gained increasing attention as an individualized prescription for optimizing metabolic regulation. FATmax represents the exercise intensity at which the rate of fat oxidation reaches its peak during incremental workload testing—often referred to as the “golden zone” for maximizing fat utilization [12]. Typically, FATmax falls within the low-to-moderate intensity range, relying primarily on aerobic metabolism. Compared with high-intensity interval training (HIIT) or moderate-intensity continuous training (MICT), FATmax training involves lower intensity and reduced physiological strain while still achieving favorable metabolic and body composition outcomes [13, 14]. Evidence from randomized controlled trials (RCTs) suggests that FATmax training can significantly improve body composition, enhance insulin sensitivity, and optimize lipid and glucose metabolic profiles [15, 16]. Owing to its relatively low physical strain and specific metabolic target, FATmax training is considered a safe and effective intervention for individuals with low fitness levels, limited tolerance to high-intensity exercise, or cardiometabolic impairments.
Abbreviations
Despite the therapeutic potential of FATmax, existing systematic reviews have not fully addressed its impact on metabolic health. To date, only two systematic reviews—by Romain et al. (2012) [17] and Chávez-Guevara et al. (2020) [18]—have systematically evaluated FATmax training. While these reviews provided valuable evidence regarding body weight, fat mass, and cardiorespiratory fitness, they present notable limitations. First, they focused primarily on anthropometric outcomes, failing to quantitatively synthesize the effects of FATmax training on specific glucose and lipid metabolism indicators. Optimizing these metabolic markers is critical for mitigating comorbidities in populations with obesity, yet the specific impact of FATmax on parameters such as triglycerides and insulin resistance remains unclear. Second, previous reviews did not systematically investigate potential moderating factors. Understanding how participant characteristics (e.g., sex, baseline metabolic status) and intervention parameters (e.g., dietary control, session duration) modulate metabolic adaptations is essential for designing precision exercise prescriptions. Furthermore, as new trials have emerged since 2020 [19], an updated synthesis is necessary to refine current knowledge.
To address these critical knowledge gaps, this study aims to provide a comprehensive evaluation of FATmax training with two core novel contributions that distinguish it from prior reviews. First, this is the first quantitative synthesis specifically focused on glycolipid metabolic outcomes (including TG, HDL-C, LDL-C, TC, FPG, HOMAIR, and FINS) rather than solely anthropometric data. Second, this study is the first to provide clinically actionable, personalized thresholds derived from advanced interaction analyses between participant characteristics and intervention protocols. Consequently, our primary objective was to determine the chronic effects of FATmax on metabolic health, while systematically identifying specific dose-response relationships to refine precision exercise prescriptions for individuals with overweight and obesity.
MATERIALS AND METHODS
This systematic review and meta-analysis was conducted in accordance with the Preferred Reporting Items for Systematic Reviews and Meta-Analyses (PRISMA) 2020 guidelines [20]. A completed PRISMA checklist is provided in Supplementary Table 1. The study protocol was prospectively registered with the PROSPERO database (registration ID: CRD420251111698).
Information sources
A comprehensive literature search was conducted across PubMed, Web of Science (Core Collection), EBSCOhost, the International Clinical Trials Registry Platform (ICTRP), the Cochrane Library, Embase, and the China National Knowledge Infrastructure (CNKI). The initial search was completed on March 3, 2025, and updated on August 3, 2025. Eligible studies were required to be available in full text, with no restrictions on publication date, population characteristics, or language. For screening feasibility, titles and/or abstracts had to be available in either English or Chinese.
Search strategy
The search strategy was formulated based on prior systematic reviews and related studies [17, 18, 21, 22]. The following combination of search terms and Boolean operators was applied: (“FATmax” OR “LIPOXmax” OR “FATOXmax” OR “maximal fat oxidation” OR “fat metabolism”) AND (“training” OR “exercise” OR “physical activity”) AND (“obesity” OR “overweight” OR “obese”) AND (“blood glucose” OR “blood lipids” OR “lipid metabolism” OR “glucose metabolism” OR “lipid profile”) AND (“randomized controlled trial” OR “controlled clinical trial” OR “RCT”). Additionally, the PROSPERO registry and Cochrane Database of Systematic Reviews were searched to identify any published or ongoing protocols related to FATmax training. Detailed search strategies and search results for each database are provided in Supplementary Tables 2 and 3. Although multiple terms (e.g., FATmax, LIPOXmax, and FATOXmax) were used in the search strategy to ensure comprehensive retrieval, FATmax was adopted as the primary term throughout the present study, as these terms refer to the same physiological concept of maximal fat oxidation.
Selection process
All retrieved records were initially deduplicated manually by an independent reviewer (LYY) using EndNote X9 (Clarivate Analytics, Philadelphia, PA, USA). The deduplicated records were then screened independently by two reviewers (GJW and LZY) according to predefined inclusion and exclusion criteria. Screening was conducted in two stages: (1) title and abstract screening and (2) full-text assessment of potentially eligible articles. Discrepancies were resolved through discussion, and unresolved disagreements were adjudicated by a third reviewer (BZH). Interrater reliability was evaluated using Cohen’s K, which yielded a coefficient of 0.85, indicating almost perfect agreement [23]. In addition to electronic searches, potentially relevant studies were identified by manually screening the reference lists of prior systematic reviews and by consulting domain experts within the research team.
Eligibility criteria
Study eligibility was determined according to predefined inclusion and exclusion criteria structured around the PICOS framework (Population, Intervention, Comparison, Outcomes, and Study design). The review included human participants of any age or sex, regardless of their physical activity level. Studies involving animal models were excluded during the title and abstract screening stage.
Eligible studies were required to implement supervised FATmax training interventions without restrictions on training mode, frequency, or duration, provided the protocol lasted at least one week. FATmax was defined as the individualized exercise intensity eliciting the maximal fat oxidation rate. This intensity had to be determined via indirect calorimetry during a graded incremental exercise test with expiratory gas analysis [12, 24]. At each workload stage, fat oxidation rates were calculated, and the intensity yielding the peak oxidation rate was identified as FATmax [25]. To ensure protocol validity, studies utilizing mathematical models to estimate FATmax without direct gas exchange analysis were excluded. Control groups were required to maintain their habitual physical activity levels without engaging in structured exercise programs while adhering to experimental conditions comparable to the intervention group.
Studies were required to report resting and fasting-state data for at least one glycemic or lipid metabolic outcome. Glycemic indicators included fasting plasma glucose (FPG), fasting insulin (FINS), and the homeostatic model assessment of insulin resistance (HOMAIR), while lipid indicators included triglycerides (TG), high-density lipoprotein cholesterol (HDL-C), low-density lipoprotein cholesterol (LDL-C), and total cholesterol (TC). All outcomes had to be measured using standardized laboratory methods. Studies providing sufficient data to calculate effect sizes (e.g., pre- and post-intervention means and standard deviations, or change scores) were considered eligible. Conversely, research focusing exclusively on acute physiological responses (e.g., immediate post-exercise changes) or molecular mechanisms was excluded.
Only original controlled trials employing between-group comparisons (parallel or crossover), whether randomized or non-randomized, were included. Acute exercise trials, review articles, editorials, commentaries, validation studies, book chapters, and case reports were excluded.
Data extraction
Two reviewers (GJW and LZY) independently extracted data using a pre-specified worksheet developed in Microsoft Excel (Microsoft 365; Microsoft, Redmond, WA, USA). Extracted information included the first author’s name, publication year, study design, participant characteristics, training protocol details, dropout rate, and pre- and post-intervention means and standard deviations for all relevant outcome variables. Group sample sizes were also recorded. When essential data were incomplete or presented graphically, the corresponding authors were contacted for clarification. If no response was obtained, numerical data were extracted from figures using WebPlotDigitizer (version 5.2; https://automeris.io/) [26]. Studies were excluded if critical outcome data could not be retrieved or accurately estimated.
Risk of bias assessment
The risk of bias for randomized controlled trials was evaluated using the Cochrane Risk of Bias 2.0 (RoB 2.0) tool [27], which assesses five domains: (1) bias arising from the randomization process, (2) deviations from intended interventions, (3) missing outcome data, (4) outcome measurement, and (5) selection of the reported result. Disagreements between reviewers were resolved through discussion, and any unresolved issues were adjudicated by a third reviewer (BZH). For non-randomized studies, the Risk of Bias in Non-randomized Studies of Interventions (ROBINS-I) tool [27] was employed to assess seven domains: confounding, participant selection, intervention classification, deviations from intended interventions, missing data, outcome measurement, and selection of the reported result. Additionally, methodological quality was evaluated using the Physiotherapy Evidence Database (PEDro) scale (0–10 points) [28]. Scores of ≥ 6 were considered high quality, 4–5 moderate quality, and ≤ 3 low quality.
Statistical analysis
Data synthesis and effect measures
Between-group comparisons of the FATmax and control interventions were conducted using change scores (mean difference and standard deviation) derived from pre- and post-intervention data, calculated according to established equations [29–31]. The mean difference (Mdiff) was first computed as:
where Mdiff represents the raw mean difference, Mpost is the postintervention mean, and Mpre is the pre-intervention mean [32].
The standard deviation of the change in means SDdiff was then estimated using the formula:
where SDdiff denotes the standard deviation of the change scores, SDpre and SDpost refer to the pre- and post-intervention standard deviations, and r represents the pre-post correlation coefficient [32]. Since most included trials did not report this coefficient, a conservative value of r = 0.50 was adopted. This approach aligns with the Cochrane Handbook guidelines [32], established statistical recommendations [33], and comparable meta-analyses in the field of exercise physiology [17, 18, 34]. To ensure the stability of our findings, the robustness of the pooled estimates was further validated through sensitivity analyses using alternative coefficients (r = 0.25 and 0.75), as detailed in Section 3.6.
Given that several included studies involved relatively small sample sizes, Hedges’ g was used as the effect size estimator, calculated as follows [35]:
Here, FATmax (Mdiff) and CON (Mdiff) denote the mean change in the FATmax and control groups, respectively; n1 and n2 indicate the sample sizes of the two groups; and SDpooled is the pooled standard deviation, computed as:
where SD1 and SD2 are the standard deviations of the FATmax and control groups, respectively. According to conventional interpretation thresholds, Hedges’ g values were classified as follows: trivial (< 0.2), small (0.2–0.5), medium (> 0.5–0.8), and large (> 0.8) [36].
Subgroup and meta-regression analysis
Between-study heterogeneity was quantified using the I2 statistic and interpreted according to the Cochrane Handbook thresholds, where 0–40% may not be important, 30–60% represents moderate heterogeneity, 50–90% indicates substantial heterogeneity, and 75–100% suggests considerable heterogeneity [32]. In line with general methodological recommendations, when substantial heterogeneity was detected (I2 > 50%), subgroup and meta-regression analyses were conducted under a random-effects framework to explore potential sources of variation [37, 38]. To reduce the likelihood of false-negative findings due to limited power, the statistical power for each subgroup was also calculated [39].
Based on prior evidence, the following categorical variables were examined in the subgroup analyses: (a) participant sex, (b) inclusion of a warm-up session, (c) inclusion of dietary control, (d) presence of co-morbid chronic diseases, (e) training modality, and (f) randomization status.
To further elucidate the dose – response relationship between FATmax training and glycolipid metabolism, mixed-effects meta-regression analyses were conducted using restricted maximum likelihood (REML) estimation [40]. Moderators were selected a priori based on physiological plausibility, specifically focusing on exerciseinduced metabolic adaptations (e.g., time-dependent lipid oxidation kinetics) and the law of initial values. Accordingly, the models incorporated participant characteristics (age, baseline BMI, baseline HDLC, baseline FPG, and baseline
Both linear and cubic functions were fitted and compared to characterize the dose – response pattern. The model with the lowest bias-corrected Akaike Information Criterion (AIC) value was selected as the best-fitting model [41]. All analyses were conducted using the metafor package (version 3.0; Wolfgang Viechtbauer, Maastricht University), and visualizations were produced using ggplot2 (version 3.3.6; Hadley Wickham, RStudio, USA) [42].
Risk of publication bias and sensitivity analysis
Publication bias was assessed visually using contour-enhanced funnel plots [43] and quantitatively via Egger’s linear regression test [44, 45]. In accordance with established guidelines, potential asymmetry was interpreted with caution, acknowledging that it may arise from between-study heterogeneity or chance (small-study effects) rather than solely from publication bias [46]. A p-value > 0.05 in Egger’s test, combined with a symmetrical funnel plot, was interpreted as indicating no significant risk of publication bias.
To verify the robustness of our findings, we employed a three-tiered sensitivity analysis. First, we evaluated the impact of methodological assumptions regarding data imputation. We recalculated the pooled effects using alternative correlation coefficients (r = 0.25 and 0.75) to determine if the results were sensitive to the assumed value (r = 0.50). Additionally, we compared the results derived from the SD of change scores against those using baseline SDs. Second, a leave-oneout analysis was conducted by sequentially excluding individual studies to detect whether any single trial disproportionately skewed the aggregate effect size. Third, we screened for influential outliers within the multilevel meta-analytic framework. Cook’s distance [47] and studentized residuals [48] were utilized to diagnose leverage and influential cases at both the within-study (Level 2) and between-study (Level 3) levels. Data points were flagged as outliers if their hat values or Cook’s distances exceeded three times the mean, or if absolute studentized residuals were greater than 3. The meta-analysis models were subsequently re-estimated after excluding these flagged cases to confirm the stability of the primary outcomes.
Certainty of the evidence
The GRADE (Grading of Recommendations Assessment, Development and Evaluation) approach was applied to integrate the risk of bias into the interpretation of results and to rate the certainty of evidence as high, moderate, low, or very low. In brief, high certainty indicates that further research is very unlikely to change confidence in the estimated effect; moderate certainty suggests that additional research may have an important impact on confidence in the estimate and could alter it; low certainty denotes that further research is likely to have an important impact and may change the estimate; and very low certainty implies that the true effect is highly uncertain [49]. All GRADE assessments were independently performed by one reviewer (GJW) and verified by a second reviewer (WS).
RESULTS
Studies retrieved
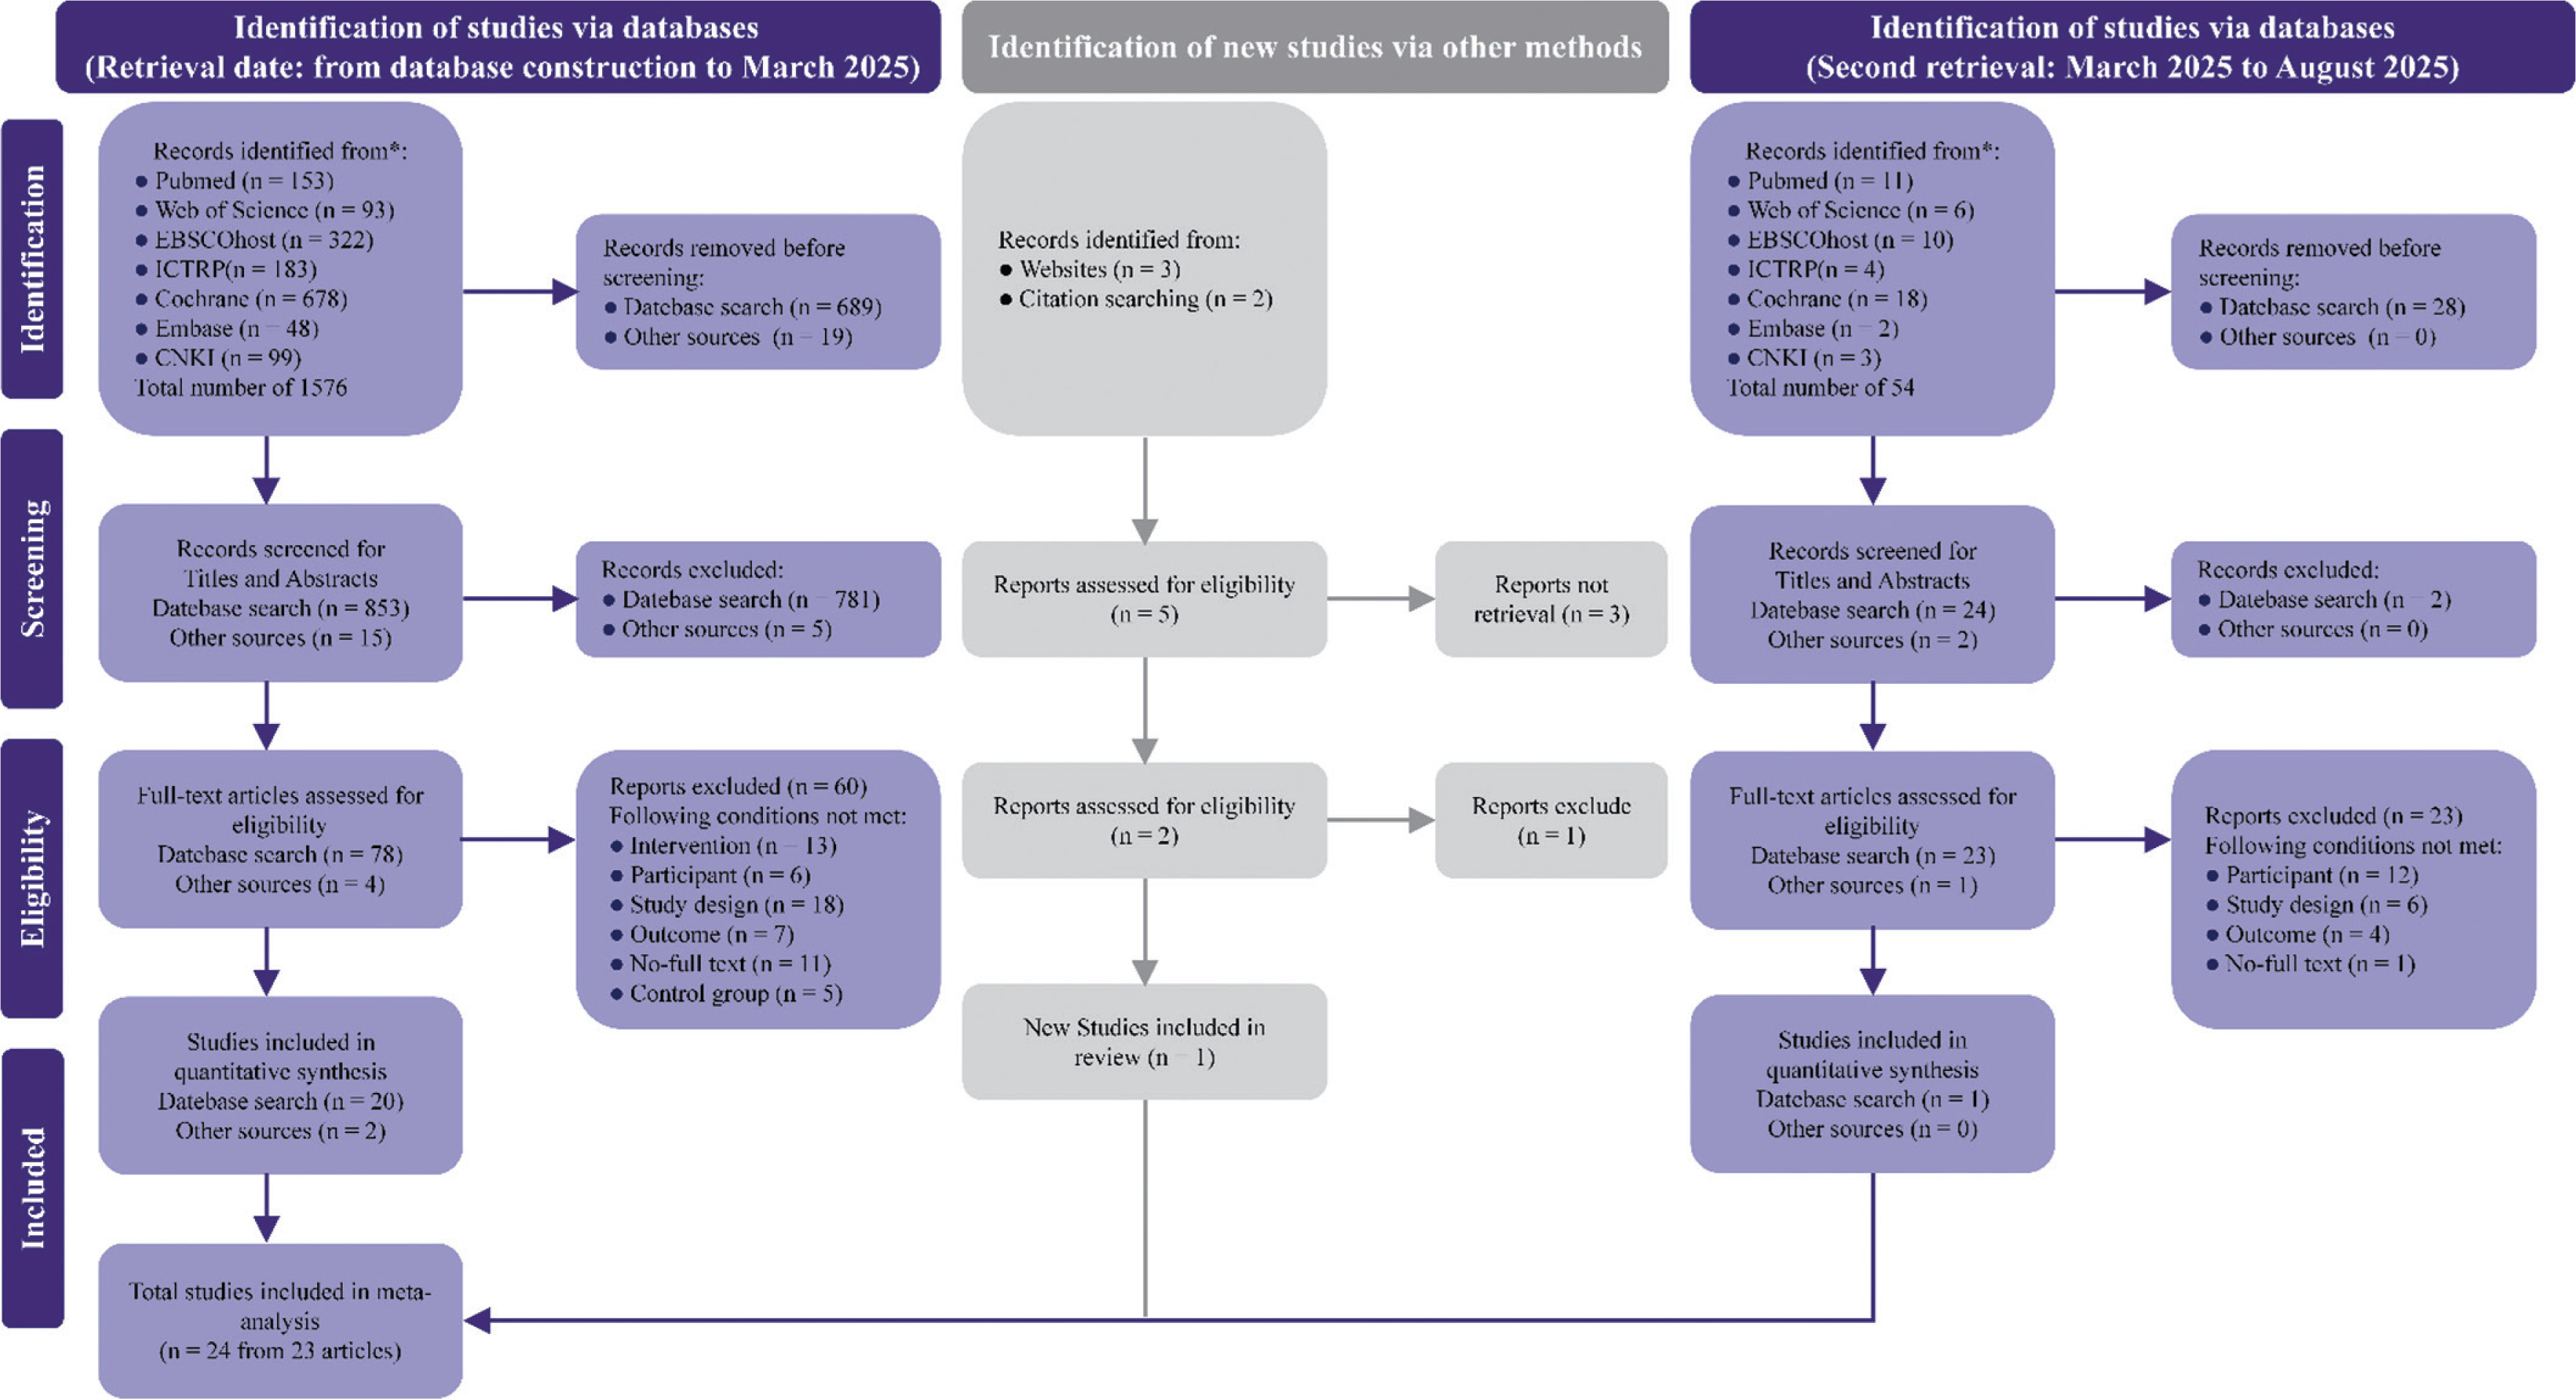
The search identified 1,635 records: 1,576 from the primary database search, 54 from an update conducted six months later, and 1 from other sources. After screening, 24 studies were included in the meta-analysis [15, 16, 19, 50–69] (Fig. 1).
Characteristics of included studies
Of the 24 included studies, 16 were randomized controlled trials (R CTs) [15, 19, 50–57, 59, 62–64, 67, 69], and 8 were non-randomized controlled trials [16, 58, 60, 61, 65, 66, 68]. The pooled sample comprised 638 participants (193 males, 323 females, and 122 with unreported sex). Sample sizes across studies ranged from 8 to 68 participants, with participant ages ranging from 13 to 64 years. Detailed characteristics of participants and intervention protocols are summarized in Supplementary Table 4.
Primary analysis
Compared with conventional interventions, FATmax training was associated with significant improvements in lipid metabolism among individuals with overweight or obesity. Specifically, FATmax training significantly reduced triglyceride (TG) levels (k = 17, g = -0.55, 95% CI: -0.83 to -0.27, I2 = 48% [moderate], PI: -1.40 to 0.30, p < 0.01; moderate certainty) and total cholesterol (TC) (k = 16, g = -0.23, 95% CI: -0.42 to -0.03, I2 = 3% [low], PI: -0.47 to 0.02, p = 0.02; low certainty), while significantly increasing highdensity lipoprotein cholesterol (HDL-C) (k = 16, g = 0.51, 95% CI: 0.02 to 0.99, I2 = 82% [substantial], PI: -1.28 to 2.29, p = 0.03; low certainty). In contrast, no significant change was observed in low-density lipoprotein cholesterol (LDL-C) (k = 14, g = -0.18, 95% CI: -0.50 to 0.14, I2 = 49% [moderate], PI: -1.12 to 0.76, p = 0.28; moderate certainty) (Fig. 2).
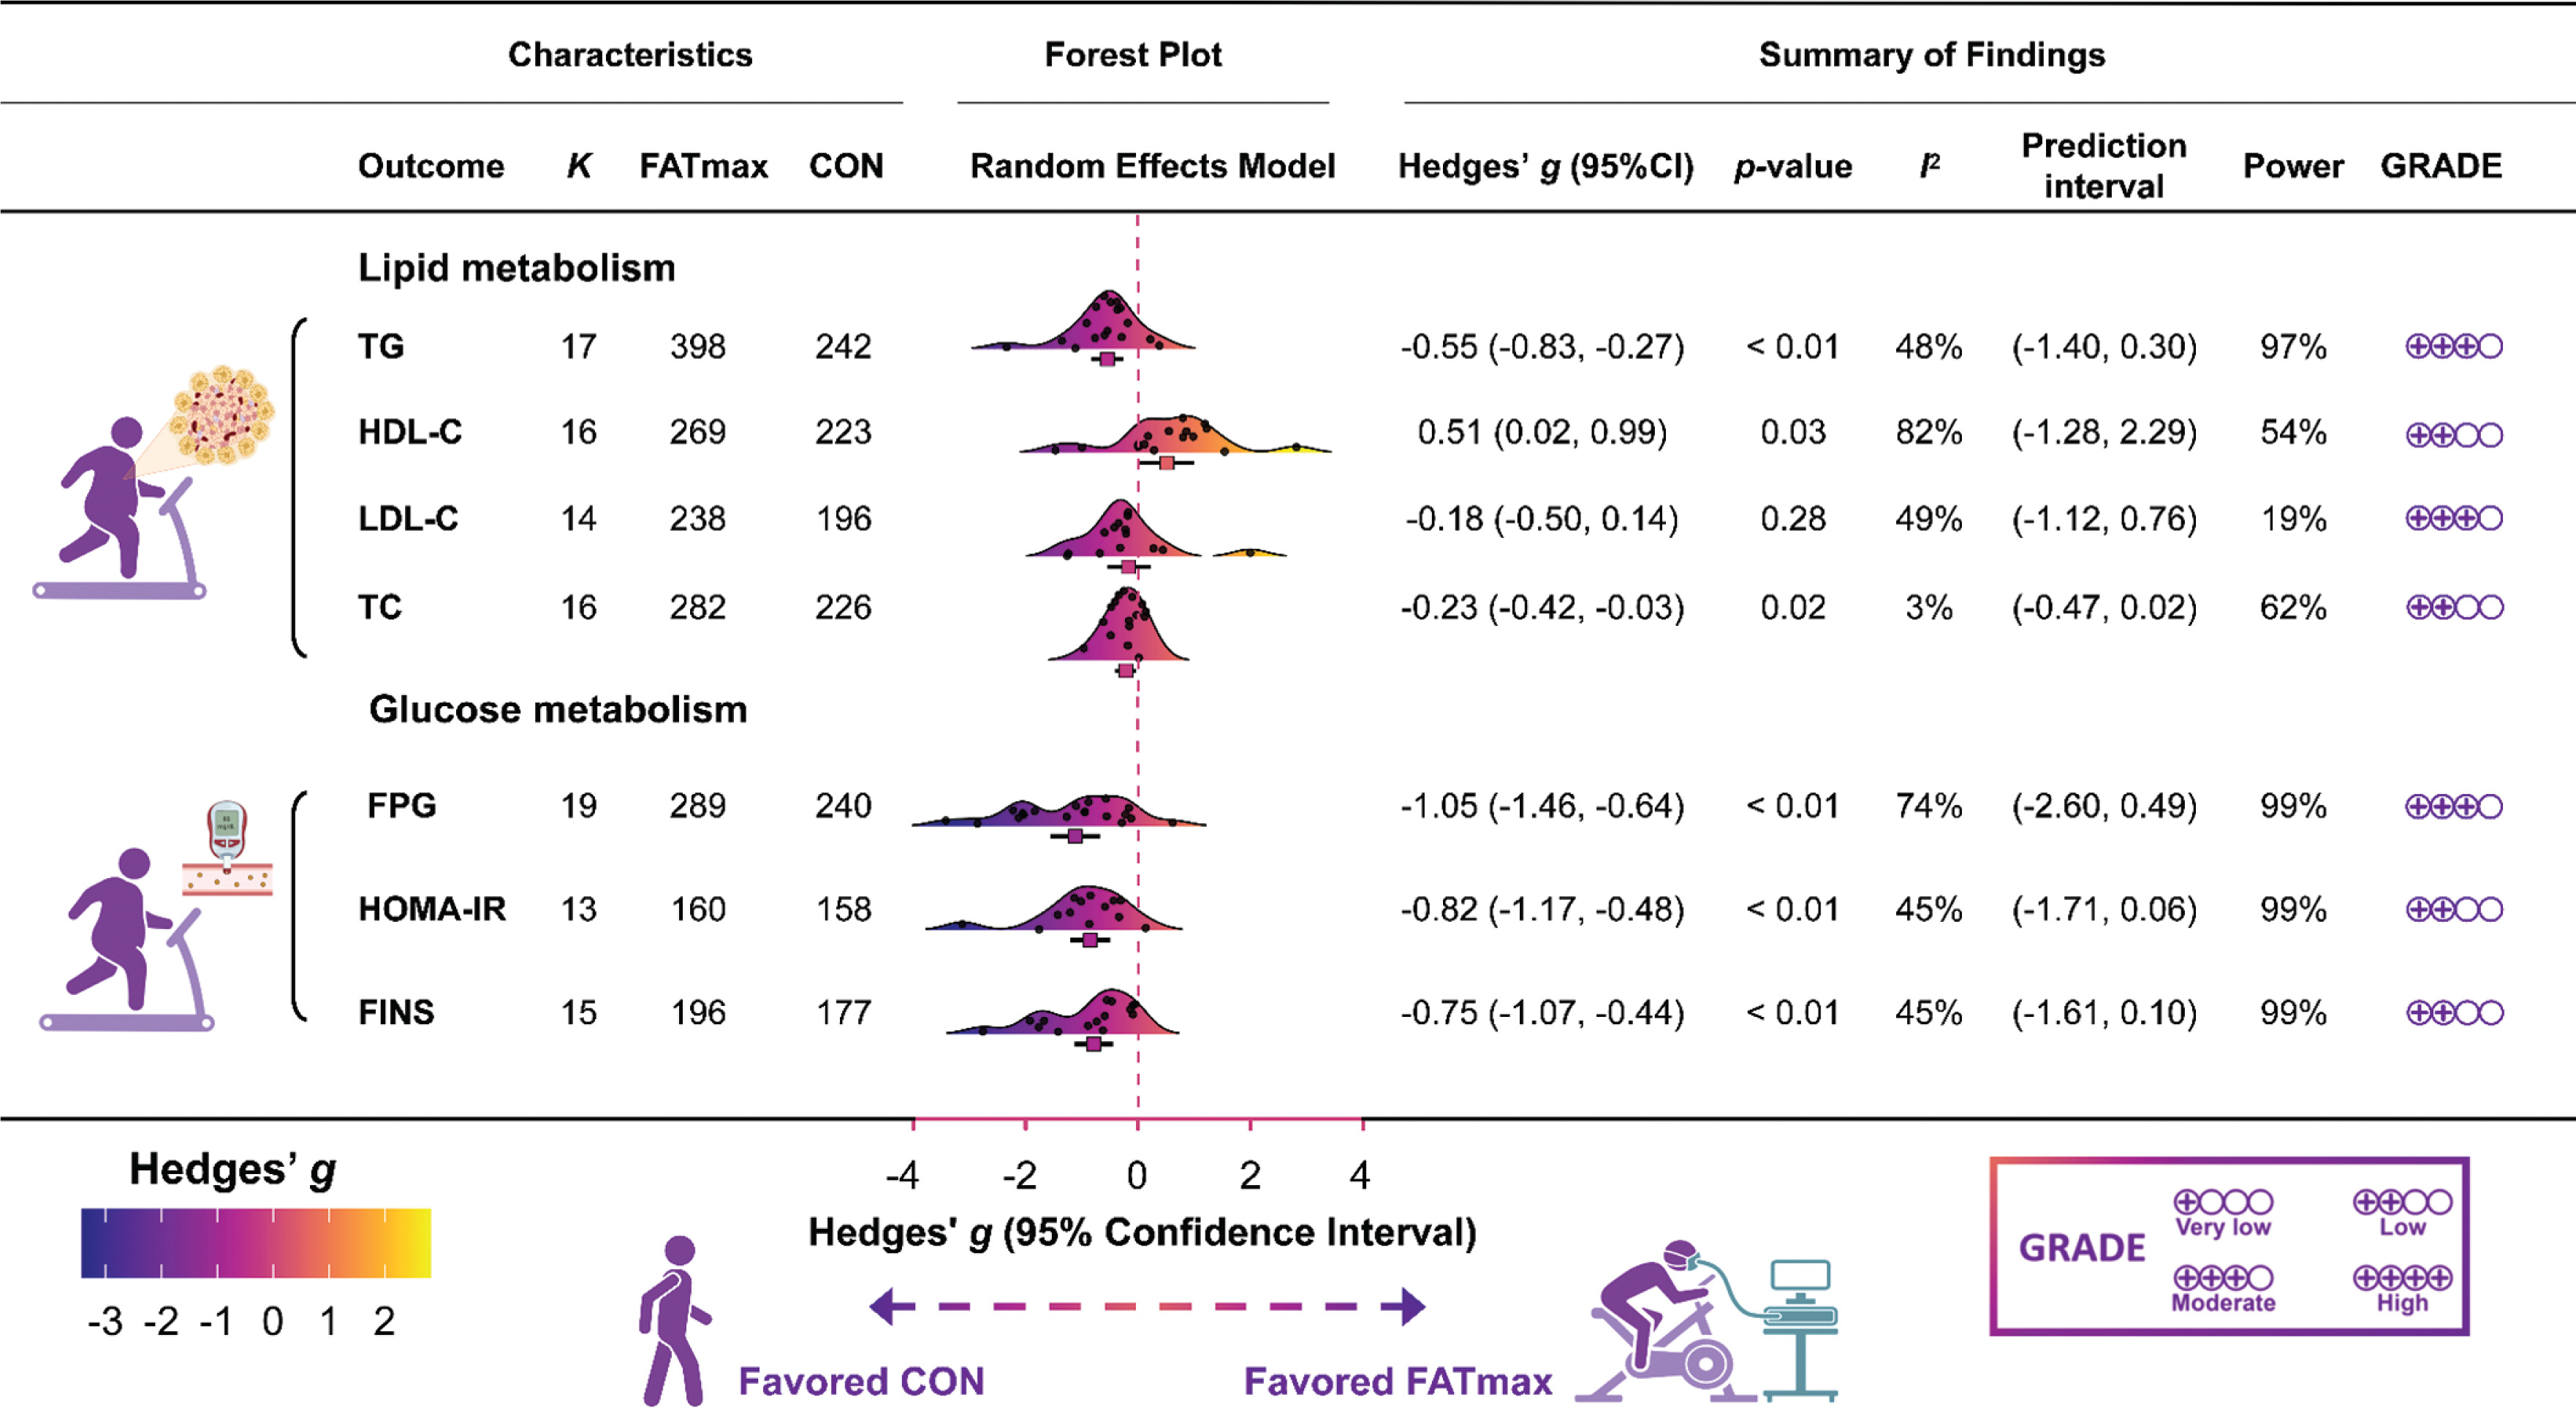
FATmax training also elicited significant improvements in glucose homeostasis relative to conventional interventions. Notably, fasting plasma glucose (FPG) decreased significantly (k = 19, g = -1.05, 95% CI: -1.46 to -0.64, I2 = 74% [substantial], PI: -2.60 to 0.49, p < 0.01; moderate certainty), as did the homeostatic model assessment for insulin resistance (HOMA-IR) (k = 13, g = -0.82, 95% CI: -1.17 to -0.48, I2 = 45% [moderate], PI: -1.71 to 0.06, p < 0.01; low certainty) and fasting insulin (FINS) (k = 15, g = -0.75, 95% CI: -1.07 to -0.44, I2 = 45% [moderate], PI: -1.61 to 0.10, p < 0.01; low certainty) (Fig. 2).
Detailed forest plots for each outcome are presented in Supplementary Fig. 2–5, and the statistical power of the pooled results is summarized in Supplementary Fig. 6.
Moderator analysis
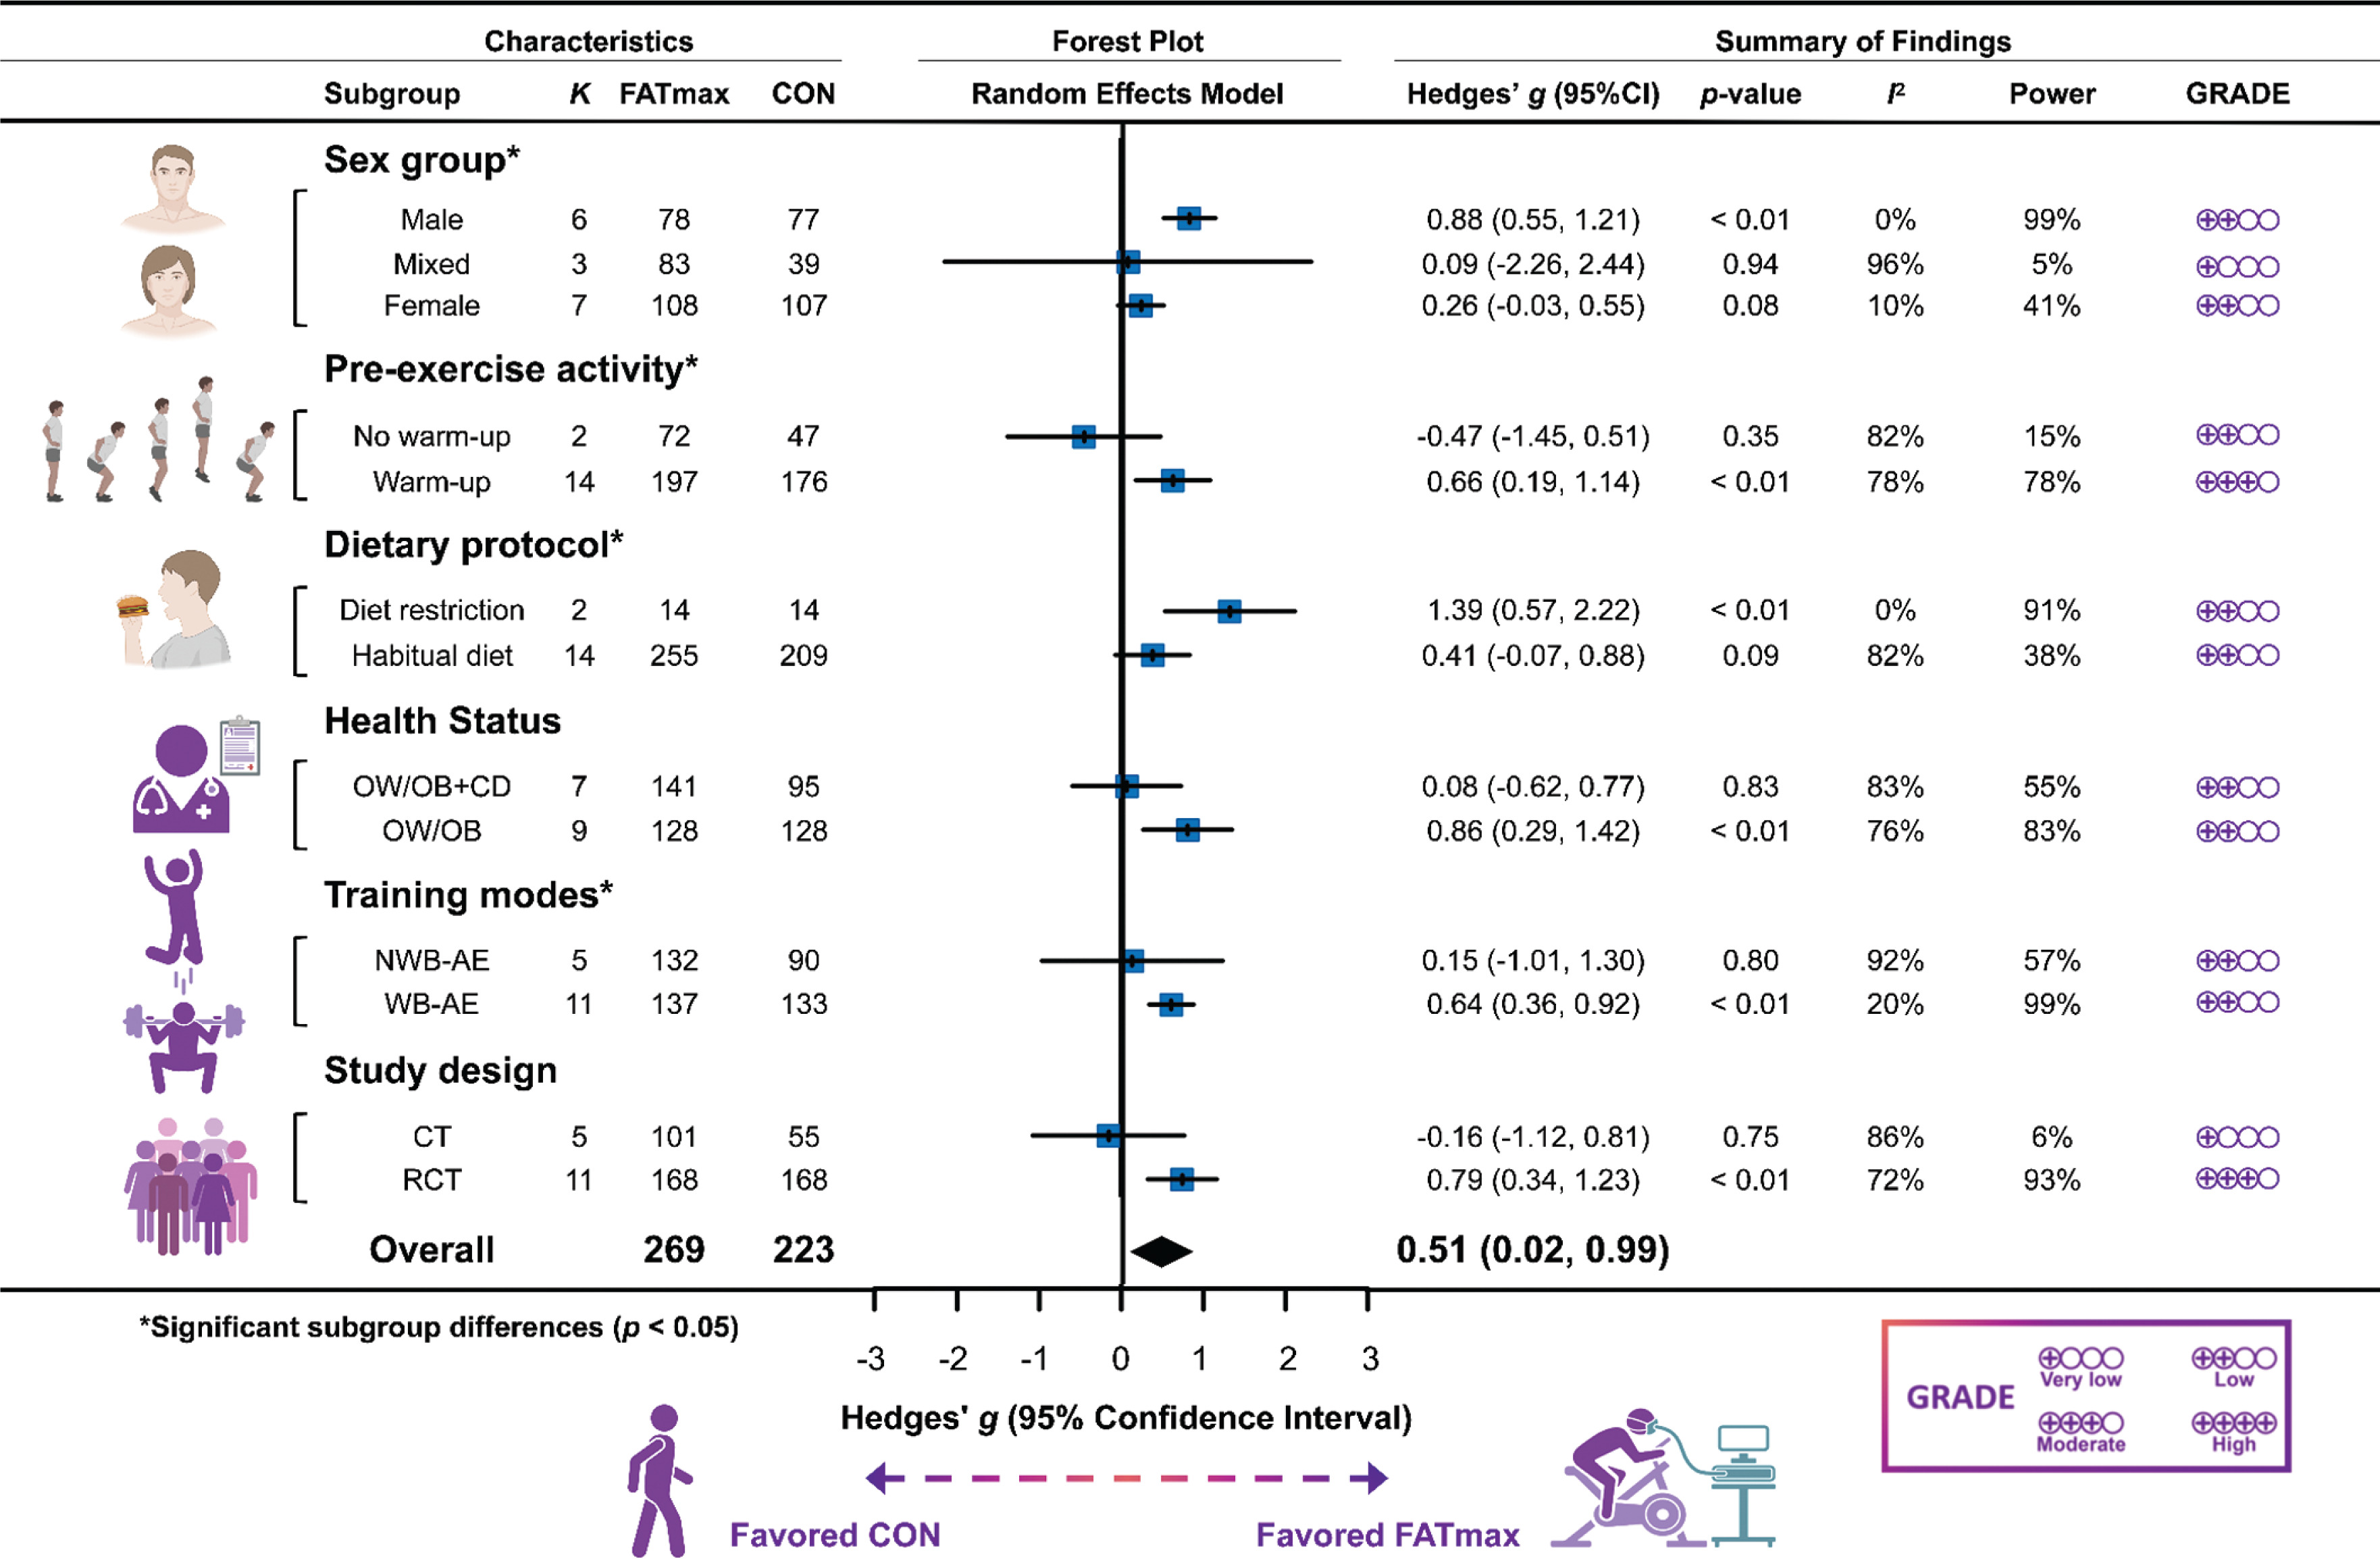
Owing to the substantial heterogeneity observed in HDL-C and FPG outcomes, moderator analyses were performed to explore the influence of participant characteristics, pre-exercise activity, dietary control, and training modality on HDL-C (Fig. 3) and FPG (Supplementary Fig. 7).
Potential moderators of HDL-C
Subgroup analyses revealed that sex, pre-exercise activity status, dietary protocol, and training modality significantly moderated the effects of FATmax training on HDL-C levels in individuals with overweight or obesity (p < 0.05, Fig. 3). Specifically, FATmax training elicited greater increases in HDL-C among men (g = 0.88), in studies incorporating a warm-up session (g = 0.66), when combined with dietary restriction (g = 1.39), and in weight-bearing aerobic exercise (WB-AE, e.g., running) (g = 0.64) compared to non-weight-bearing aerobic exercise (NWB-AE, e.g., cycling) (g = 0.15). However, given the limited number of studies (k) and participants (n) included in the “Male” and “Dietary restriction” subgroups, these specific findings should be regarded as exploratory. The substantial effect sizes observed in these subsets must be interpreted with caution and warrant validation through larger-scale trials to ensure statistical robustness. Regarding other potential moderators, no statistically significant subgroup differences were observed with respect to participants’ health status or study design. Nevertheless, FATmax training produced significantly greater improvements in HDL-C compared with controls under specific conditions. Notably, within the subgroup of simple overweight or obesity (OW/OB), FATmax training conferred a clear advantage (g = 0.86), whereas the effect in individuals with overweight or obesity combined with chronic diseases (OW/OB+CD) was not statistically significant (g = 0.08). Similar benefits were observed in randomized controlled trials (RCT) (g = 0.79).
Meta-regression analyses identified baseline HDL-C concentration, %
FIG. 4
Meta-regression analysis of HDL-C changes in relation to baseline HDL-C levels. The horizontal axis represents baseline HDL-C (0.95–1.36 mmol/L), and the vertical axis represents the change in HDL-C before and after the intervention, with each bubble corresponding to one study. The left panel displays the simple linear regression model, whereas the right panel illustrates the cubic regression model. The value of 1.36 mmol/L indicates the upper significant threshold for the model prediction. When baseline HDL-C ≤ 1.36 mmol/L, post-intervention increases in HDL-C are more likely to reach statistical significance. Comparison of Akaike information criterion (AIC) values indicated that the linear regression model (left panel) provided a relatively better fit.
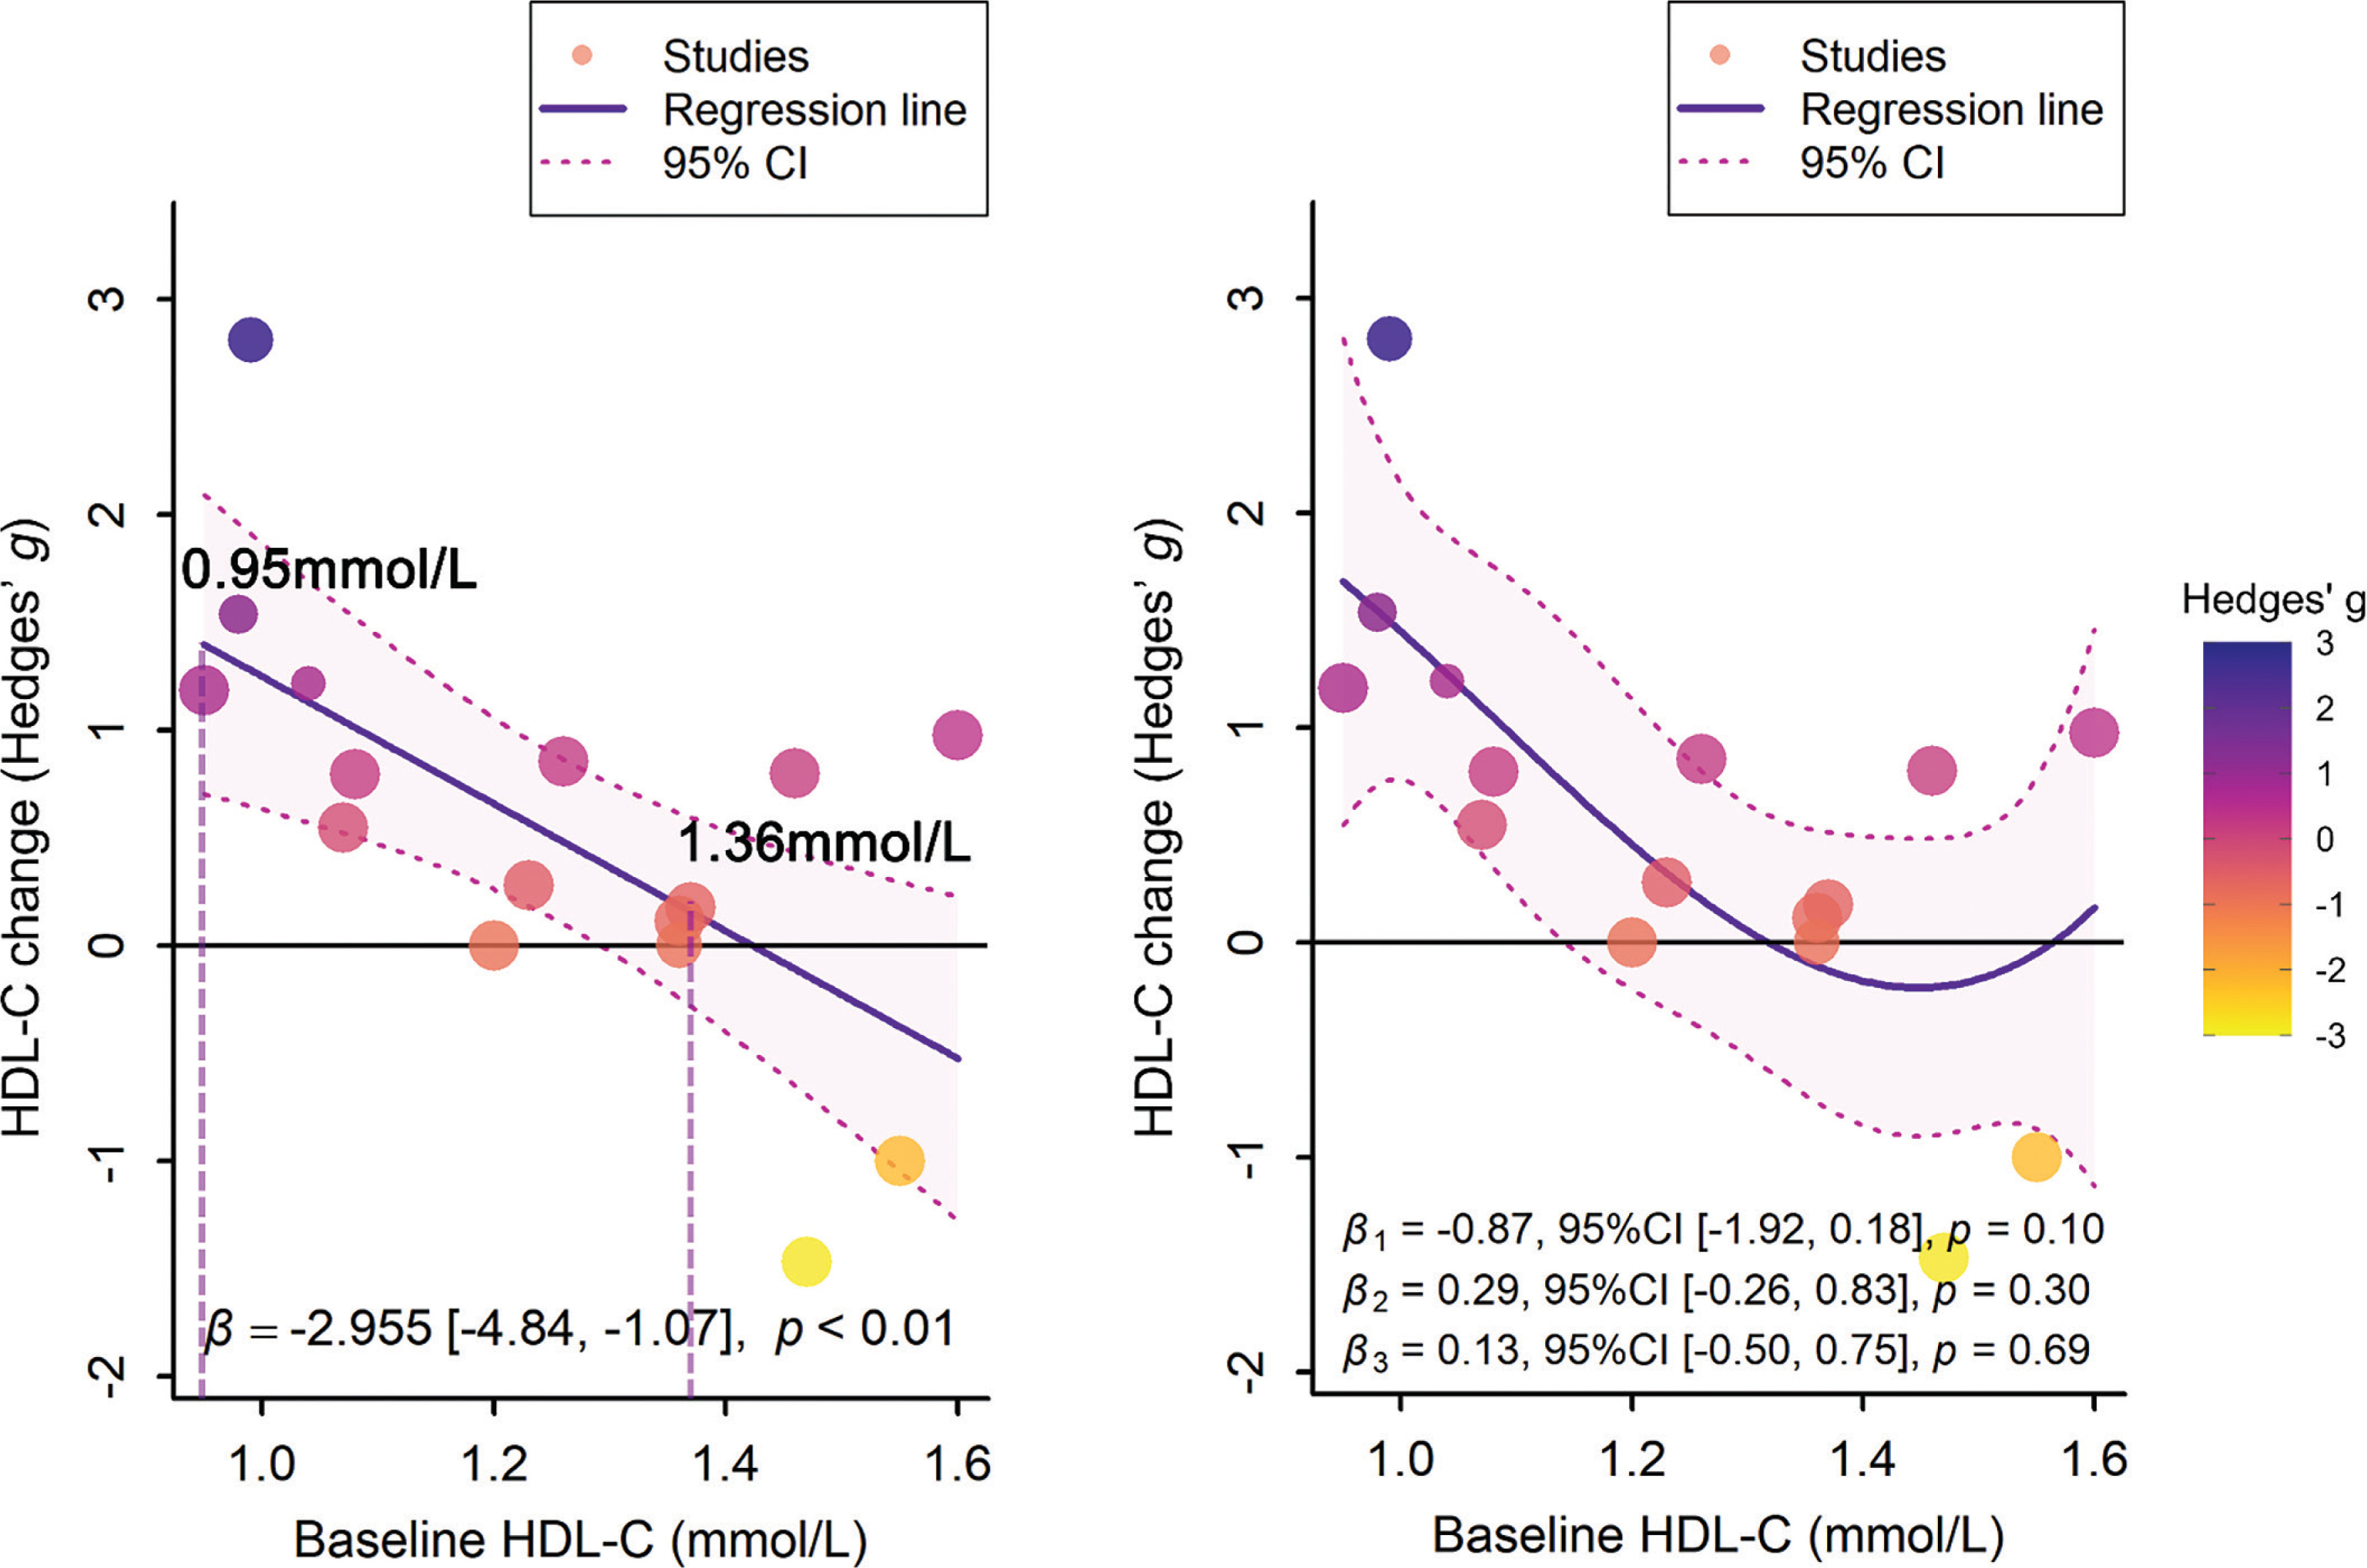
FIG. 5
Meta-regression analysis of HDL-C changes in relation to %
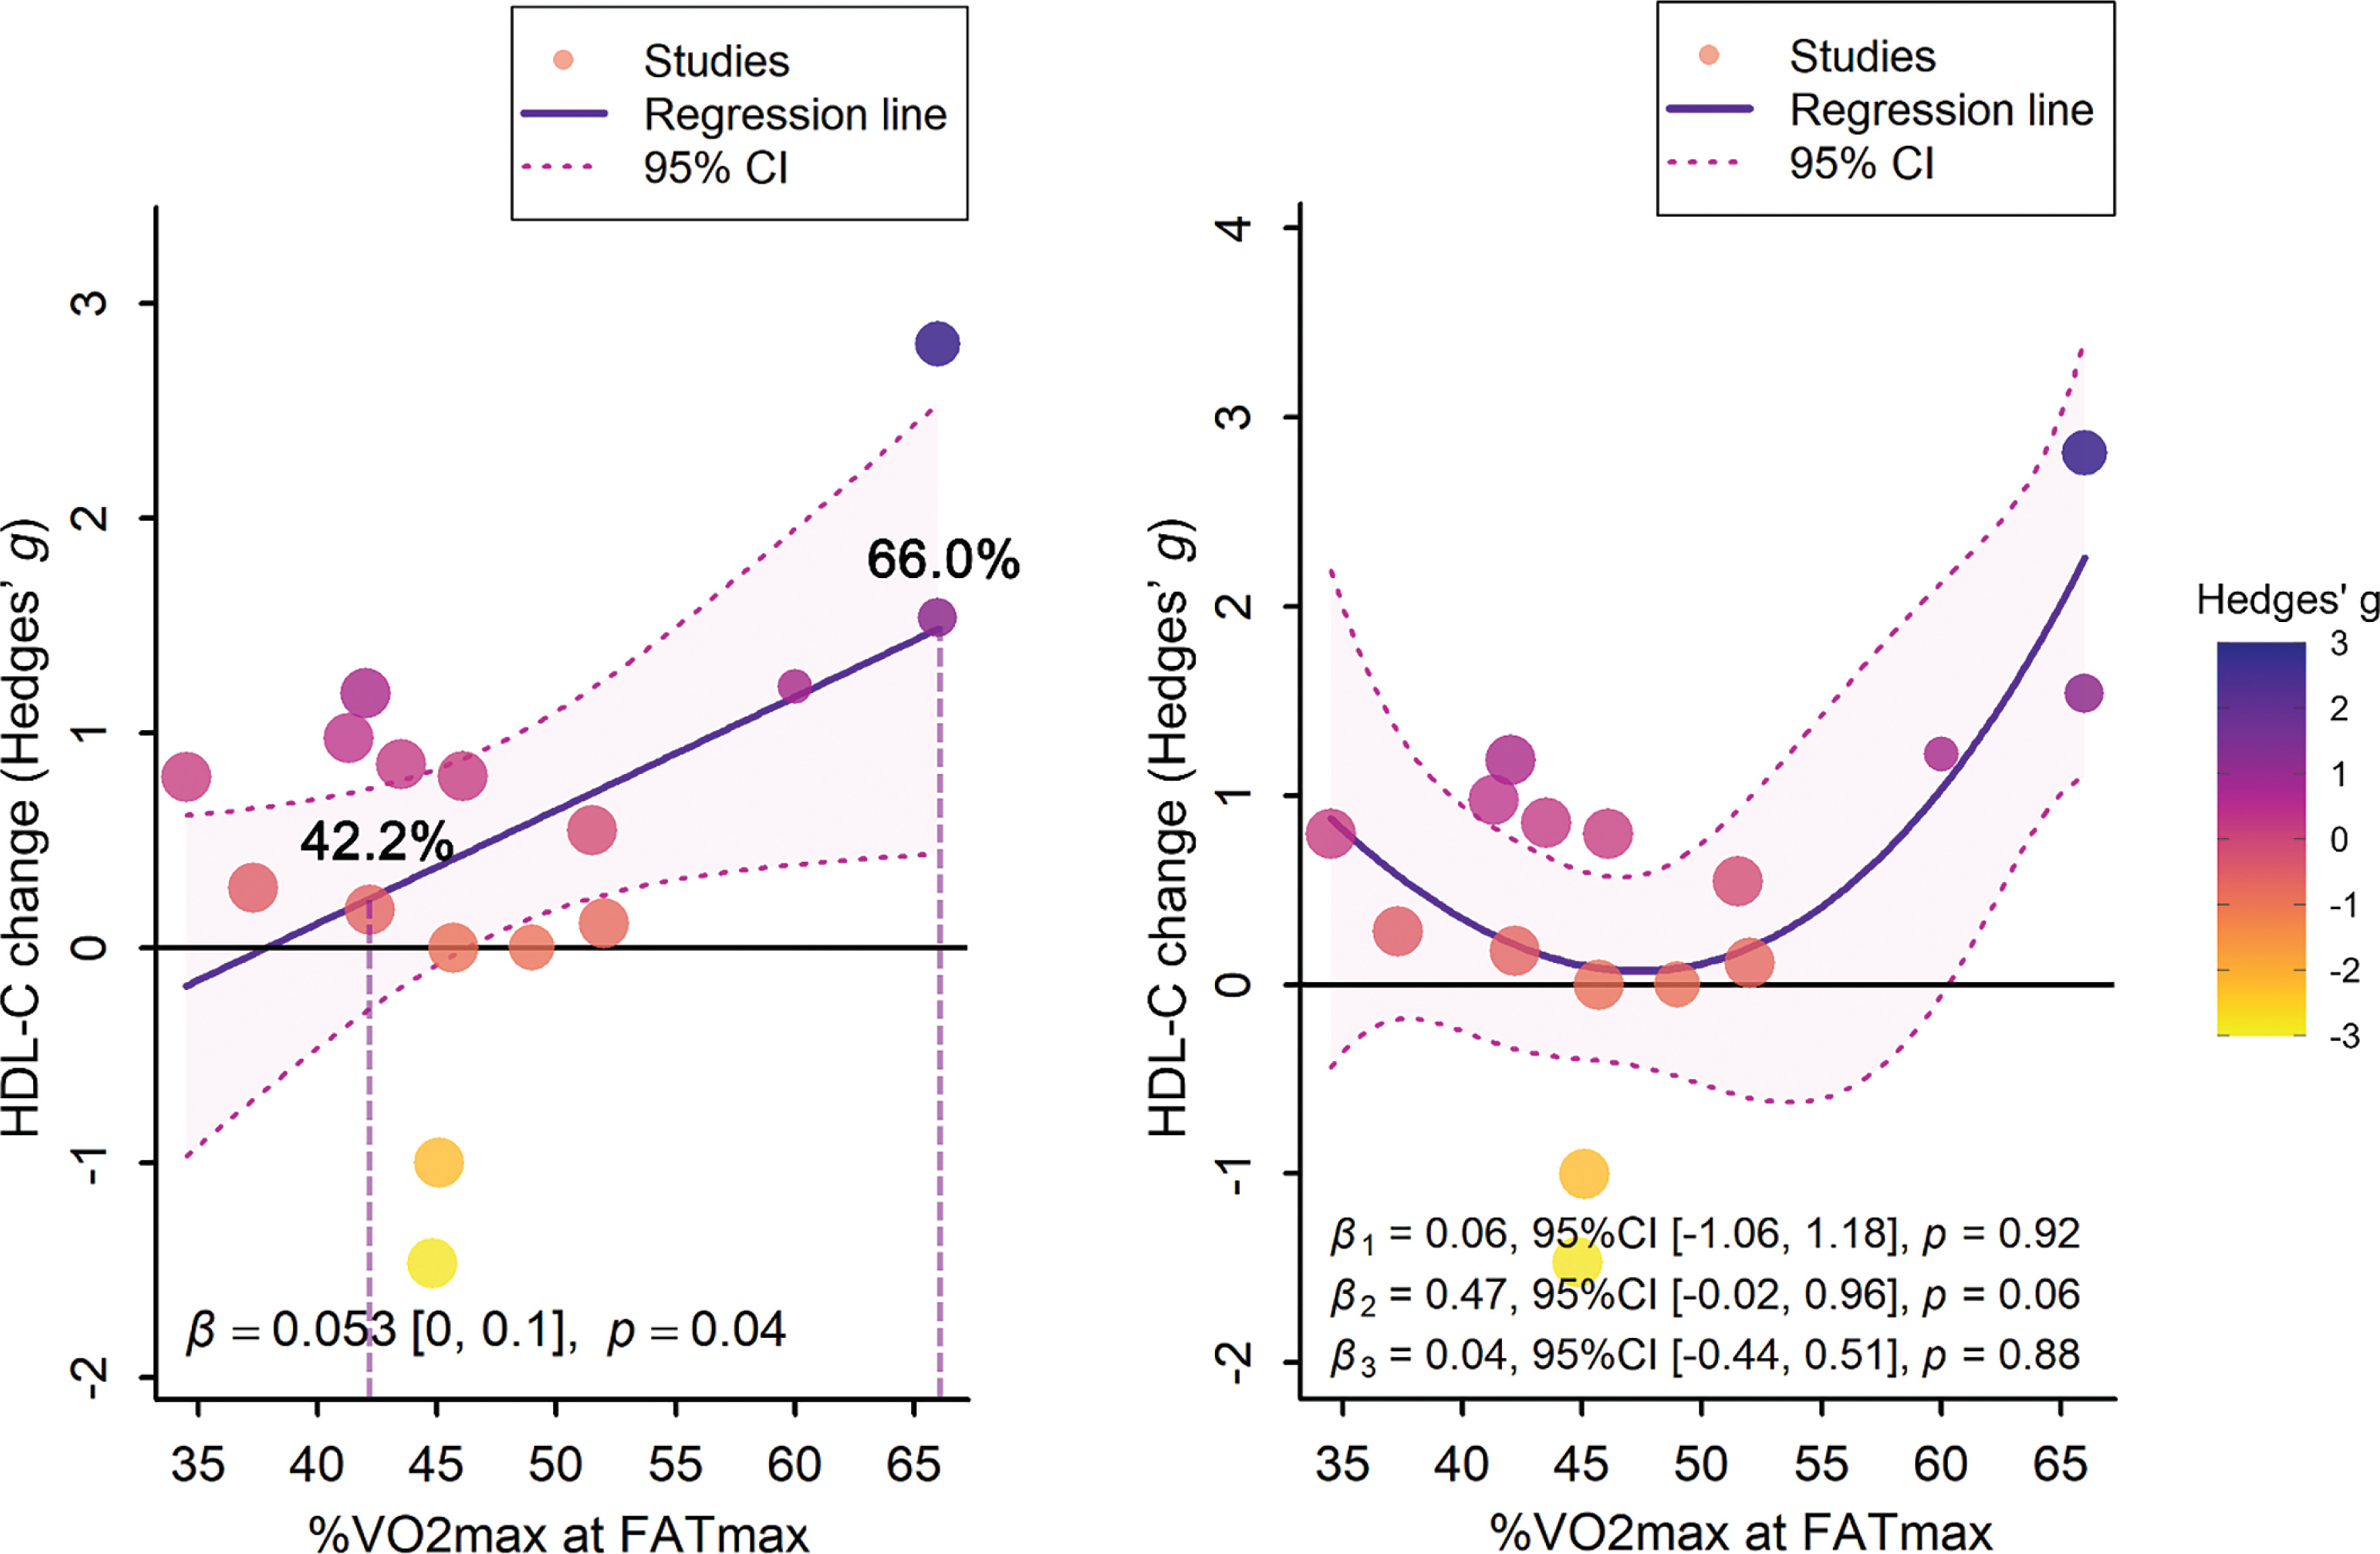
FIG. 6
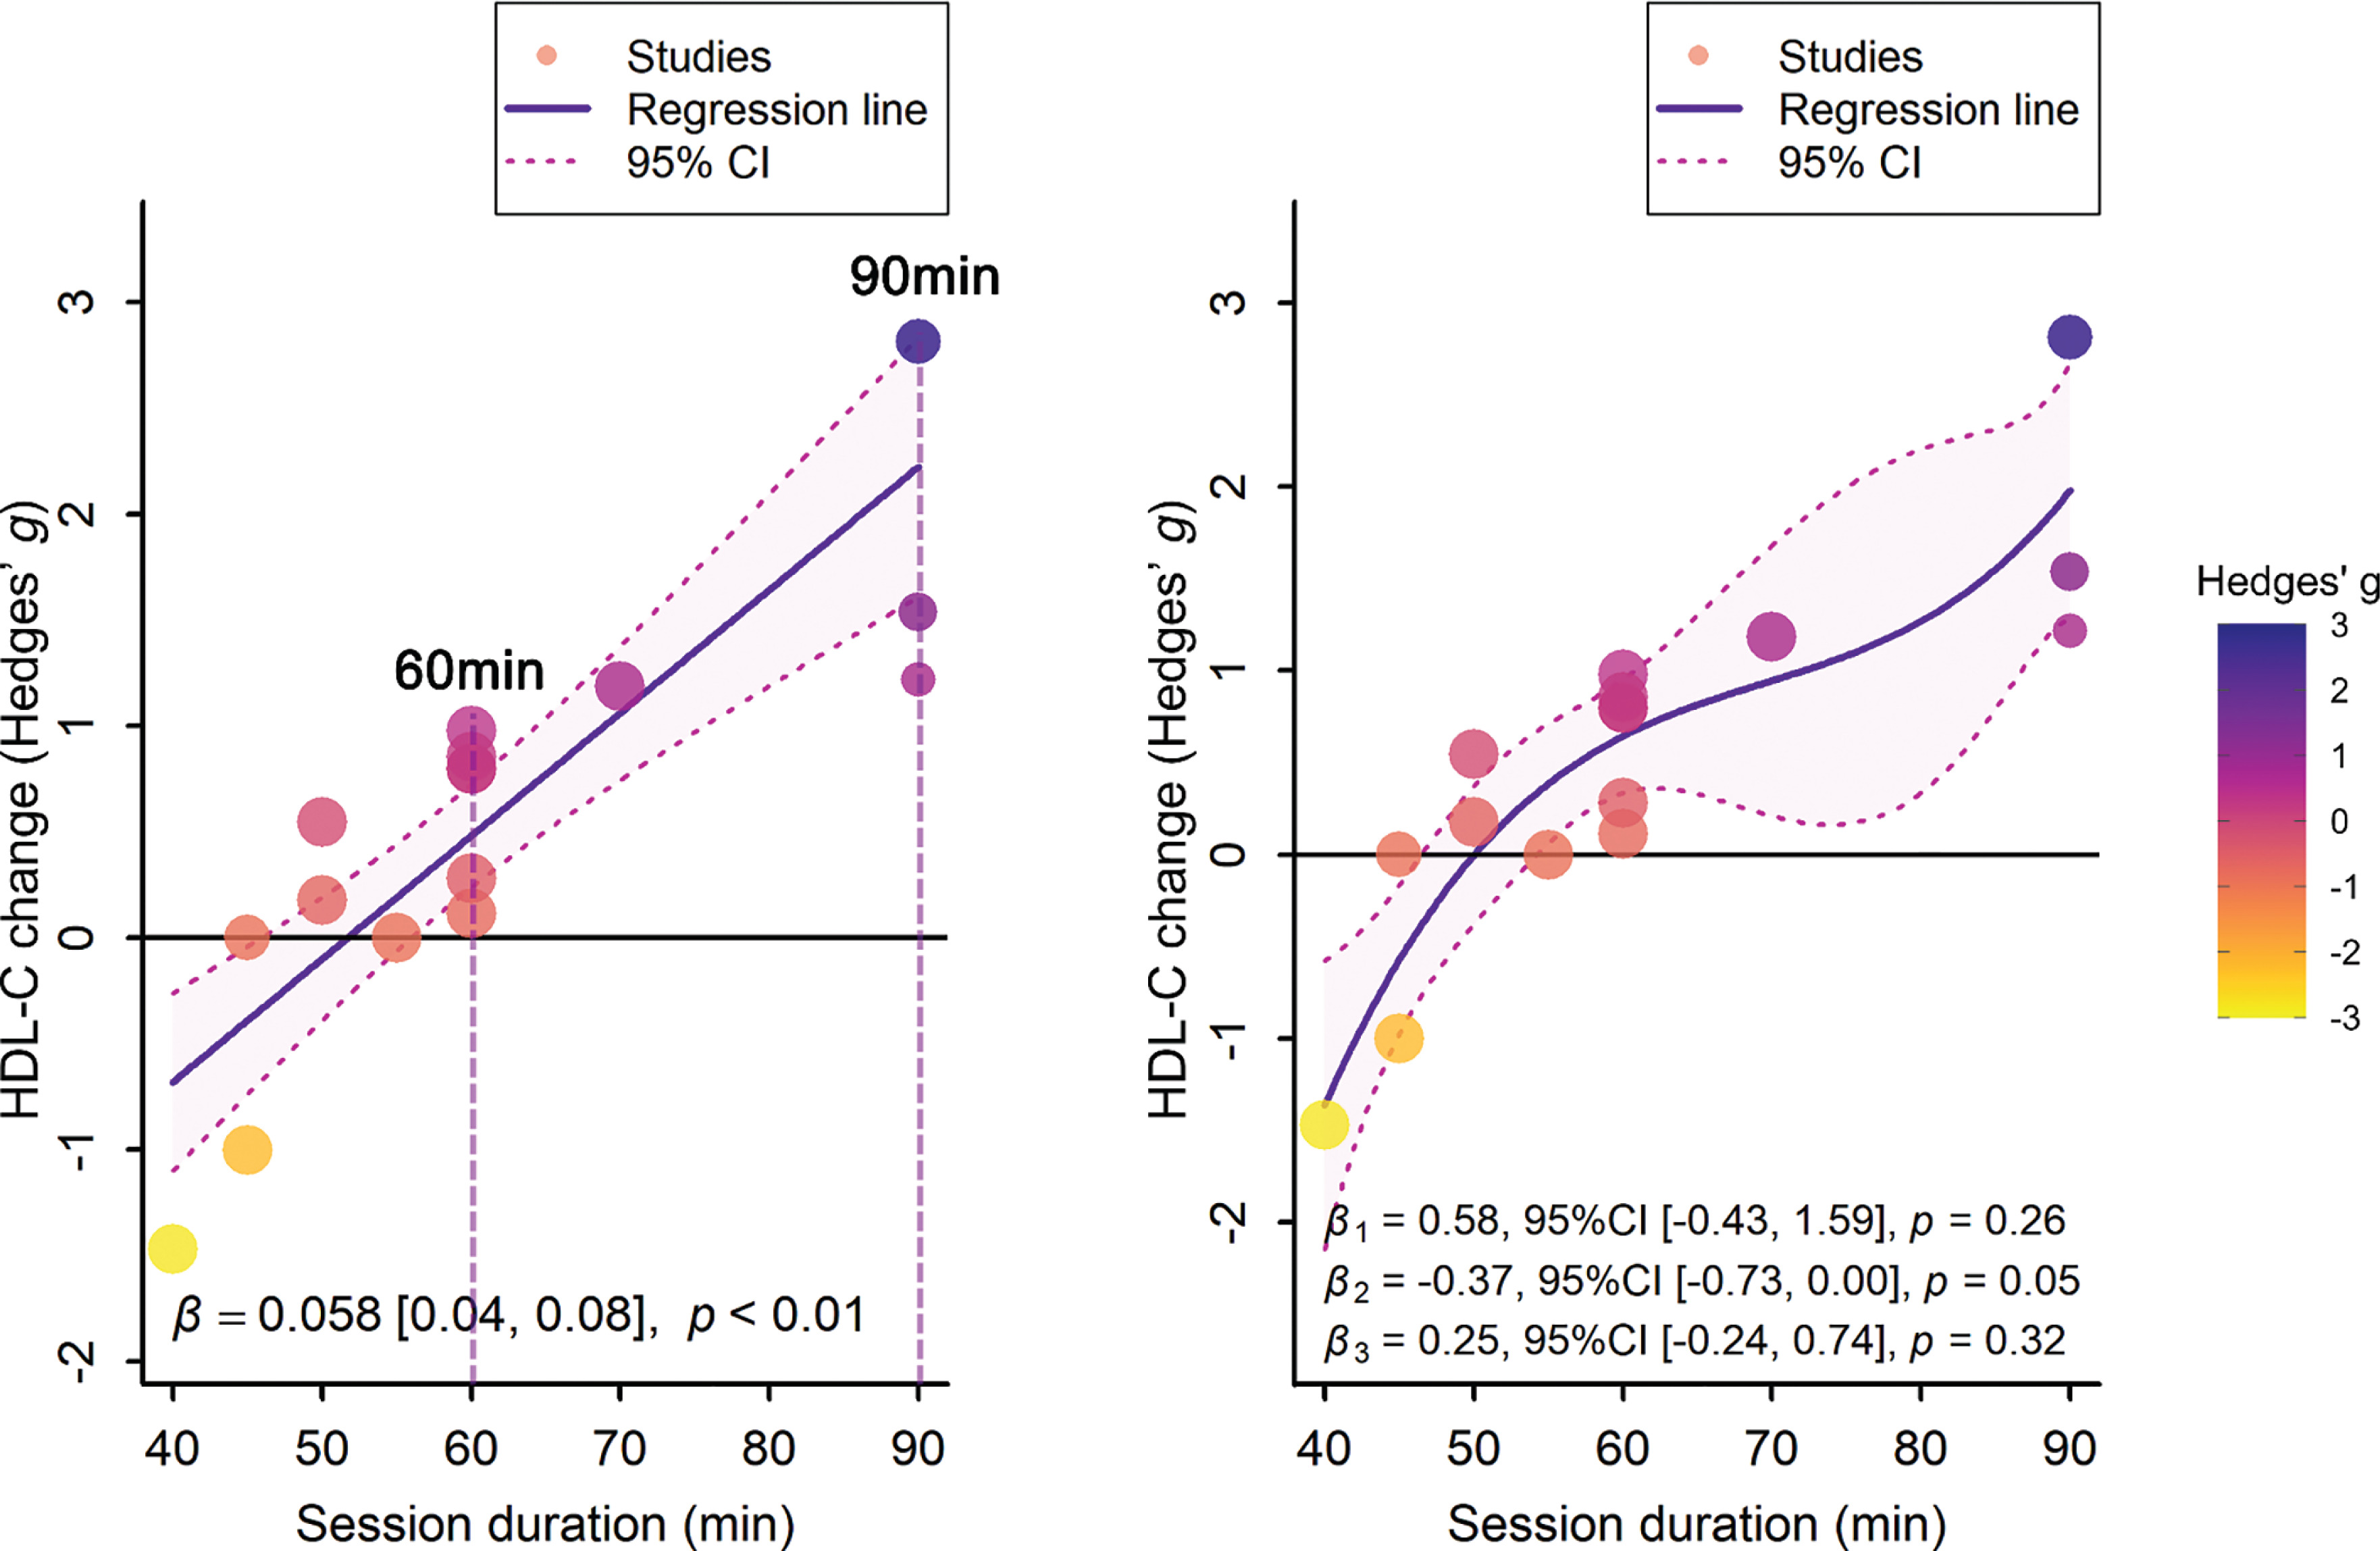
Meta-regression analysis of HDL-C changes in relation to session duration. The horizontal axis represents session duration (60–90 min), and the vertical axis represents the change in HDL-C before and after the intervention, with each bubble corresponding to one study. The left panel displays the simple linear regression model, whereas the right panel illustrates the cubic regression model. The value of 60 min indicates the lower significant threshold for the model prediction. When session duration ≥ 60 min, postintervention increases in HDL-C are more likely to reach statistical significance. Comparison of Akaike information criterion (AIC) values indicated that the linear regression model (left panel) provided a relatively better fit.
To enhance clinical applicability, a combined subgroup analysis explored the interaction effects of these significant moderators (Supplementary Fig. 9). Regarding the interaction between baseline HDLC and session duration (Pattern 1), results for the low HDL-C subgroup (≤ 1.36 mmol/L) showed that employing a long session duration (≥ 60 min) yielded robust and clinically meaningful improvements (g = 1.19), whereas a short session duration (< 60 min) proved ineffective (p = 0.43). Similarly, the high HDL-C subgroup (> 1.36 mmol/L) also required a long session duration to achieve significant benefits (g = 0.61). In terms of the interaction between baseline HDL-C and exercise intensity (Pattern 2), the low HDL-C subgroup responded positively to both intensities but derived greater benefit from high intensity (≥ 42.2%
Potential moderators of FPG
Across all subgroups, no statistically significant differences were observed for fasting plasma glucose (FPG) (p > 0.05 for all comparisons; Supplementary Fig. 7). However, FATmax training demonstrated a significant advantage over the control group in reducing FPG levels under most conditions. In the sex subgroups, males (g = -0.97), females (g = -1.01), and mixed samples (g = -1.69) all exhibited significant reductions, suggesting that sex was not a determining factor in the improvement of FPG. Regarding pre-exercise activity, only studies incorporating a warm-up session showed significant decreases in FPG (g = -1.16), whereas those without a warm-up did not reach statistical significance (p = 0.07). For dietary protocols, both dietary restriction (g = -1.74) and habitual diet conditions (g = -1.01) were associated with significant reductions. In terms of health status, significant improvements were observed in the simple overweight or obesity (OW/OB) subgroup (g = -1.00) and the overweight or obesity combined with chronic diseases (OW/OB+CD) subgroup (g = -1.25), indicating consistent efficacy across populations. With respect to training mode, both non-weight-bearing aerobic exercise (NWB-AE) (g = -1.38) and weight-bearing aerobic exercise (WB-AE) (g = -0.87) produced significant improvements in FPG. Furthermore, both randomized controlled trials (RCT; g = -0.96) and controlled trials (CT; g = -1.34) demonstrated significant reductions. Collectively, although no statistically significant subgroup differences were detected, FATmax training effectively reduced FPG across a wide range of conditions and participant characteristics, with effect sizes generally indicating large clinical magnitudes (g > 0.8).
Furthermore, meta-regression analysis revealed no significant moderating effects of age, BMI, baseline cardiorespiratory fitness (
Risk of bias and quality of methods
Most included studies were rated as having “some concerns,” as illustrated in Supplementary Fig. 11. According to the RoB 2.0 assessment, the most frequent sources of bias were associated with the randomization process (Domain 1), deviations from intended interventions (Domain 2), and selective reporting (Domain 5). In contrast, low risks of bias were observed for missing outcome data (Domain 3) and outcome measurement (Domain 4), reflecting consistent data completeness and standardized measurement procedures across studies. In the ROBINS-I assessment, non-randomized studies exhibited higher risks of bias, primarily related to confounding factors and participant selection. Notably, studies by Mohebbi et al. [61], Dumortier et al. [65], and Maurie et al. [66] showed elevated risk levels in these domains. It is crucial to acknowledge that these methodological limitations may have influenced the overall pooled estimates. Specifically, the lack of randomization introduces the potential for self-selection bias, where participants in the intervention groups might possess higher intrinsic motivation or better baseline health behaviors than those in the control groups. Such baseline imbalances could theoretically inflate the observed metabolic improvements, potentially leading to a slight overestimation of the pooled effect sizes for FATmax efficacy compared to strictly randomized conditions. While these issues appeared to arise largely from insufficient methodological reporting rather than substantive flaws in implementation, the contribution of these non-randomized trials to the aggregate results should be interpreted with this potential upward bias in mind.
Potential publication bias was evaluated using funnel plot asymmetry in conjunction with Egger’s regression test for outcomes including TG, HDL-C, LDL-C, TC, FPG, HOMA-IR, and FINS (Supplementary Fig. 12). Egger’s test indicated possible publication bias for TG (p < 0.01), HDL-C (p = 0.01), and FPG (p < 0.01), whereas no significant bias was detected for TC (p = 0.47), LDL-C (p = 0.10), HOMA-IR (p = 0.15), and FINS (p = 0.10).
Overall methodological quality was rated as moderate to high, with a mean PEDro score of 5.9 across the included studies (Supplementary Table 5), suggesting that despite some reporting limitations, the evidence base remains methodologically sound and suitable for quantitative synthesis.
Sensitivity analysis
Sensitivity analyses confirmed the robustness of the primary findings across different methodological assumptions. First, analyses employing baseline standard deviations (SDs) yielded statistical significance (p-values) consistent with the primary analysis across all outcomes, with only marginal variations observed in heterogeneity estimates (Supplementary Table 6). Second, to verify the stability of the effect size estimation, sensitivity analyses were conducted using alternative pre-post correlation coefficients (r = 0.25 and 0.75). The results demonstrated that the pooled effect sizes remained robust to these variations, indicating that the adoption of a conservative coefficient (r = 0.50) did not introduce bias to the overall conclusions.
Furthermore, leave-one-out sensitivity analyses were conducted for all primary outcomes (Supplementary Figs. 13–14). The results indicated that for outcomes with lower statistical power, the exclusion of individual studies exerted a more pronounced influence on the pooled estimates. Specifically, in the analysis of LDL-C, the exclusion of Dumortier et al. [65] (k = 13, g = -0.25, p < 0.05) shifted the overall effect from non-significant to significant.
Potential outliers were identified within the multilevel meta-analytic framework using Cook’s distance and studentized residuals. Outliers were detected for HDL-C, fasting plasma glucose (FPG), HOMAIR, and fasting insulin (FINS). Specifically, Dumortier et al. [65] and Maurie et al. [66] were flagged as outliers for HDL-C based on Cook’s distance; however, their exclusion did not meaningfully alter the repooled estimate (k = 14, g = 0.73, p < 0.01). Similarly, Safarimosavi et al. [63] was identified as an influential outlier for FPG, HOMAIR, and FINS by both diagnostic metrics, yet its exclusion did not materially affect the pooled results (FPG: k = 18, g = -0.96, p < 0.01; HOMA-IR: k = 12, g = -0.69, p = 0.11; FINS: k = 14, g = -0.62, p < 0.01).
Collectively, these specific studies [63, 65, 66] appear to be significant contributors to the heterogeneity observed in HDL-C and FPG. This divergence may be attributed to two primary factors. First, although Dumortier et al. [65] and Maurie et al. [66] both utilized lipid oxidation-based training prescriptions, methodological discrepancies in FATmax determination, target intensity setting, and individualized threshold definitions likely resulted in inconsistent intervention dosages and metabolic responses, thereby amplifying variability in HDL-C and FPG outcomes. Second, Safarimosavi et al. [63] recruited male participants with prediabetes who exhibited lower baseline glucose levels and potentially higher metabolic plasticity, leading to substantial post-intervention improvements in glycemic and insulin indices. These characteristics likely contributed to the inflated effect sizes for FPG and HOMA-IR observed in that study. Crucially, however, the exclusion of these outliers did not fundamentally change the overall conclusions for HDL-C and FPG, thereby confirming the robustness and stability of the findings.
DISCUSSION
This study demonstrates that FATmax training confers significant metabolic benefits in individuals with overweight or obesity. While previous meta-analyses by Romain et al. [17] and Chávez-Guevara et al. [18] established the efficacy of FATmax for anthropometric adaptations and cardiorespiratory fitness, the present study advances the field by shifting focus toward clinical utility and analytical depth. Unlike prior reviews limited to body composition, this investigation provides the first comprehensive quantitative synthesis specifically targeting glycolipid metabolic markers (e.g., FPG, HOMA-IR, and lipid fractions). Furthermore, we extend beyond aggregate effects to systematically explore dose-response interactions, identifying precise modulators of efficacy. These findings fill a critical gap in precision exercise prescription by establishing personalized intensity and duration thresholds. Notably, the intervention elicited large reductions in key glucose homeostasis markers (FPG, HOMA-IR, and FINS), offering clinical value beyond mere statistical significance. While FATmax also optimized lipid profiles (decreased TG/TC, increased HDL-C), the magnitude of these adaptations is nuanced, largely modulated by participant characteristics and intervention protocols— particularly intensity, modality, and duration.
Metabolic Effects of FATmax Training
Lipid metabolism capacity
Precise prescription of exercise intensity is a critical determinant of improvements in lipid metabolism among individuals with overweight or obesity. Unlike conventional aerobic training that primarily emphasizes total energy expenditure, training at the fat oxidation maximal zone (FATmax) specifically targets the metabolic range corresponding to an individual’s maximal fat oxidation rate (MFO), thereby enhancing the efficiency of lipid mobilization and oxidation [12]. Consequently, FATmax training offers unique metabolic advantages, particularly in regulating lipid fractions tied to oxidative efficiency.
The results of this meta-analysis demonstrate that FATmax training significantly improves key lipid parameters, specifically driving robust reductions in total cholesterol (TC) and triglycerides (TG), alongside significant increases in high-density lipoprotein cholesterol (HDL-C). However, the lack of significant reduction in LDL-C highlights a fundamental mechanistic divergence between the pathways optimized by FATmax and those required for effective LDL clearance. On one hand, FATmax primarily modulates peripheral lipid processing; by targeting maximal fat oxidation, it enhances lipoprotein lipase (LPL) activity, which accelerates the hydrolysis of TG-rich lipoproteins and fuels HDL-mediated reverse cholesterol transport [70, 71]. In stark contrast, the clearance of circulating LDL-C relies predominantly on hepatic mechanisms, specifically the upregulation of hepatic LDL receptors (LDLR) [72]. While pharmacological interventions (e.g., statins) and high-intensity aerobic exercise effectively stimulate LDLR expression to lower LDL-C [73, 74], FATmax appears to lack the requisite physiological stress or systemic threshold to activate this hepatic pathway [70, 75]. Consequently, while FATmax is highly effective for metabolic regulation at the muscular and peripheral level [24], it does not mimic the LDLR-mediated clearance mechanisms typically induced by pharmacotherapy or higherintensity training, leaving LDL-C levels largely unaffected [70, 75].
Sex-specific physiological characteristics appear to modulate lipid adaptations following FATmax training. Our analysis indicates that men generally achieved greater improvements in HDL-C. This trend may be attributed to higher lipoprotein lipase expression and elevated fatty acid uptake rates in males [76, 77]. Nevertheless, we emphasize that the limited number of male-only cohorts constrains the statistical power of this subgroup analysis. Consequently, these observed sex differences must be viewed as exploratory rather than definitive outcomes and warrant validation through larger and more balanced investigations. Similarly, interpretations regarding the combined effects of FATmax exercise and dietary energy restriction require caution. While the data suggest that combining these interventions enhances weight loss and lipid profiles beyond exercise alone [13, 78], the statistical power for this specific subgroup remains limited due to the small number of included studies. Therefore, these findings should be considered preliminary. However, regarding health status, our subgroup analysis revealed that significant HDL-C improvements were concentrated in individuals with simple overweight or obesity, whereas those with comorbid chronic diseases (e.g., type 2 diabetes) did not exhibit statistically significant changes. This disparity suggests that established metabolic pathologies may induce a state of metabolic inflexibility [79], where the physiological mechanisms for lipid oxidation and reverse cholesterol transport are impaired [80]. Consequently, this dysfunction may dampen the lipid-modulating efficacy of FATmax training in these specific populations [81]. Pre-exercise preparation also influences FATmax efficacy. Gray et al. demonstrated that an active warm-up enhances lipid oxidation and metabolic readiness [82]. Thus, gradually increasing exercise intensity to reach the FATmax range may more effectively activate lipid mobilization compared with starting directly at the target intensity. Finally, concerning exercise modality, our subgroup analyses indicated that weightbearing aerobic exercises (WB-AE), such as running, elicited significantly greater HDL-C improvements compared to non-weight-bearing aerobic exercises (NWB-AE), such as cycling. While Achten et al. observed no significant differences in acute fat oxidation rates between modalities under matched intensities [83], Thomas et al. found that treadmill exercise induced approximately 21% greater fat oxidation than cycling [84]. This advantage of WB-AE likely reflects the greater muscle mass recruitment and mechanical load required to support body weight, which drives higher total energy expenditure and systemic lipid mobilization. Therefore, when orthopedic conditions permit, clinicians might prioritize weight-bearing modalities to maximize metabolic adaptations.
Unlike traditional aerobic protocols that primarily rely on total volume, FATmax-induced adaptations hinge on achieving the specific metabolic threshold for maximal fat oxidation [12, 13]. Our regression analysis identified a critical intensity threshold of approximately 42.2%
From a clinical perspective, session duration constitutes a pivotal determinant for optimizing lipid profiles, suggesting that generalized protocols may require specific refinement for effective obesity management. Although the American College of Sports Medicine (ACSM) recommends accumulating a minimum of 150 minutes of moderate-intensity physical activity per week for general health [86], our analysis indicates that this standard volume is often inadequate for driving robust HDL cholesterol remodeling in individuals with obesity. We observed that while therapeutic efficacy was influenced by baseline lipid status, the necessity for prolonged duration appeared universal. Specifically, for individuals with low baseline HDL levels, extending sessions beyond 60 minutes was obligatory to elicit substantial improvements, whereas shorter durations failed to trigger comparable adaptations. Furthermore, even for those with higher baseline levels, prolonged duration served as the primary requisite for maximizing benefits. This underscores a critical evolution for personalized prescription: clinicians should prioritize extending duration beyond the standard 150-minute weekly benchmark to target sessions of at least 60 minutes. This approach is essential to surmount physiological resistance to lipid adaptation, ensuring the exercise dose is sufficient to transition from simple weight maintenance to active metabolic therapeutic intervention.
Mechanistically, the observed metabolic improvements are intrinsically linked to the optimization of substrate utilization at FATmax intensity. By maximizing the rate of fatty acid oxidation, FATmax training effectively depletes the pool of bioactive lipid intermediates—specifically intramyocellular lipids (IMCL) and diacylglycerol (DAG)—which are potent inhibitors of the insulin signaling cascade (e.g., via IRS-1 phosphorylation) [87, 88]. Beyond acute substrate clearance, training in this zone provides a critical stimulus for mitochondrial biogenesis, characterized by the upregulation of key oxidative enzymes such as citrate synthase (CS) and β-hydroxyacyl-CoA dehydrogenase (β-HAD) [89]. This mitochondrial adaptation enhances the muscle’s “metabolic flexibility” [79, 90, 91], effectively alleviating the lipid-induced blockade on glucose uptake [92] and facilitating greater insulin-stimulated GLUT4 translocation at the sarcolemma [87, 93].
In conclusion, the metabolic implications of FATmax training appear to involve more than just the immediate physiological load. Our analysis suggests that these benefits likely stem from a synergistic interaction among exercise intensity, nutritional status, and individual characteristics. Therefore, by aligning broad clinical guidelines with personalized adjustments for intensity and duration, FATmax training may offer a viable strategy to enhance systemic metabolic flexibility and support general metabolic health in individuals with overweight or obesity.
Glucose metabolic capacity
Restoring glucose homeostasis remains a pivotal objective of exercise interventions targeting metabolic health in individuals with overweight or obesity. The present meta-analysis demonstrates that FATmax training significantly ameliorates fasting plasma glucose (FPG), fasting insulin (FINS), and HOMA-IR in this population. Collectively, these findings indicate that FATmax training provides a potent physiological stimulus for enhancing insulin sensitivity and optimizing glycemic control.
Mechanistically, the glucose-lowering effects of FATmax training are inextricably coupled with the regulation of lipid metabolism, a relationship consistent with the classic “glucose-fatty acid cycle” (Randle cycle) [94]. In individuals with obesity, the accumulation of ectopic lipids (such as IMCL) typically creates a state of “metabolic inflexibility”, where muscle cells fail to switch between fuel sources efficiently [91, 95]. FATmax training addresses this by maximizing the oxidation of fatty acids during exercise, which effectively depletes the reservoir of lipid metabolites that interfere with glucose handling [96]. By reducing the “lipid congestion” inside the muscle cell, FATmax re-sensitizes the insulin signaling pathway (specifically the PI3K/Akt axis), thereby restoring the efficiency of insulin-stimulated GLUT4 translocation and glucose uptake [93, 97, 98].
However, the magnitude of these glycemic adaptations appears to be modulated by changes in body composition. While current evidence supports the general efficacy of FATmax training, variations across studies suggest that weight loss acts as a critical mediator. For instance, Mora-Rodriguez et al. reported that in individuals with metabolic syndrome, significant improvements in insulin sensitivity were observed only when exercise-induced body weight reduction exceeded 3% [99]. This implies that while FATmax intensity optimizes substrate utilization, the full restoration of insulin sensitivity relies partly on a concomitant reduction in adiposity. Consequently, the regulatory effects of FATmax on glucose metabolism are likely influenced by individual characteristics, including baseline metabolic state, body fat distribution, and aerobic fitness [100].
From a clinical prescription perspective, our findings support the volume recommendations of the American College of Sports Medicine (ACSM) and the American Diabetes Association (ADA), which suggest 150–300 minutes of moderate-to-vigorous aerobic exercise per week [86, 101, 102]. However, our results argue for a more nuanced definition of “moderate” intensity. Recent evidence suggests that the heart rate corresponding to FATmax should be tailored to body composition. Individuals with body fat percentages above 35% may achieve maximal benefits at 61–66% of HRpeak, whereas those with body fat below 35% may optimize fat oxidation and glycemic stability at 57–64% of HRpeak [103].
To maximize the efficacy of these prescriptions, procedural optimization remains critical, particularly concerning warm-up protocols and nutritional timing. Borghouts et al. demonstrated that an active warm-up enhances glucose metabolism by increasing skeletal muscle temperature and blood flow, thereby facilitating the earlier activation of glucose uptake pathways [104]. Therefore, incorporating standardized warm-up routines serves not only to reduce injury risk but also to prime the metabolic environment for efficient glucose regulation.
Furthermore, the interaction between exercise and nutritional status requires careful consideration. While acute aerobic exercise in a fasted state may transiently elevate circulating glucose and insulin due to metabolic stress [105], chronic training in the fasted state appears to drive superior adaptations. In a 6-week intervention involving a hyper-caloric fat-rich diet, Van Proeyen et al. demonstrated that long-term endurance training performed in the fasted state was more effective than training in the fed state at preserving glucose tolerance. Crucially, this chronic adaptation was underpinned by a significant upregulation of skeletal muscle GLUT4 protein content (+ 28%) and enhanced AMPK phosphorylation (+ 25%), adaptations that were blunted when carbohydrate was ingested before and during exercise [106]. These findings imply that although shortterm fasting may impose transient stress, long-term FATmax training performed in a fasted state can induce beneficial adaptations that enhance metabolic flexibility through improved lipid-glucose crosstalk.
In summary, FATmax training represents a physiologically grounded approach to mitigating insulin resistance by aligning exercise stress with maximal lipid oxidation rates. Nevertheless, interpretations of these findings warrant a prudent perspective. We explicitly state that while the current evidence points towards metabolic benefits, the estimate of the effect size may change with future highquality research. Therefore, the successful clinical application of FATmax relies not merely on the intensity prescription itself but requires a holistic implementation involving precise monitoring, optimized preparation, and supportive nutritional strategies to effectively restore glucose homeostasis.
Limitations of the study
First, the inclusion criteria were restricted to eligible studies published in English and Chinese, which may have led to the omission of relevant data published in other languages, thereby introducing potential language and publication bias. Although comprehensive searches across major databases were conducted to minimize this risk, the complete elimination of such bias cannot be guaranteed. Second, the distribution of sample sizes across participant characteristics and subgroups was uneven. In particular, male participants accounted for a relatively small proportion of the total sample (193 of 638 participants). This imbalance may have reduced the representativeness and statistical robustness of subgroup analyses, potentially limiting the strength of inferences specific to gender. Third, methodological heterogeneity regarding FATmax determination restricts the precise comparability of intervention effects across studies. The included studies relied on varying assessment protocols (e.g., differences in stage duration and load increments) and distinct mathematical models to identify maximal fat oxidation rates. This lack of standardization introduces potential measurement confounding and variability in the prescribed training intensities, which may obscure the precise magnitude of the FATmax training effect. Finally, the overall number of studies investigating FATmax training in populations with overweight or obesity remains limited, with a geographically concentrated distribution primarily within a few countries, which may restrict the generalizability of our findings. Nevertheless, while sensitivity analyses demonstrated consistent overall trends and stable effect estimates, given the limited sample sizes and statistical power in certain subgroups, the results should be interpreted with appropriate caution.
Future Research Directions
Based on the identified limitations and the novel findings of this meta-analysis, several critical avenues emerge for future investigation to refine clinical prescriptions. First, future research should prioritize Randomized Controlled Trials (RCTs) designed to explicitly validate the personalized thresholds identified in our interaction analyses. Specifically, experimental studies are needed to compare the differential efficacy of session durations (e.g., ≥ 60 min vs. < 60 min) in individuals with specific phenotypes, such as those with low baseline HDL-C (≤ 1.36 mmol/L), to confirm the causal validity of these regression-derived cutoffs. Second, investigating the synergy between FATmax training and specific nutritional strategies warrants rigorous examination. Future research should explore how FATmax training interacts with interventions such as time-restricted eating (TRE) or distinct macronutrient manipulations to elucidate potential additive effects on metabolic flexibility and substrate oxidation efficiency. Third, to address the geographical and demographic concentration of current data, future investigations must expand to more diverse populations. It is critical to validate these findings across different ethnic groups and in individuals with severe obesity (Class III) to ensure the global generalizability and safety of these precision exercise prescriptions. Fourth, to mitigate methodological heterogeneity and enhance reproducibility, strict adherence to standardized reporting is paramount. We strongly recommend that future investigations explicitly detail the incremental test protocol (including stage duration and load increments), the specifications of gas analysis equipment, and the specific mathematical algorithm utilized for FATmax determination. Such transparency is a prerequisite for high-quality evidence synthesis and the precise translation of research into clinical practice.
CONCLUSIONS
FATmax training elicits significant metabolic benefits in individuals with overweight or obesity, specifically by improving triglycerides (TG), high-density lipoprotein cholesterol (HDL-C), total cholesterol (TC), fasting plasma glucose (FPG), insulin resistance (HOMA-IR), and fasting insulin (FINS), although changes in low-density lipoprotein cholesterol (LDL-C) are less pronounced. The magnitude of these adaptations is influenced by several moderators: male participants, weight-bearing modalities (e.g., running), and protocols incorporating warm-up sessions generally exhibit superior metabolic enhancements. Furthermore, combining FATmax training with dietary restriction yields additional benefits for HDL-C, though not for FPG. Crucially, our combined subgroup analysis provides precise, actionable guidance for optimizing lipid management: for individuals with lower baseline HDL-C (≤ 1.36 mmol/L), training efficacy is theoretically maximized when session duration exceeds 60 minutes or exercise intensity is maintained above 42.2%