
Ultrasound examination and high frequency ultrasound
Non-invasive imaging of human organs and tissues is one of the most vital trends in medical diagnostics [1]. Different diagnostics methods, including X-ray computed tomography, magnetic resonance imaging, and diagnostic ultrasound are quickly evolving and improving. Ultrasound (US) or sonography is the most common non-invasive diagnostic method. In 2000-2011, the number of ultrasound imaging procedures increased more than a ten-fold [1, 2]. It is relatively inexpensive, portable, and does not involve ionizing radiation.
Traditionally, US frequencies used in diagnostic radiology range from 1 MHz to approximately 16 MHz. The traditional scanning probes with a frequency of 1-3.5 MHz are used for deep-seated structures abdomen and obstetric imaging, 5 MHz in breast and pelvis imaging, and 7.5-16 MHz in breast, thyroid, superficial veins, superficial masses, and musculoskeletal imaging. The resolution of sonography strictly depends on the frequency. The higher the frequency of US, the better resolution achieved. Visualization of skin layers, such as hypodermis, especially dermis and epidermis, requires much higher frequencies, since skin morphological structures have a small dimension; the thickness of epidermis on the face and body is 70-120 µ, and this of palmar and plantar skin is 220-600 µ [3, 4], whereas the thickness of dermis is 0.7-4.5 mm [3, 5]. High frequency ultrasound (HFUS) uses frequencies in the range of 20 to 100 MHz [6]. The resolution of this method is very high, varying from 80 to 16 µ (10-6 m), allowing to visualize objects measuring approximately 0.08 mm up to 0.016 mm. The HFUS physical principle is based on the fact that ultrasonic wave reflects the boundaries between structural parts of biologic tissue (e.g., fibers, cells, blood, lymphatic vessels), with different acoustic properties, such as acoustic impedance and ultrasound speed in the tissue.
US sensitivity is very high and allows for tissue differentiating with only a 0.1% density difference. Due to high heterogeneity of the epidermis, dermis, and subcutaneous fat structural components, HFUS scanning produces images matching the real skin morphology.
HFUS probe contains piezoelectric crystal, which emits ultrasonic waves and receives ultrasonic waves reflected from biological tissues. The principles of HFUS are presented in Figure 1. As the transducer in Figure 1 moves over the skin, it works in the pulse-echo regime. The red vertical line in Figure 2 corresponds to the ultrasound beam penetration in the skin. As the US wave beam penetrates deep into the tissue, part of the ultrasonic waves is reflected from structural elements of the tissue and sent back to the transducer. The amplitude of each reflected signal is registered by the transducer and stored within the system. This amplitude curve is the record of signal reflected from the structural elements of tissue located at different depths, and is called “amplitude” or “A-scan”. The white amplitude curve on the blue background seen in Figure 2 is an example of A-scan. The strength of reflected signal varies significantly for different structural elements of the skin.
Fig. 1
HFUS skin scanning principles. 1. Piezoelectric probe, 2. Water in the applicator tip, 3. Direction of the ultrasound crystal movement, 4. Penetrating ultrasound wave, 5. Reflected ultrasound waves, 6. Membrane on the applicator tip, 7. Ultrasound contact gel, 8. Epidermis, 9. Dermis, 10. Subcutaneous fat
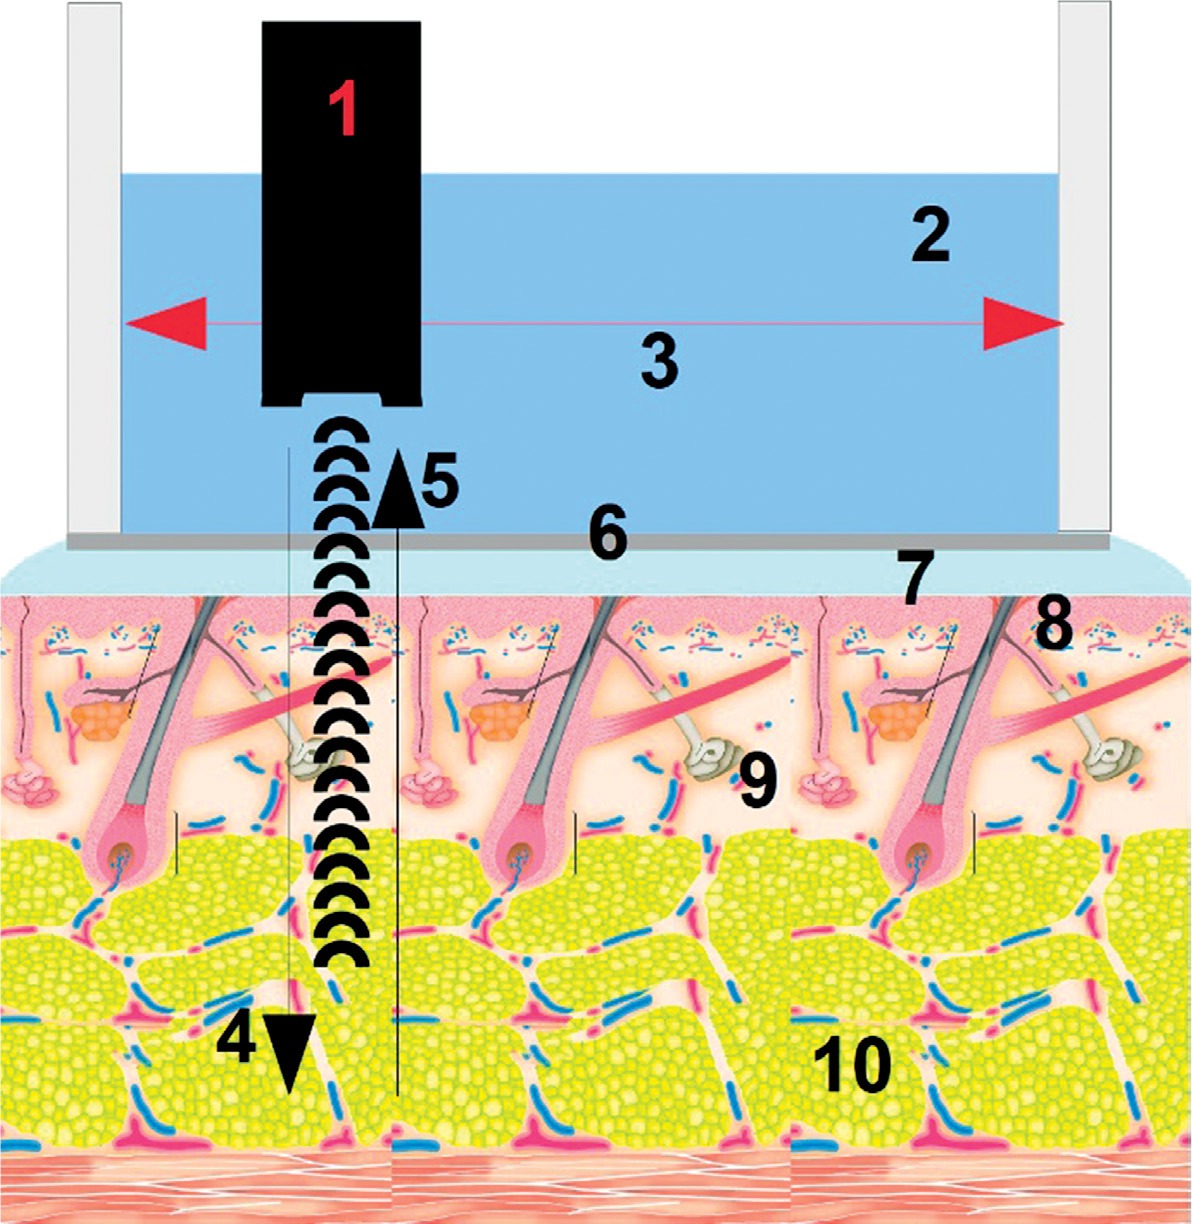
Fig. 2
Two-dimensional 75 MHz HFUS scan and one-dimensional A-scan. Red vertical line corresponds to the direction of penetration and the reflection of ultrasonic wave. 1. Epidermis, 2. Dermis, 3. Lower dermis, with border between dermis and subcutaneous fat, 4. Subcutaneous fat, 5. Superficial fascia
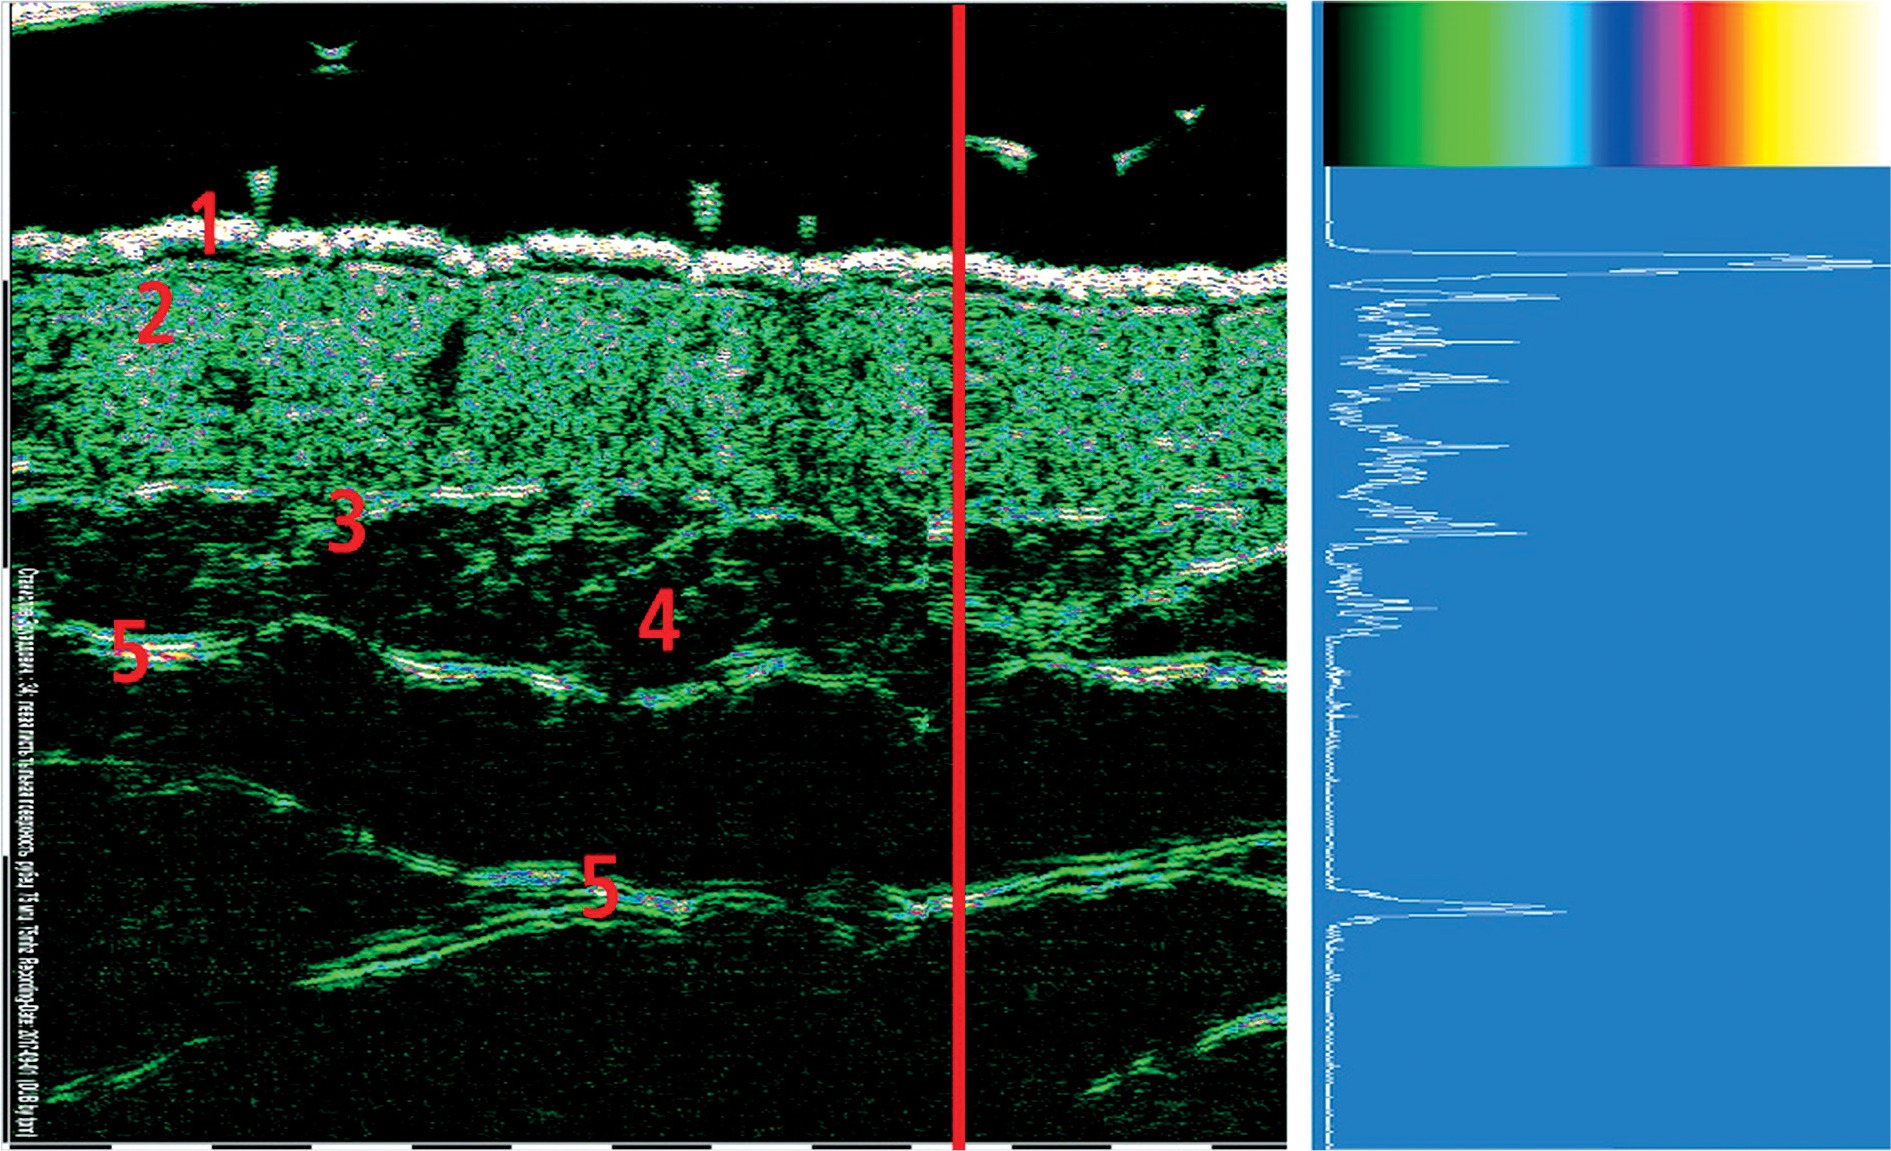
Figure 2 presents intact dorsal palmar skin 75 MHz scan of a 34-year-old healthy person. The strongest amplitude is recorded in the epidermis because it contains elements with the highest acoustic impedance heterogeneity: keratinized scales of the stratum corneum, lipids in the intercellular spaces, and the spinose and basal layers cells. The thin sub-epidermal anechoic band is most probably a kind of SLEB (sub-epidermal low echogenicity band). SLEB, also known as “sub-epidermal non-echogenic band” (SENEB), which is usually visualized on UV damaged skin, or in patients with inflammatory skin diseases [6]. The dermis contains elements of various density, such as collagen and elastin fibers, which are combined into bundles, glycosaminoglycans, cells, blood and lymph vessels, and nerve fibers. Therefore, the amplitude of reflected signals fluctuates between low and medium values. The main elements of fatty tissue lipocytes are 90% filled with fatty vacuoles, which determines the uniformity of acoustic density and results in very low amplitude of the reflected signal. Connective tissue fascia is much denser than adipose and muscle tissue, and reflects ultrasound waves well, so the amplitude of reflected signal is medium and high.
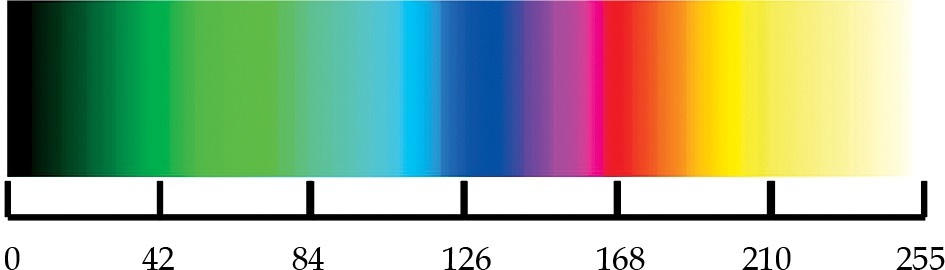
The reflected signal amplitude is then converted into a pixel color in two-dimensional image. As it can be seen in Figure 2, there is a color scale above the A-scan diagram used to convert amplitude values to adequate pixel color. During digital conversion process, the amplitude values are separated at 256 levels, ranging from 0 to 255. Zero amplitude is displayed in black color, low values are dark green and green, medium values are blue, purple, and pink, and high amplitude values are presented in red, orange, and yellow colors. The highest amplitude at 255 level is shown as white color. Figure 3 shows an example of conversion from amplitude value to color presentation.
Fig. 3
Color scale used to convert amplitude values into color pixels. Level 0 is displayed in black color, level 42 in green, 84 in light green, 126 in blue, 168 in red, 210 yellow, and level 255 in white color
Depending on the type of US system, the device can store from 128 up to 386 A-scans used to build two-dimensional vertical slice-cut skin image. The penetration depth depends on the US frequency. For example, 22 MHz US wave can penetrate up to 8-10 mm depth, 33 MHz up to 6-8 mm, and 75 MHz up to 3-4 mm.
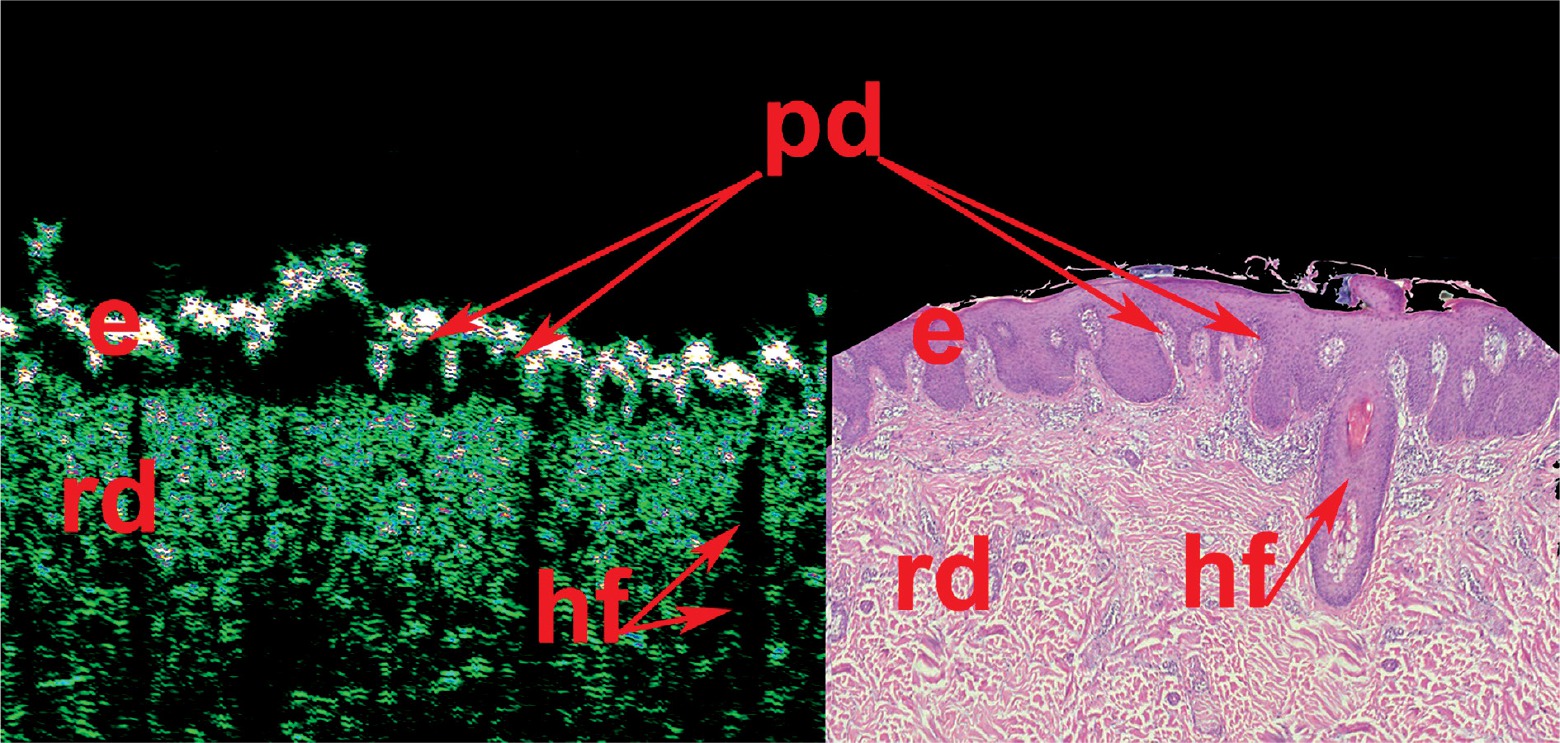
One of the main advantages of HFUS is the visualization with an option of direct internal skin structure measurements (Figure 4), and the detection of micro-morphological changes in different skin pathologies, including skin neoplasms (Figure 5). Such detailed information would not be available to obtain during external examination with palpation, even with dermoscopic optical imaging. Another advantage of skin HFUS is the fact that the obtained US images of the skin represent skin pathology images, therefore, they can be easily interpreted by dermatologists and oncologists. Figure 6 shows HFUS scan taken with 75 MHz probe of a psoriatic papule, with corresponding histological image of the same lesion. This skin lesion was surgically excised, and post-operative pathological measurements matched those taken at HFUS. Figure 6 consist of 2 parts: left part HFUS 75 MHz image and right part histological image with indication of the epidermis, papillary dermis, and reticular dermis as well as hair follicles. Dermal papillae (indicated as “pd”) in Figure 6 are shown with red arrows. At HFUS and histology images, dermal papillae looks very similar.
Fig. 4
75 MHz HFUS image of normal skin taken from the inner forearm. e – epidermis, pd – papillary dermis, rd – reticular dermis, bv – blood vessels, fat – subcutaneous fat tissue, fas – fascia, msc – muscle, hf – hair follicle, map – musculus arrector pili
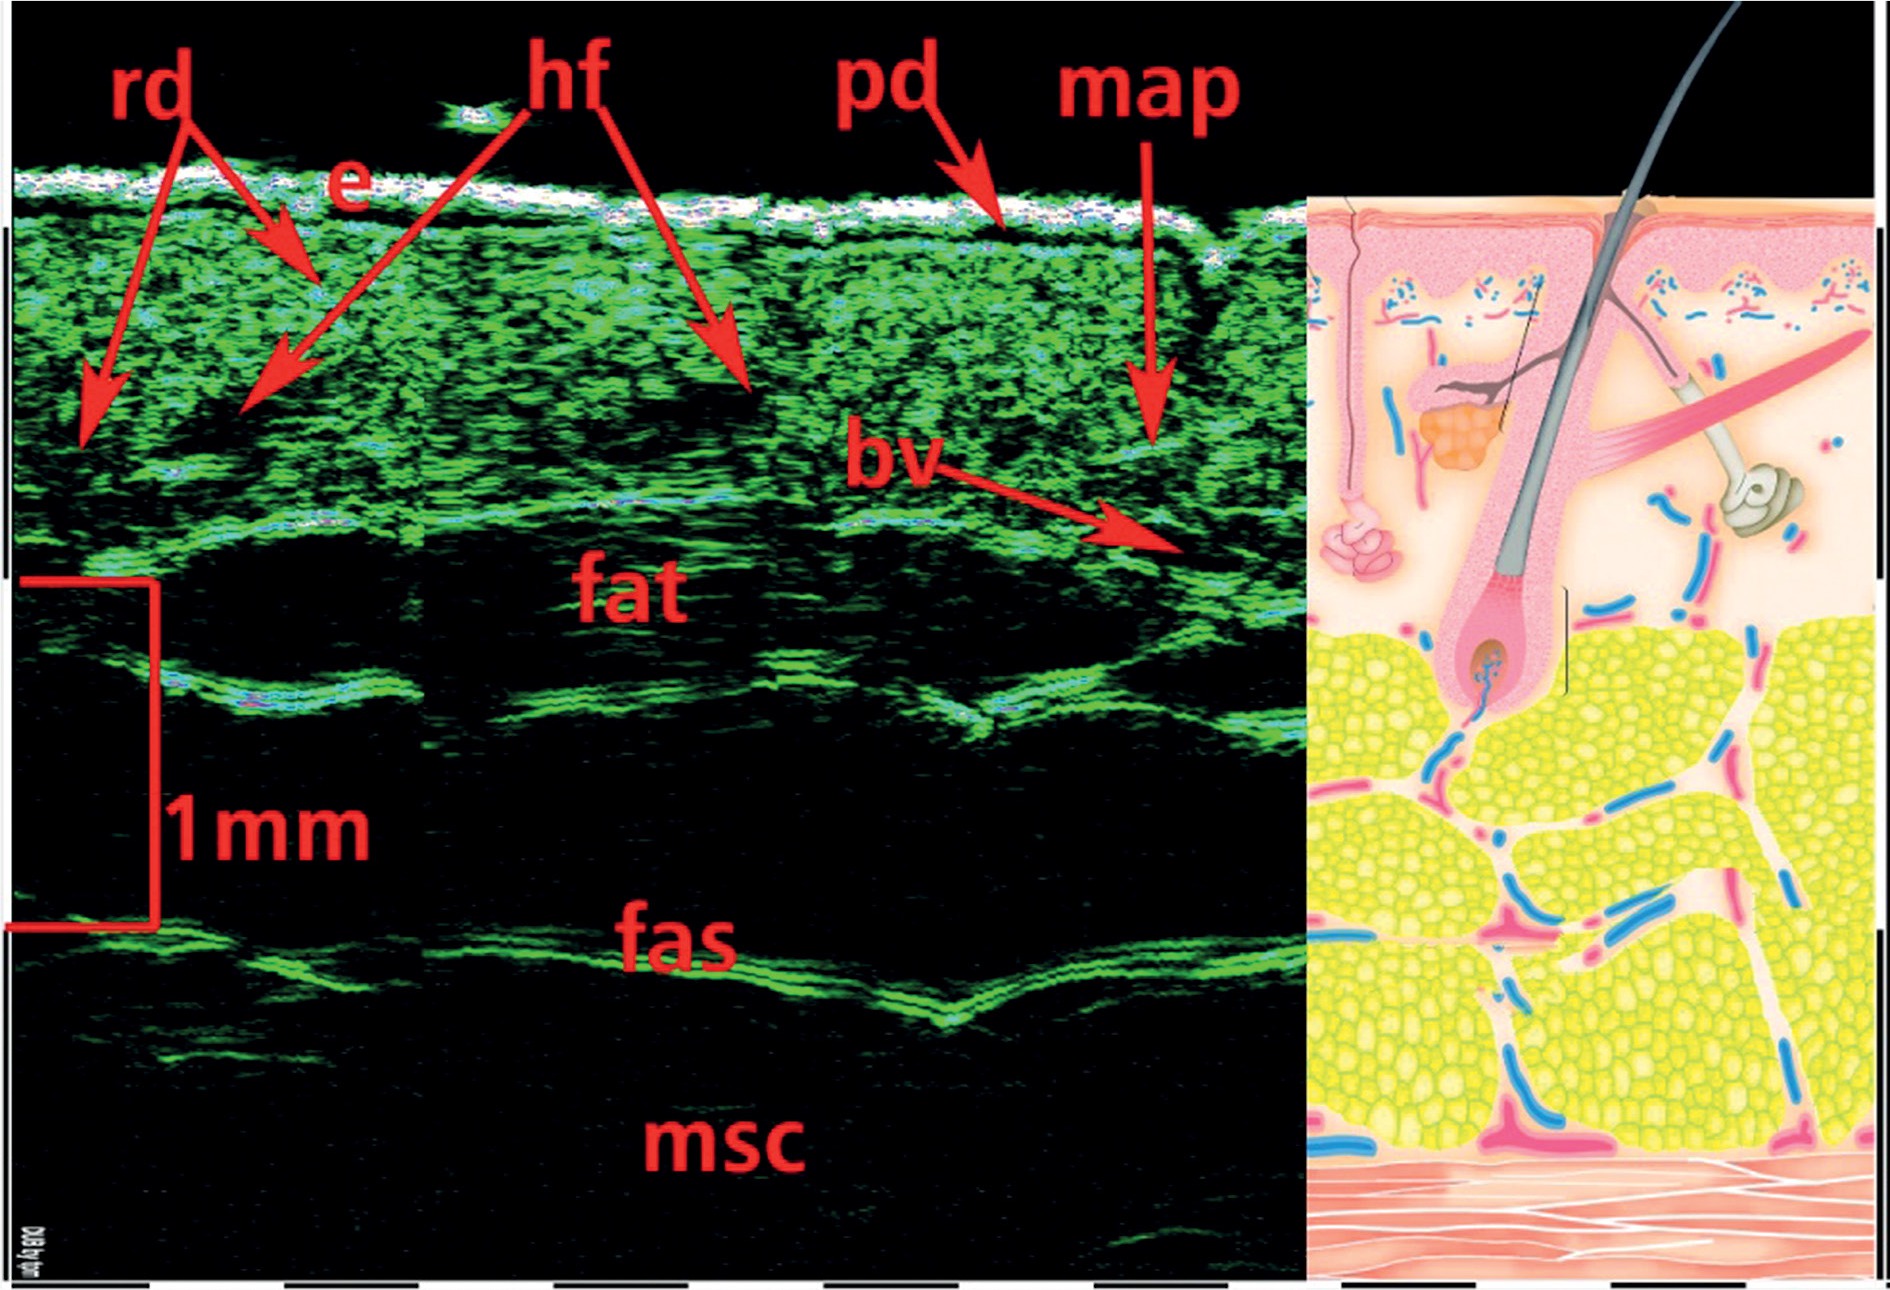
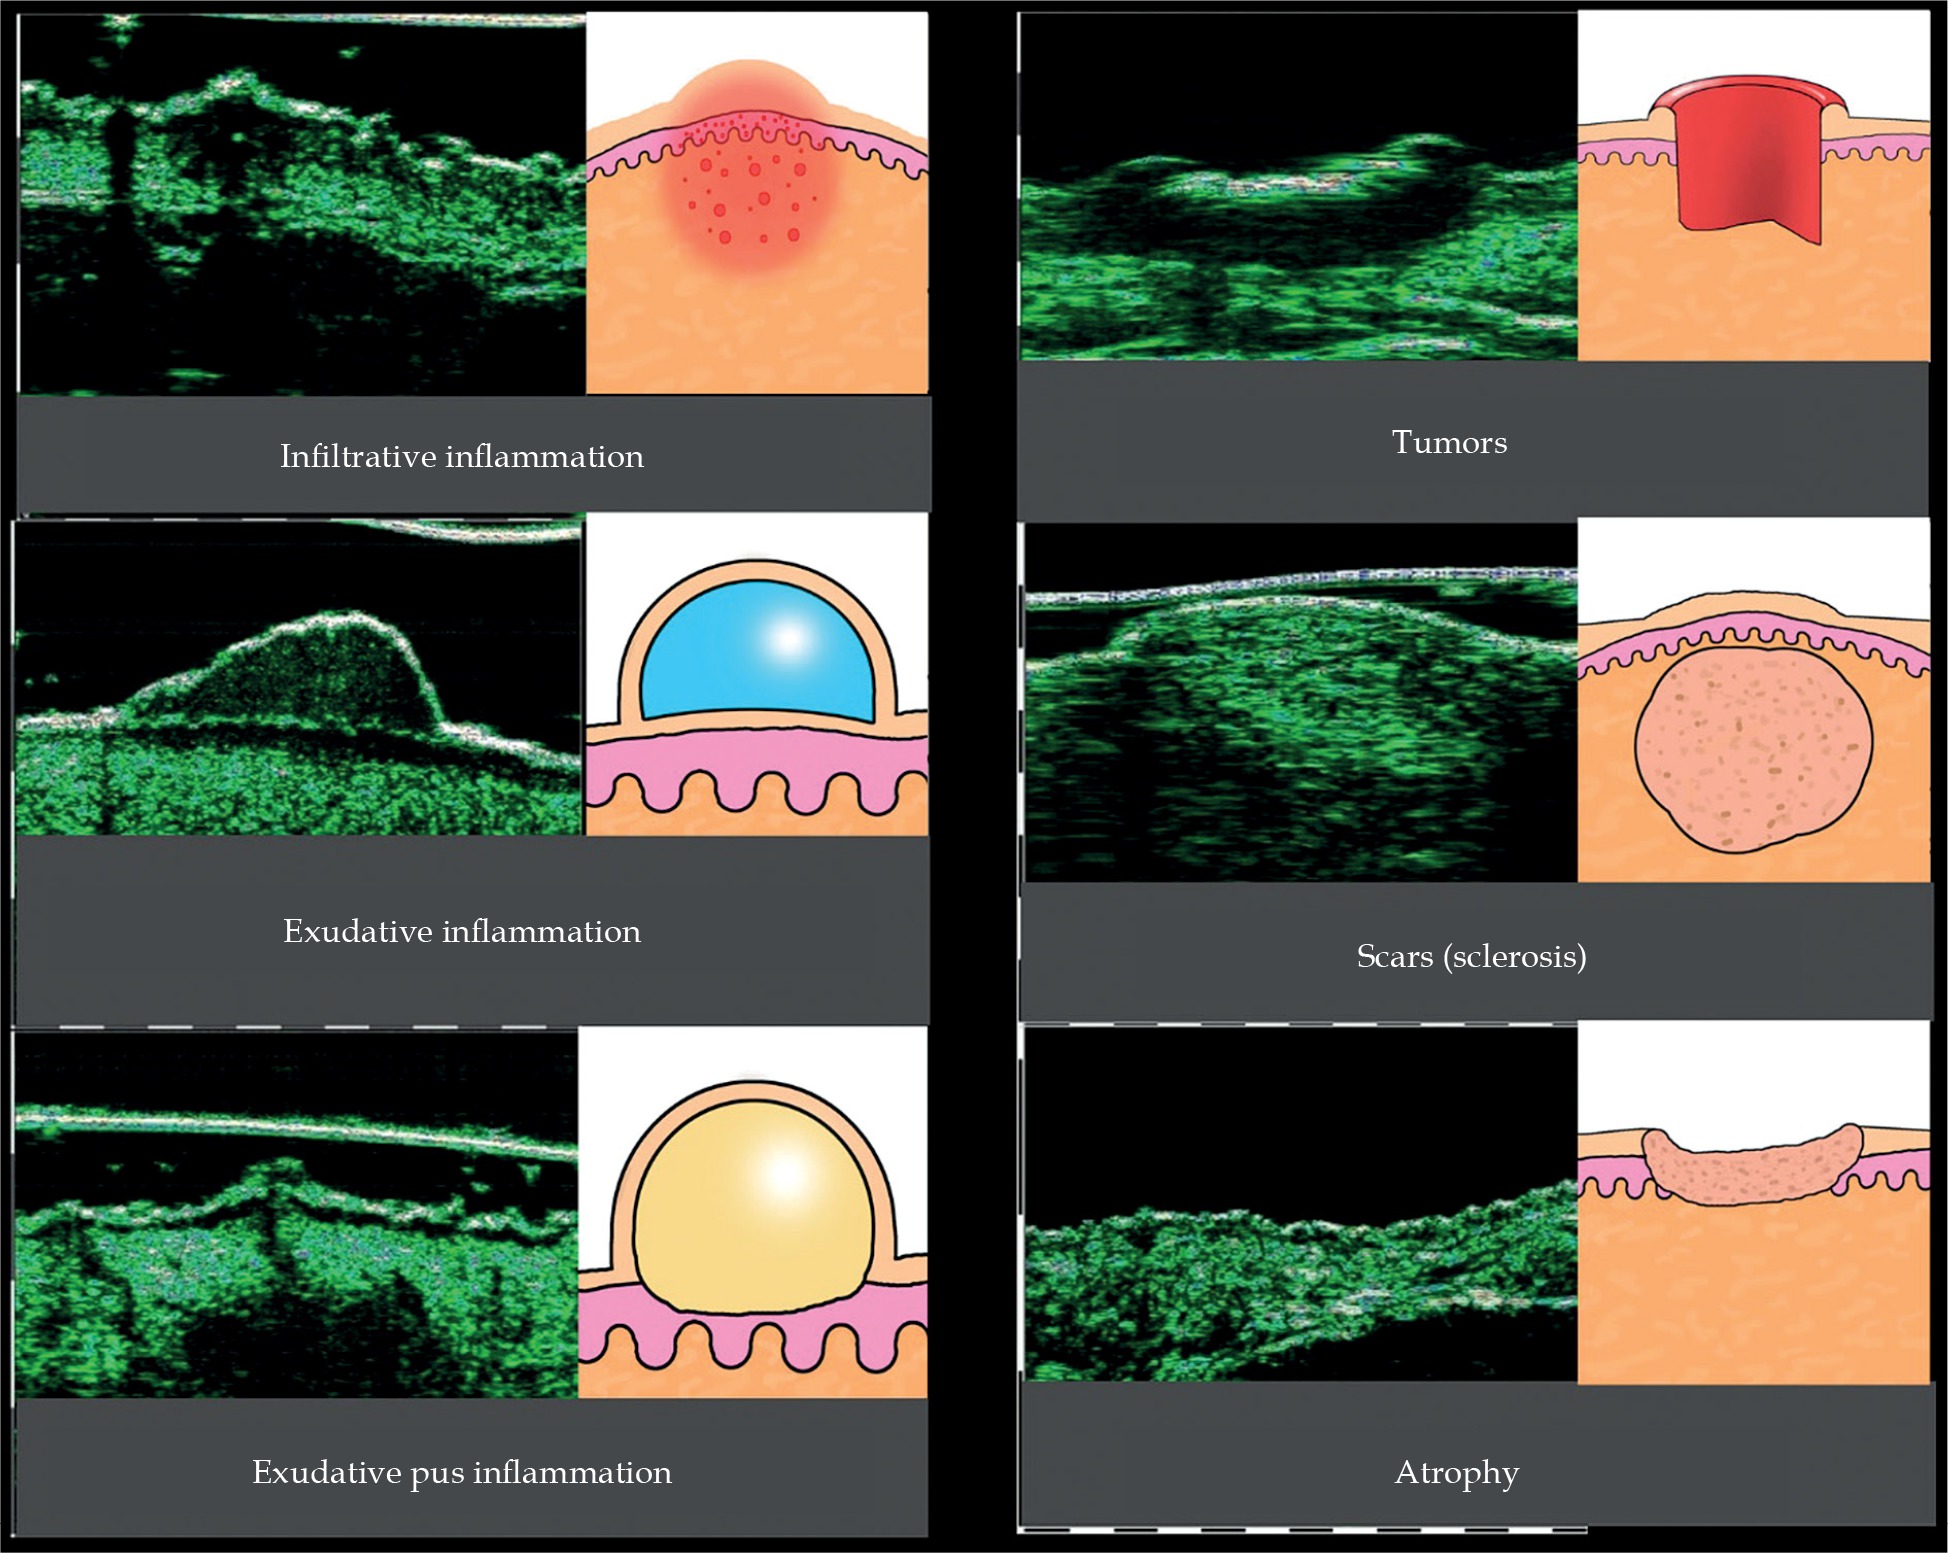
Fig. 6
HFUS scan of a psoriatic papule, with corresponding post-surgical pathology image. e – epidermis, pd – papillary dermis, rd – reticular dermis, hf – hair follicle
The use of HFUS has been studied in normal skin and in various skin pathologies. It has been found useful in differentiation diagnosis of infiltrative (perivascular) and exudative inflammation, hypertrophic or normotrophic scars, keloids, and in skin atrophy. Also, it has been used to support diagnosis and management of skin tumors (Figure 5).
Currently, HFSUs are applied within the following areas:
micro-anatomical structure of healthy skin and echo-graphic signs of aging study;
assessment of skin condition and anatomical features before cosmetic and plastic surgery, e.g., in Botox or fillers injections and for post-procedure follow-up, such as efficacy and side effects of the procedure, and location of fillers;
support of differential diagnosis and management in various skin pathologies, including pre-biopsy assessment;
follow-up after pharmacotherapy, topical therapy, physiotherapeutic, and destructive skin treatments used in dermatology, cosmetology, oncology, and plastic surgery;
assessment of skin tumors’ characteristics, and margins and vascular pattern in dermato-oncology.
The use of HFUS in dermato-oncology
Non-melanoma skin cancers (NMSC) are the most common malignant skin tumors with basal cell carcinoma (BCC), followed by squamous skin carcinoma (SCC) [7]. The aim of NMSC treatment is to remove the tumor completely with good cosmetic and functional effects [8]. The treatment choice is multifactorial. It depends on the lesion size, including the invasion depth, anatomical location, and clinical type of the tumor [9-11]. These parameters can be successfully assessed with HFUS skin imaging [6, 12-14].
In dermato-oncology HFUS can help with the following information:
tumor measurements and depth/level of invasion;
tumor contours and possible peritumoral infiltration;
guidance for skin biopsy;
clinical features indicating possible sub-type of NMSC;
support of optimal management and choice of treatment, e.g., non-invasive versus invasive;
post-treatment follow-up and diagnosis of early recurrences.
There are multiple studies in various skin pathologies comparing measurements taken during HFUS with those provided at pathological examination. Lassau et al. found a strong correlation between 20 MHz HFUS and pathology in measurements of melanoma thickness [15]. Guitera et al. described a high correlation of HFUS and histological Breslow thickness, with p < 0.001 [16]. Their measurements were highly reliable also for invasive melanoma and even in the presence of lymphocytic infiltration. Bobadilla et al. used HFUS instead of pre-surgical biopsy, and found similar high correlation in measurements of BCC thickness [17]. Some centers also use HFUS to guide their surgical management in order to assess not only the lesion itself, but also layers of involvement, vascularity patterns, and possible microsatellites, all by the means of non-invasive imaging [18]. HFUS has been also used to monitor treatment response, with some authors indicating a reduction in need for surgical removal of skin lesions post-topical treatment [19].
Various studies demonstrated the use of HFUS in differentiation of clinical forms of BCC. Wortsman et al. retrospectively analyzed HFUS of primary BCC tumors and compared with pathological outcomes [20]. The authors noted a statistically significant association between the number of hyperechoic spots in HFUS and histological sub-types of BCC. Higher hyperechoic spots count was found in the recurrence-prone micronodular, sclerosing variant, and morpheiform BCC sub-types. The presence and count of hyperechoic spots in BCC are considered as risks for a local BCC recurrence. Ultrasonographic features of superficial and nodular basal cell carcinoma were also analyzed and described [12-14, 20]. Below, there are examples of various BCC sub-types assessed by HFUS (Figures 7, 8).
Fig. 7
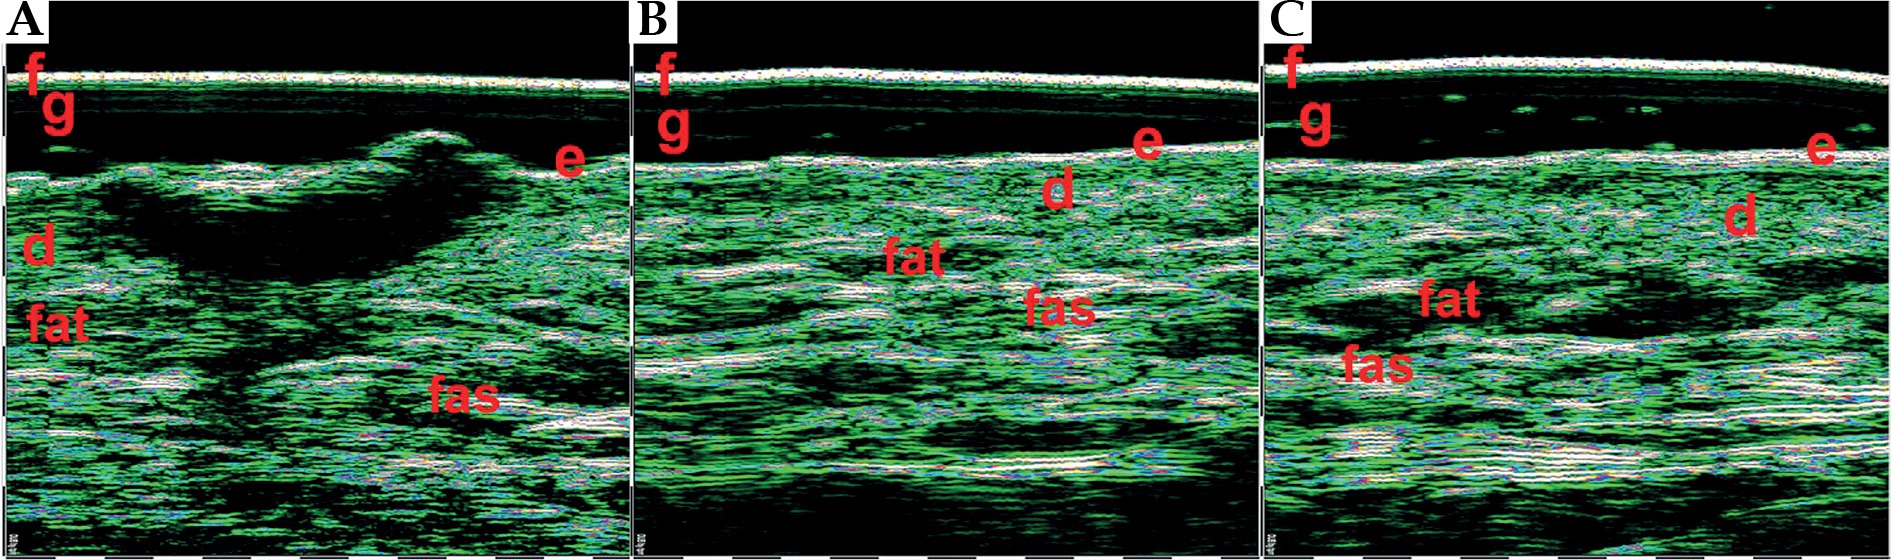
Superficial basal cell carcinomas (BCCs) 75 MHz HFUS. The hypo- and hetero-echoic areas of elongated strip-shape form located under epidermis, with distinct lateral and lower margins. f – foil on the probe tip, g – gel, e – epidermis, d – dermis
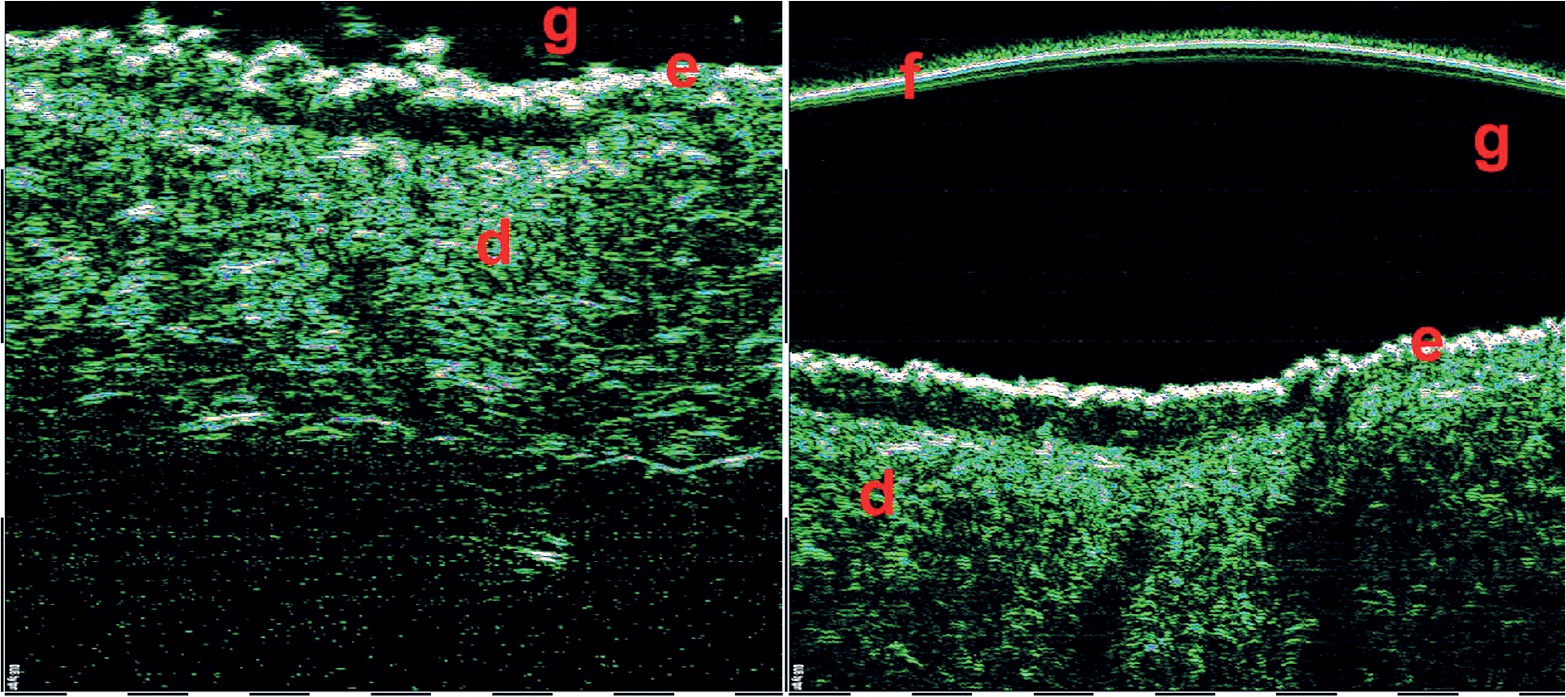
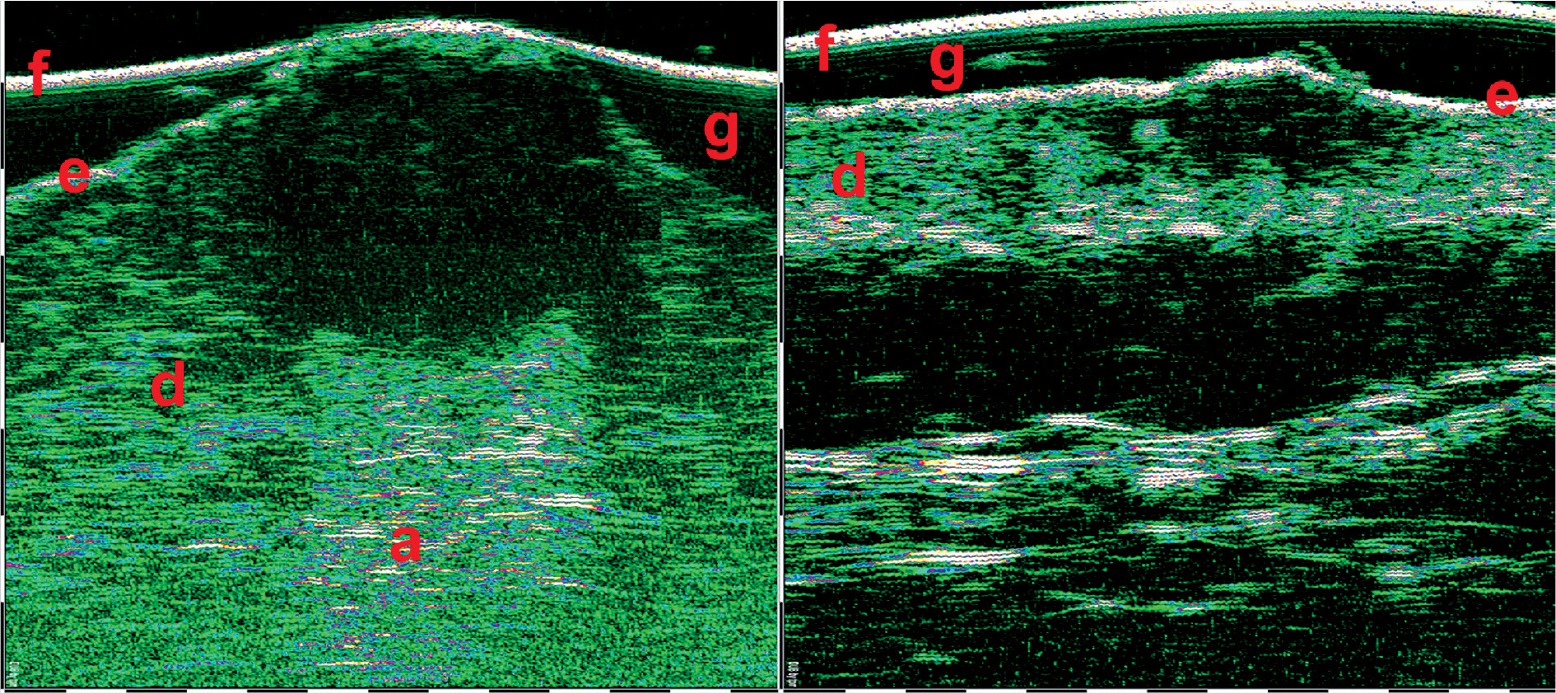
Fig. 8
Nodular basal cell carcinomas (BCCs) 33 MHz HFUS scans. The hypo- and anechoic zones of oval shape, with some hyper-echoic points (on the right scan) visible within the structure. f – foil on the probe tip, g – gel, e – epidermis, d – dermis. Nodular BCCs have much bigger size and depth, therefore 33 MHz range was used for visualization
HFUS can be also used in combination with video-dermoscopy in order to increase the accuracy of diagnosis [21]. Video-dermoscopy can help with clinical differentiation between benign and malignant skin tumours, while HFUS evaluates tumour margins and depth of invasion. Figures 9-11 show HFUS with correlating video-dermoscopy images in various BCC sub-types.
Fig. 9
Superficial basal cell carcinoma (BCC) 75 MHz HFUS scan (A) and video-dermoscopy (B). e – epidermis, d – dermis, 1 – video-dermoscopy image in normal light, 2 – video-dermoscopy image in polarized light
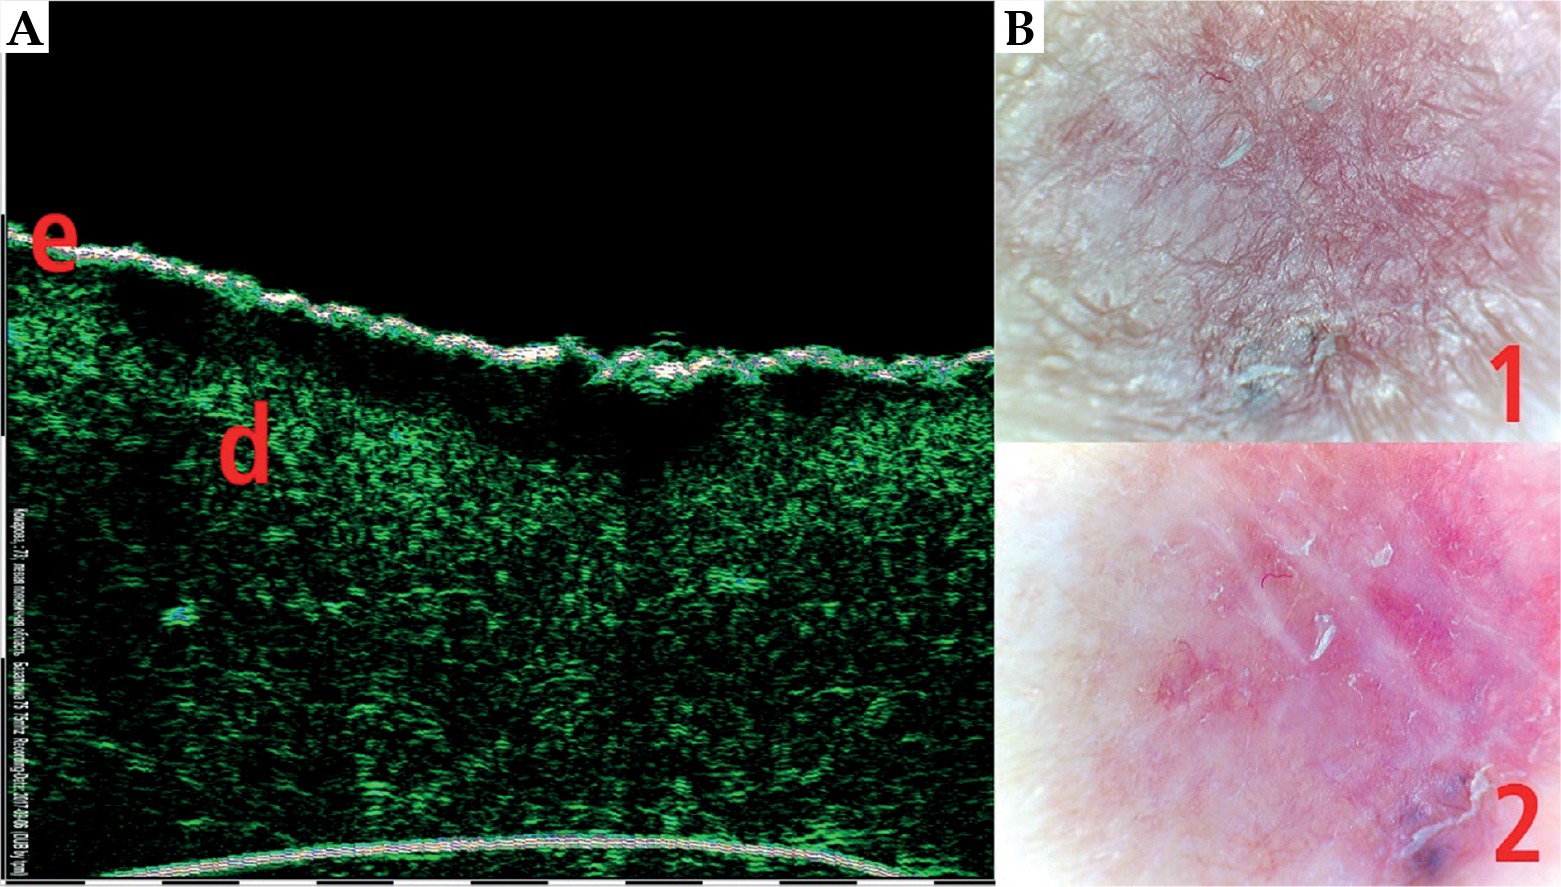
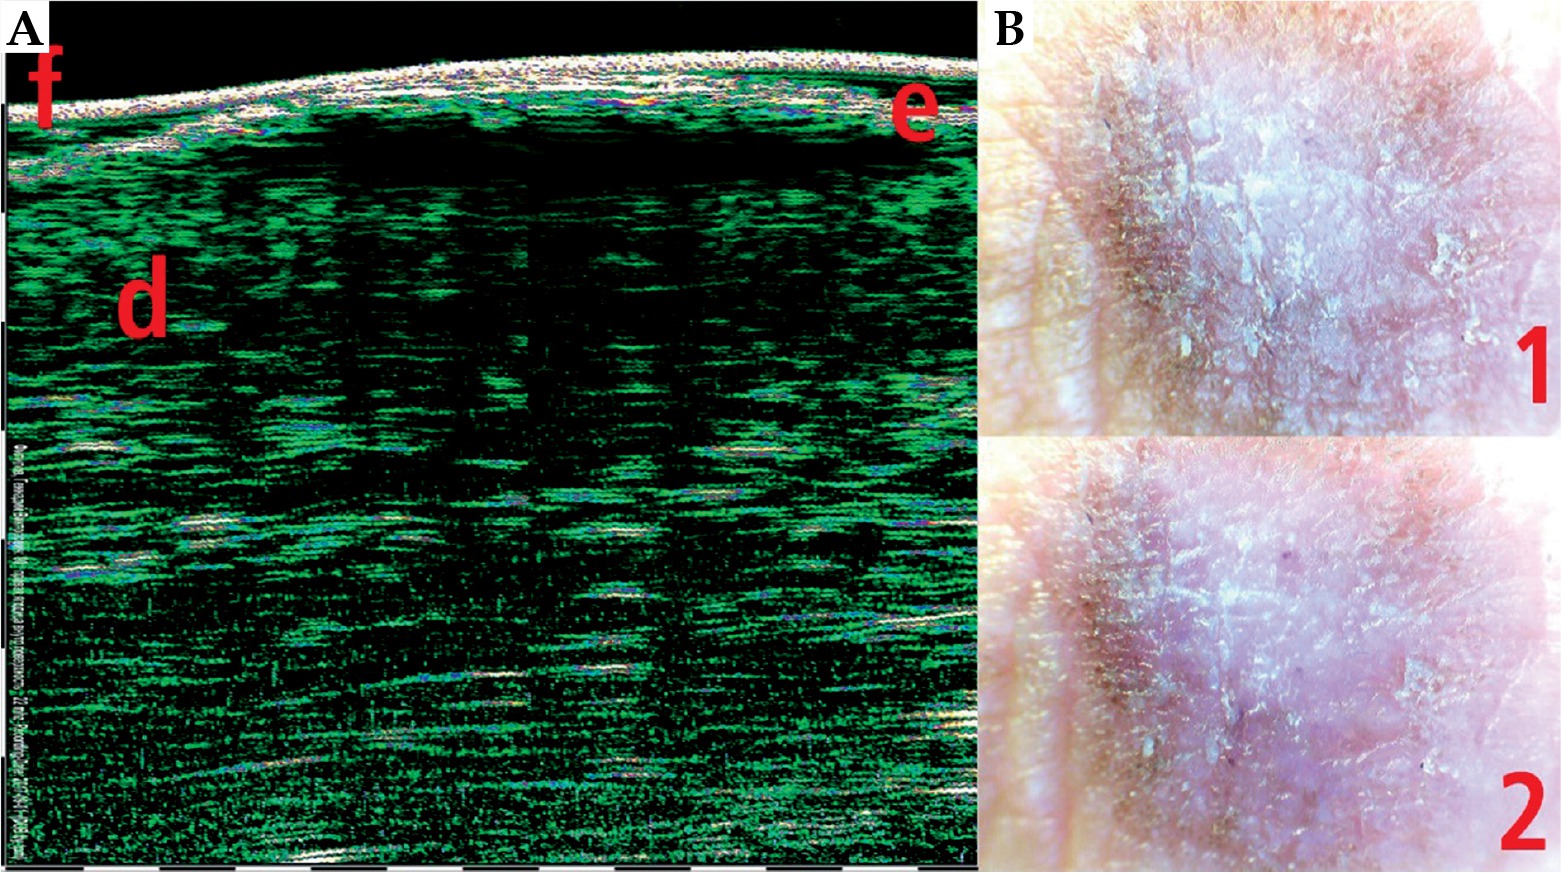
Fig. 10
Nodular basal cell carcinoma (BCC) 33 MHz HFUS scan (A) and video-dermoscopy (B). e – epidermis, d – dermis, f – foil on the probe tip, 1 – video-dermoscopy image in normal light, 2 – video-dermoscopy image in polarized light
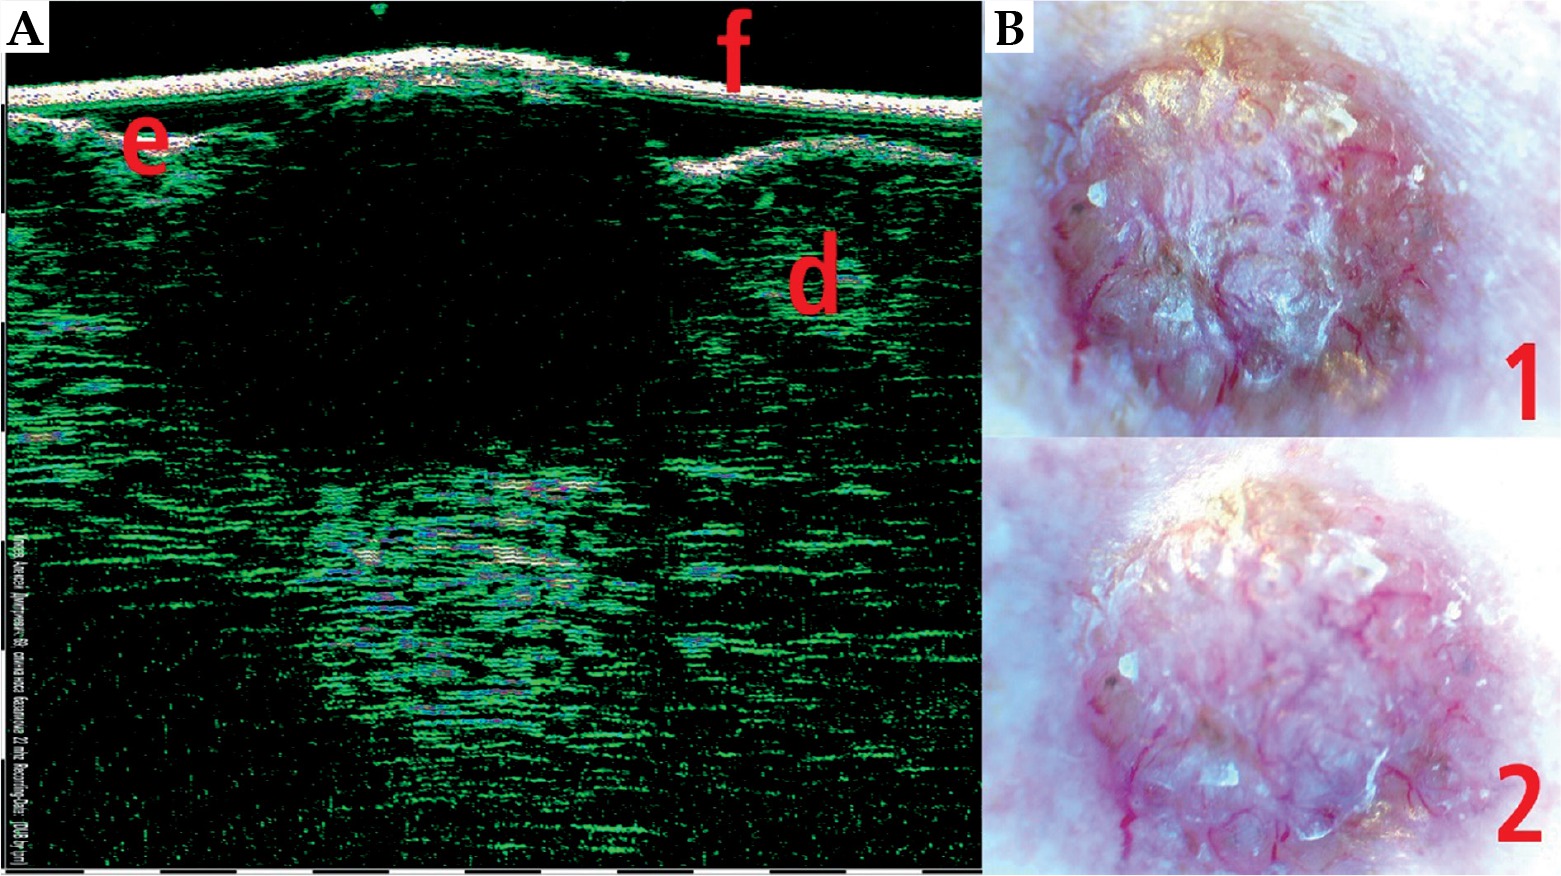
Fig. 11
Skin squamous skin carcinoma (SCC) 33 MHz HFUS scan (A) and video-dermoscopy (B). e – epidermis, d – dermis, f – foil on the probe tip, 1 – video-dermoscopy image in normal light, 2 – video-dermoscopy image in polarized light
In skin oncology clinics, HFUS can provide essential information on the tumor size and margins, particularly the depth of invasion. Such information are crucial in deciding on the form of treatment (such as photodynamic therapy, external beam radiotherapy, or brachytherapy), CT-based planning treatment (e.g., superficial brachytherapy), and in skin monitoring after treatment, in addition to clinical examination [22]. Figure 12 demonstrates HFUS of BCC skin lesion before and after photo-dynamic treatment.
Fig. 12
Skin basal cell carcinoma (BCC) HFUS scan before (A) and after (B) photo-dynamic treatment (curtesy of Mrs. Laura Foster, The Christie NHS Foundation Trust, Manchester, UK)
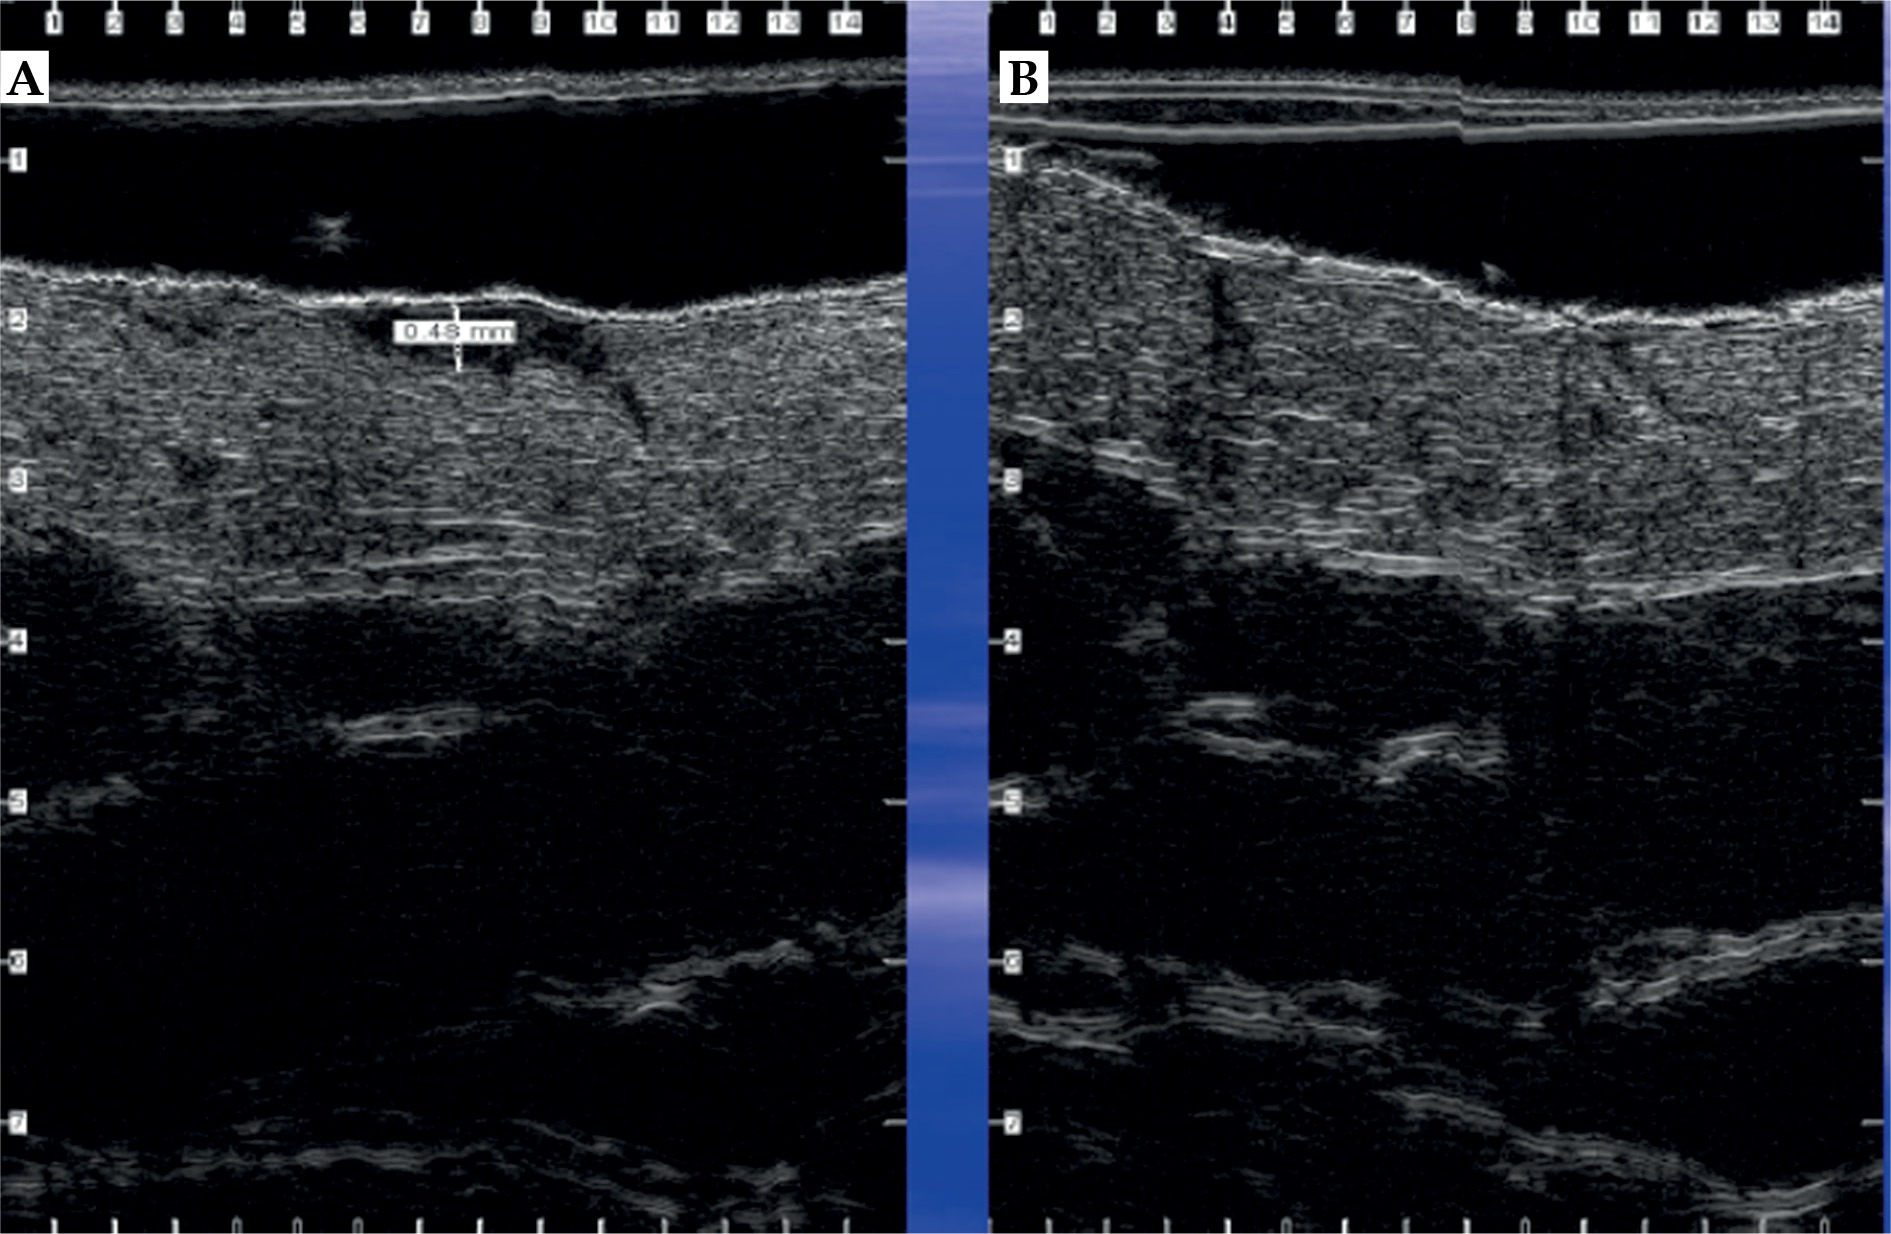
Figure 13 shows HFUS 22 MHz nodular ulcerated BCC scan before radiotherapy and 6 months after finishing the course of radiotherapy treatment. The tumor was visualized as oval-shaped hypo-anechoic area with clear lower and lateral margins, located in the dermis, with invasion depth of 1,670 µ, including deep reticular dermis. After radiotherapy, the scarring, dermis, and soft tissues atrophy were visualized. Dermis thickness decreased to 1,140 μ (1,680 µ in contralateral intact area), superficial sub-dermal fat layer also thinned to 400 µ (900 µ in contralateral intact area), and fascia pulled up in comparison with the contralateral intact area.
Summary
HFUS is a feasible and non-invasive imaging modality used to assess normal skin and its pathologies, including skin neoplasms. HFUS cannot replace histology but can potentially be used as an effective additional diagnostic tool in dermato-oncology. The tumor size, invasion depth, and margins character are the critical parameters for a surgery, radiotherapy, and brachytherapy planning. HFUS is used to identify high recurrence risk of basal cell carcinomas, which are important for the proper treatment choice. HFUS can also help clinicians to assess treatment response, and potentially identify an early recurrence before it can be detected during clinical examination; therefore, an earlier salvage treatment may be considered. HFUS has certain limitations, since this imaging as other US exams, is operator-dependent, and requires specific training and experience. Further studies are needed in order to fully understand the value of HFUS in skin radiotherapy and brachytherapy.


