
Summary
Three-dimensional modelling, virtual simulations and virtual reality have become more recognized in the field of interventional cardiology in recent years, especially in congenital heart defects. A few retrospective studies assessing the value of virtual simulations in intravascular treatment of aortic coarctation have been published, but none of them involves larger groups of patients. Our study shows that virtual simulations of stent implantation are a viable tool in predicting a range of potential stents that can be used during the procedure and the method could be used in planning those procedures.
Introduction
Aortic coarctation is a well-recognized congenital heart defect, diagnosed in about 3 per 10 000 live births and representing 3–8% of all cases of coronary heart disease (CHD) in its isolated form [1, 2]. The lesion is most commonly associated with the bicuspid aortic valve, but may also coexist with patent ductus arteriosus, ventricular or atrial septal defects and as a part of more complex anomalies such as double-outlet ventricles, discordant atrioventricular connections and others [3–5].
Aortic coarctation in children is managed either by primary surgical repair, which is a standard in neonates and infants, or percutaneous treatment using balloon angioplasty without or with stent implantation, the latter of which has become a gold standard in management of the lesion in older children [5–7].
Usually the interventional treatment of aortic coarctation is planned based on pre-procedural computed tomography (CT) and intraprocedural angiography. The data from CT scans can be used to produce a 3D printed model of the aorta in order to plan more complex procedures [8–10]. Virtual reality has also been implemented in assessment of patient-specific anatomy in congenital heart disease [11–13].
Aim
The aim of our study was to assess whether simulations of stent implantation in virtual models can be used for planning intravascular treatment of aortic coarctation. Our main objective was to compare the selection and positioning of stents made during the actual procedure with the simulations based on virtual models, which were assessed in virtual reality.
Material and methods
Material
The study involved 20 CT scans performed prior to the percutaneous treatment of aortic coarctation, obtained from the heart catheterization laboratory as a source material for creating virtual models. Only patients treated with interventional stent implantation and having a high quality CT scan, allowing for proper creation of a model, were included in the study. Interventional treatment was performed according to commonly accepted criteria [7].
In the selected group 14 patients presented with primary aortic coarctation, 2 with aortic coarctation after surgical treatment of hypoplastic left heart syndrome, 1 with post-surgical recoarctation, and 3 with restenosis either in the implanted stent or above it. Angiographies performed during stent implantation were used in order to compare the measurements and stent location.
Methods
Imaging studies and measurements
Each patient had a CT scan (using Siemens SOMATOM Definition Flash) performed prior to the interventional treatment of aortic coarctation. The CT scan was used as a source material for creating a virtual model of the aorta, as well as for measuring the stenotic segment. The measurements involved the diameter of the aorta superior and inferior to the stenosis and the length of the narrowed segment. Corresponding measurements were also performed for comparison in angiography and the source CT scan after the simulation was assessed.
Producing a virtual model
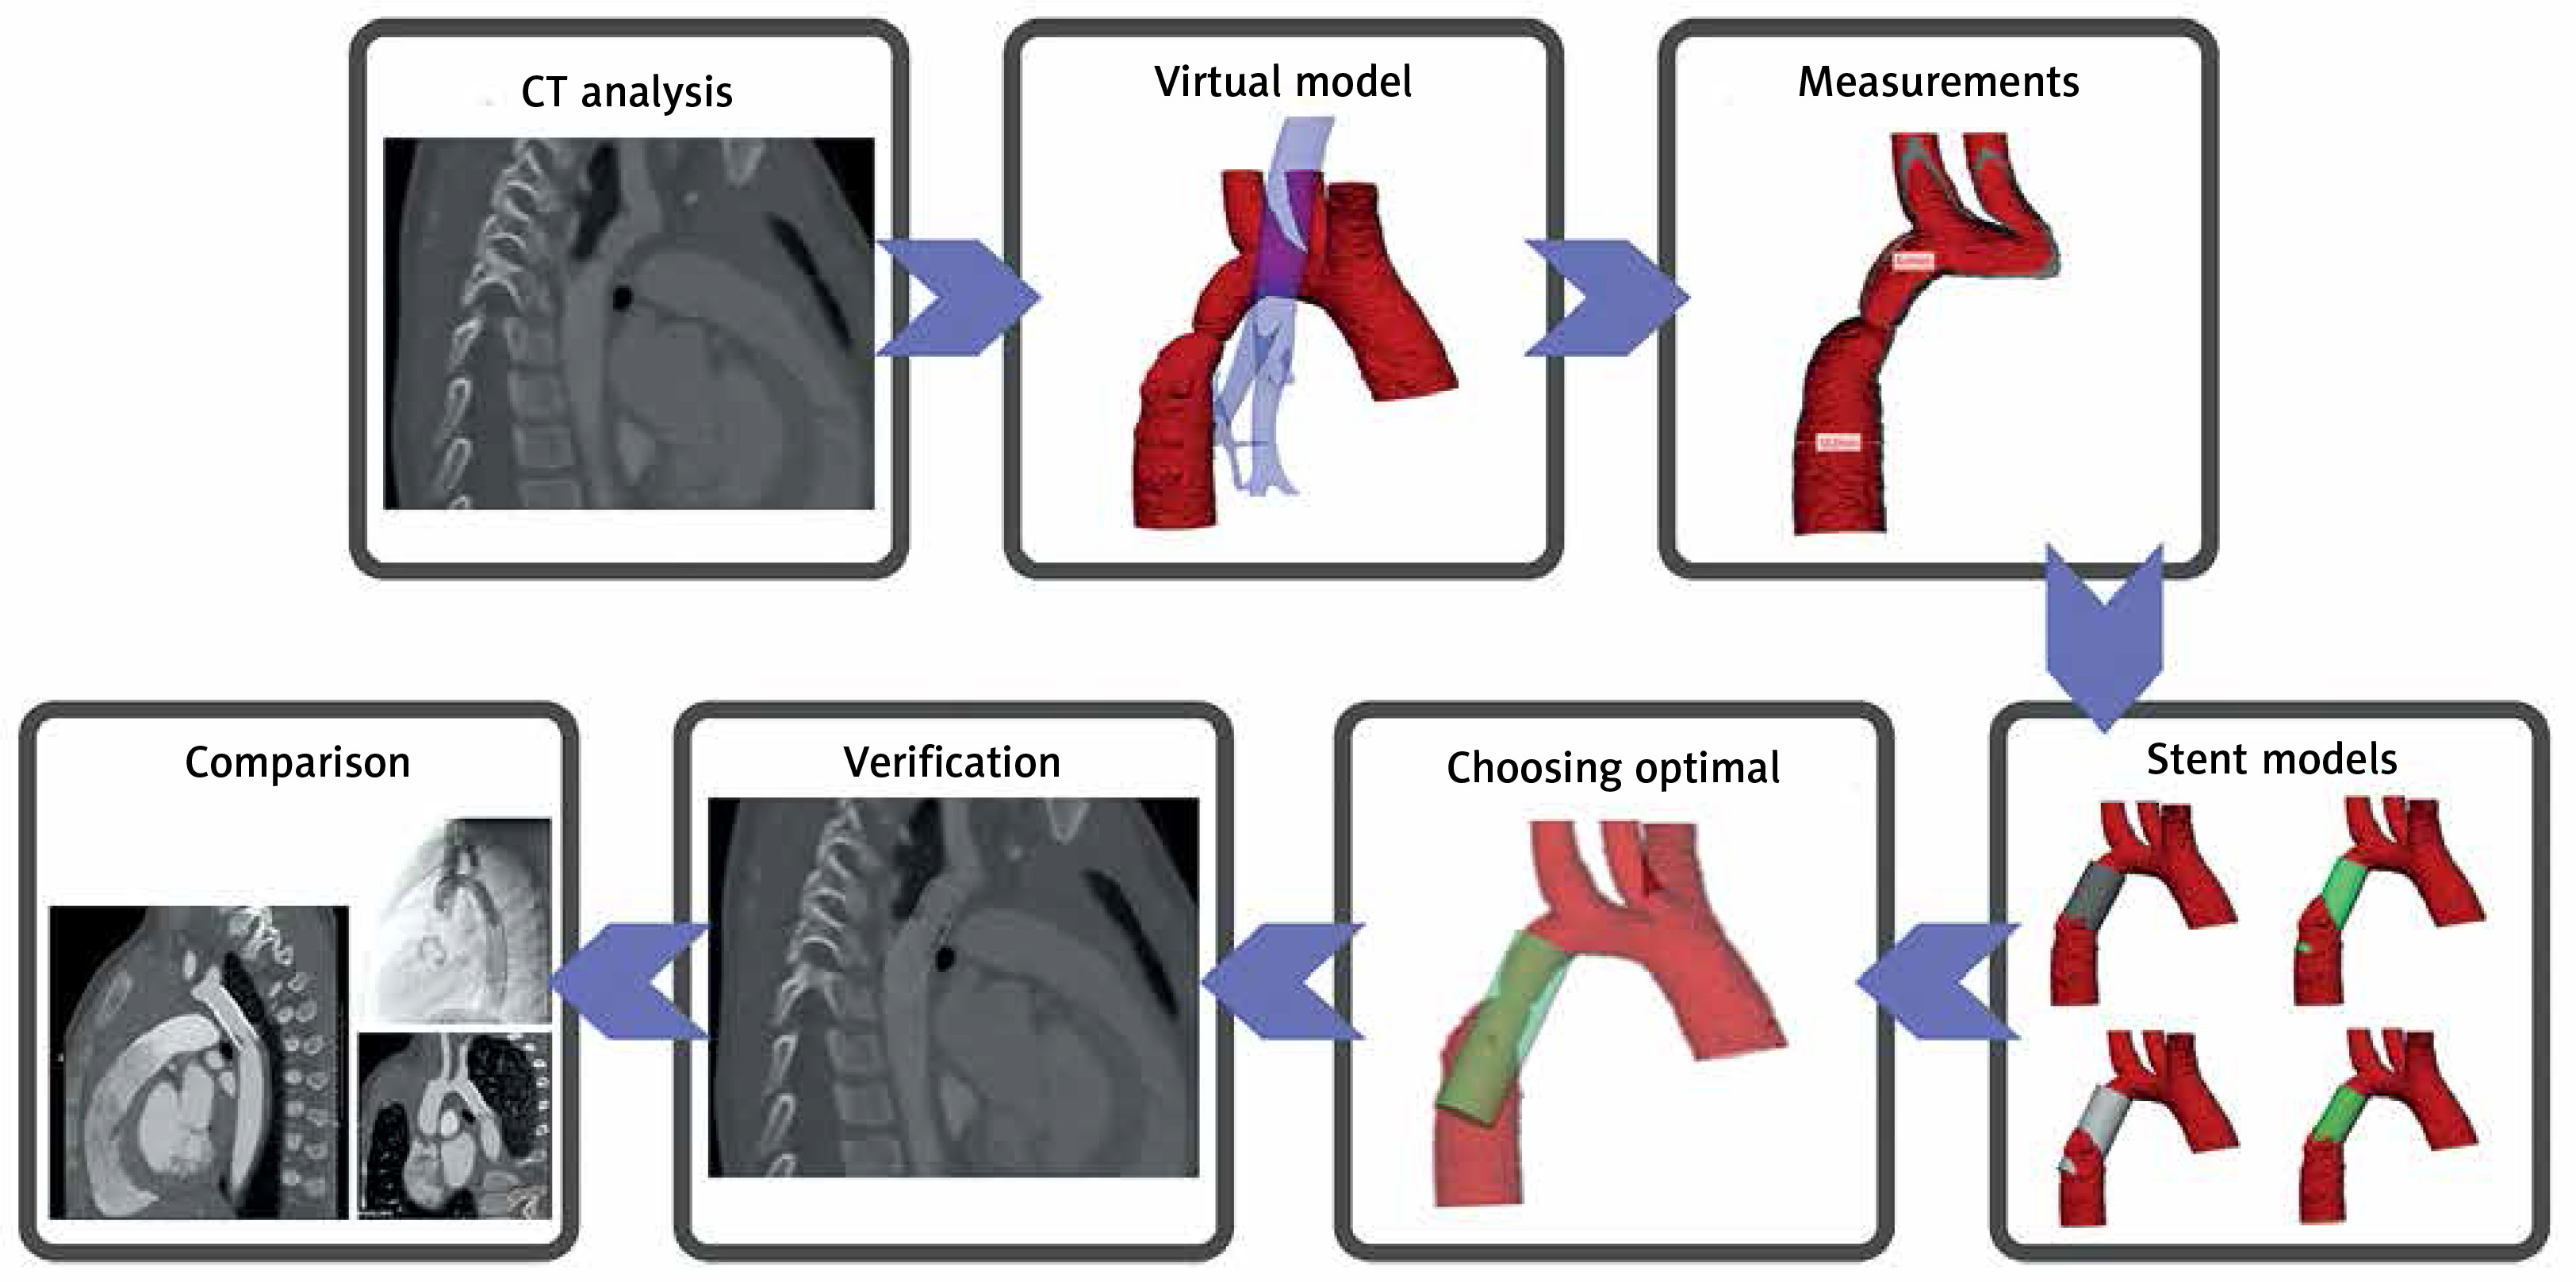
CT scans were processed in Materialise Mimics in order to produce a virtual three-dimensional model of the narrowed aorta, the trachea and the main bronchi. The models were subsequently exported to Materialise 3-Matic, in which, based on the measurements taken on the model, a group of possible stents was simulated. The complete model of the aorta, airways and stents was then exported back to Materialise Mimics, in which a preliminary analysis was performed – this included verification of the model’s borders and initial assessment of the stents’ location.
Stent selection
Only the stents that were most often used in our institution at the time of the study were included in the simulations. These include Cook Formula 535, Bentley BeGraft Aortic Stent Graft, NuMED Covered CP Stent, NuMED Bare CP Stent and BD LifeStream Balloon Expandable Vascular Covered Stent. The stents were modelled as cylinders with dimensions corresponding to the chosen group of devices. During model creation longitudinal shortening of the stent was taken into consideration based on official data published by the manufacturer. All results regarding stents with considerable changes in length apply to these values.
The complete models were assessed by both main researchers in Mimics Viewer using a virtual reality headset (Oculus Quest I) in order to choose an optimal stent. The analysis involved the construction of the stent (covered and bare), its position in the aorta and spatial relations to the airways. Each of the main researchers independently proposed one stent model per patient and in cases where different stents were selected, the authors discussed both models and an optimal one was chosen.
The optimal model was compared with the device used to treat the patient based on the angiography performed during the procedure. The comparison involved the manufacturer and model of the stent, type of stent (bare or covered), its dimensions and the relation to the subclavian artery, as it was chosen to be the most reliable way to compare the location of the stent’s proximal end. A diagram showing the complete method can be seen in Figure 1.
Results
In all of the 20 CT scans a model of the aorta involving a range of potential stents was created. The number of stents proposed by the researchers ranged from 1 to 6. Table I shows proposed and implanted stents’ dimensions and their relation to the left subclavian artery.
Table I
Comparison of proposed and implanted stents (mm)
Diameter
Diameter ratio of the proposed to implanted stent was calculated. A stent with identical diameter was chosen in 11 (55%) cases and in further 9 (45%) cases the proposed to implanted stent diameter ratio ranged from 111% to 143% (mean 120%, mode 120%). In all of aforementioned 9 cases proposed stents were wider than implanted ones, but with diameter difference not exceeding 2 mm.
Length
As the dimensions of stents produced by different manufacturers vary mainly in length, only in 4 (20%) cases was a stent with exactly the same length proposed. In 13 cases the proposed stent was shorter than the one actually used and in the remaining 3 cases, the proposed stent was longer. The length ratio of the proposed to implanted stent was calculated. In total, 11 cases presented a length difference no higher than 20%, in 6 cases the proposed stent was considerably shorter (48 to 79.9% of the implanted stent length) and in 3 cases it was longer (120 to 136.4% of the implanted stent length).
Relation to the subclavian artery
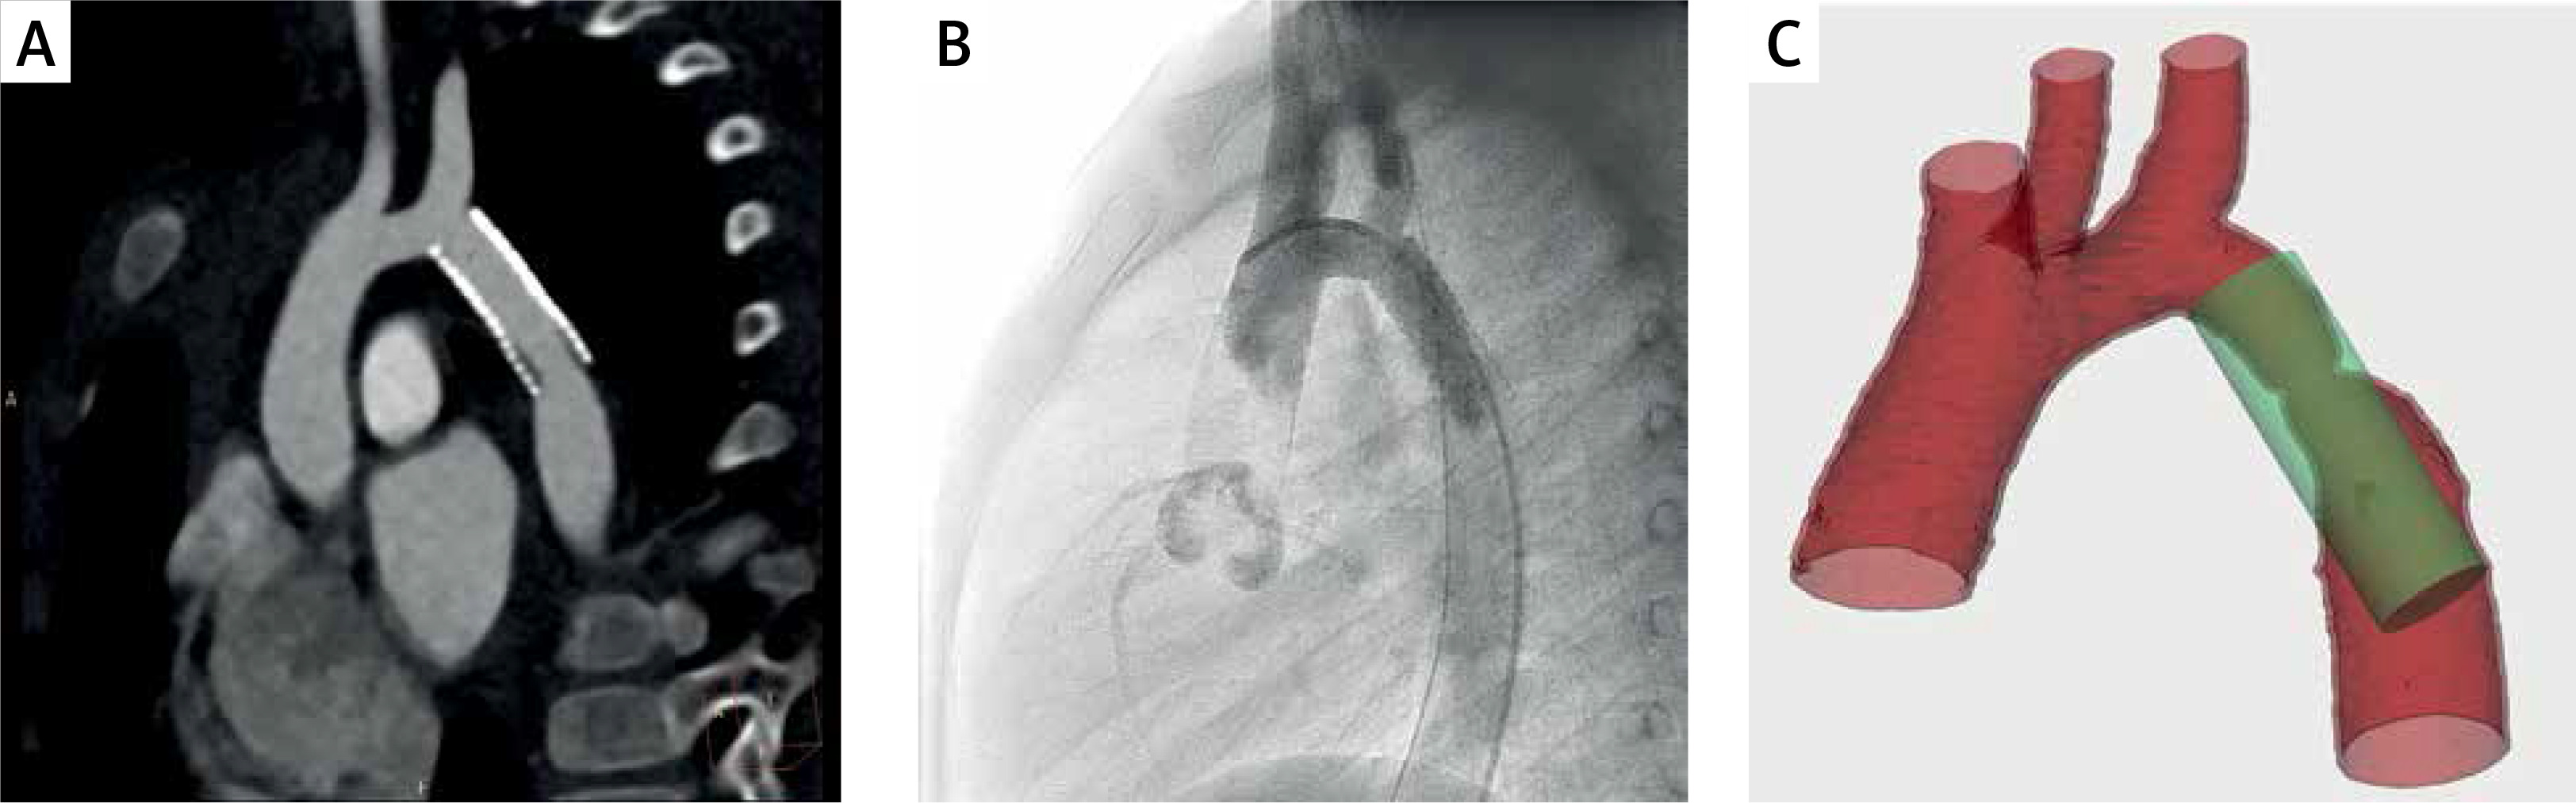
The subclavian artery was present in 19 of the cases and in the remaining 1 case it was absent due to a previous Waldhausen procedure; thus the relation to the left common carotid artery was identified. The proposed and actual stents were divided into three groups depending on the location of the stent’s proximal end – it was either below, above or at the level of the subclavian artery ostium. In 14 (70%) cases the proposed stent fell in the same group as the implanted one. In the remaining 6 cases, the simulated stent was located more distally than the actual one. A comparison of the model with the patient’s CT and angiogram showing the relations to the subclavian artery ostium can be seen in Figure 2.
Stent type and manufacturer
In 18 cases a stent with the same construction type was chosen – 11 bare stents and 7 covered. In one of the remaining cases the researchers proposed a covered stent while a bare one was used in the procedure and in the second case a bare stent was proposed while a covered one was implanted. The choice of stent manufacturer and model presented more considerable differences, as only in 7 cases was the same model chosen.
Complete comparison
In order to determine whether the researchers’ predictions were accurate, the cases were divided into groups based on the comparison of the diameter and length with subsequent addition of the stent’s location criterion (Table II).
Table II
Division of stents into groups based on simulation accuracy
| Length | Equal | Difference less than 2 mm |
|---|---|---|
| Equal | 3/2 | 1/1 |
| Difference less than 20% | 2/2 | 5/4 |
| Difference over 20% | 6/4 | 3/1 |
The first group consisted of stent simulations with identical diameter and identical or slightly different length. In 4 out of 5 cases in this group the location of the stent’s proximal end was concordant with the actually implanted one. These simulations were considered as optimal, with slight differences being nearly independent of human error.
The second group consisted of stent simulations with identical diameter, but a considerable difference in length (exceeding 20%), as well as stent simulations presenting a different diameter and equal length or difference in length not exceeding 20%. In 9 out of 12 cases in this group the location of the stent’s proximal end was concordant with the actually implanted one. These simulations were considered suboptimal, but possessing potentially avoidable estimation or judgement errors, the latter of which is further emphasized by the fact that the researchers modelled the stent actually used to treat the patient in 3 cases and in 1 case a very similar device was considered. In all four of these simulations the relation to the subclavian artery was concordant with the procedure, yet for some reasons the researchers chose another stent as optimal in their opinion.
The third group consisted of stent simulations with different diameter and length difference exceeding 20%. In 1 out of 3 cases in this group the location of the stent’s proximal end was concordant with the actually implanted one. This group is represented by cases 1, 10 and 15 (Table I) – in the first two it can be seen that, although differences in length exceed the predetermined 20% limit, they are not drastically different (23% and 33%). The third simulation shows a larger difference as the age of the patient was not taken into consideration during stent selection. The errors in this group, albeit larger than in the previous one, are still avoidable.
Due to diameter differences in 9 cases, a series of measurements was performed in order to identify the reasons for suboptimal suggestions of stents. The diameter of the aorta was additionally measured in the base CT scan and in intraprocedural angiography, showing that the diameter measured in the models was greater than in angiography by a mean value of 1.17 mm (1.08 mm superior to the stenotic segment and 1.25 mm inferior to it). This overestimation was present in 15 (75%) measurements superior to the coarctation and in 16 (80%) measurements inferior to it. The differences between the model and the base CT scan are considerably smaller, the mean underestimation in the model being 0.03 mm.
Discussion
Relation to previous research
Various three-dimensional techniques have been tested and used in order to simulate and plan percutaneous treatment of aortic coarctation. The most often implemented method is a three-dimensional printed model, which has consistently been used for planning both surgical and interventional treatment of congenital heart defects [14–17]. Printed models have also been used in planning intravascular and surgical treatment of complex cases of aortic coarctation [8–10, 18] with good results, yet it is important to understand the limitations of the method, mainly the time and money required to print a model – this may explain why no study involving larger groups of patients can be found.
The cost and time ineffectiveness of three-dimensional printing has shifted the research towards using virtual models for mathematical simulations of blood flow and simulating procedures. Gosling et al. [19] performed virtual simulations of interventional treatment of coronary stenosis using models based on coronary angiograms. In their study virtual fractional flow reserve was calculated on the model with a simulated stent and was later compared to the intraprocedural fractional flow reserve of the treated artery, presenting a mean difference of 0.01 ±0.03.
Computational fluid dynamics is another tool which has been used for analyzing and planning the treatment of aortic coarctation. A study by Ralovich et al. [20] suggested that computational fluid dynamics can be successfully used to predict the post-treatment pressure in the aorta both using post-procedural imaging and virtual stenting – the latter providing an error of 4.99 ±3.00 mm Hg, which is a promising result regarding our future studies. Analogous results were obtained by Goubergrits et al. [21], who performed similar calculations based on MRI and post-procedural angiography, presenting a difference between simulated and catheter-measured pressure drop in the aorta of 3.0 ±2.91 mm Hg. Armstrong et al. [22] conducted a similar study, using computational fluid dynamics to analyze 3 cases, in which the researchers modelled the aorta to simulate post-stenting anatomy.
Although a number of papers on using both printed and virtual 3D models in analyzing aortic coarctation have been published, none of them assesses virtual modelling as a planning tool in a blind retrospective analysis.
Our research shows that a simple simulation performed in a relatively short time could potentially be a viable tool for planning percutaneous treatment of aortic coarctation, especially in the hands of more experienced personnel.
We have opted for the use of virtual reality rather than on-screen three-dimensional models due to our opinion that performing spatial operations, such as rotation, zooming and sectioning, is more intuitive and faster using virtual reality than two-dimensional representations of three-dimensional models.
Reasons for inadequate stent selection
The reasons for differences between the proposed and actually used stents can be divided into a few categories. The first and most obvious ones are human-related errors and misestimations.
In our opinion the most important human-related reason for proposing inadequate stents, especially regarding their diameter, was the interpretation of stent models. As the stent was chosen by the researchers, its position in the aorta was assessed on sections in both the short and long axis. Due to the lack of modelling of the stent and its curve to the aortic wall, protrusions and areas of poor match could be found. These artefacts may have led to improper discarding of stents with less than optimal conformation in the aorta. On the other hand, the researchers decided not to manually model the stent’s curve to fit properly into the aorta, as the method was not reproducible and could lead to considerable bias in proposing and choosing stents.
The second reason for inadequate stent proposals were differences in measurements performed in the model and in intraprocedural angiography. This overestimation may explain why the researchers tended to propose equal or wider stents than actually implanted.
Another potential reason for the tendency to propose wider stents than actually implanted was lack of information about the diameter of the vascular access, which therefore was not considered in the process.
The last reason for differences in the proposed and used stents is the availability of certain stents in our institution at the time of the procedure. The research included only a limited number of stent manufacturers, which are currently most often used in the catheterization laboratory, but as the patients involved in the study have been treated since 2016, different stents which were available at the time of the procedure were used and those were not necessarily the ones the research involved. Due to this, lengths of the proposed and implanted stents differ in a number of cases, although the diameters are more consistent. This can be explained by the fact that stents of different manufacturers usually cover identical sets of diameters, but have different lengths.
Identifying reasons for inadequate stent positioning is more challenging. Six of our stent models were positioned discordantly with the actual procedure and in all of these the modelled stent was positioned inferior to the actual one. This probably reflects the personal experience and preferences of the researchers, as well as the limitation of the method, being the straight, cylindrical shape of the stent model, which if placed higher would often protrude from the infrastenotic segment of the aorta. This may lead to improper discarding of potentially optimal stents, which in reality could conform to the shape of the aorta in a more natural way. The problem is visible especially in longer stents, stents that completely cover the subclavian artery ostium and in patients presenting more pronounced curvature of the stenotic segment.
Although our results are promising, it is crucial to understand the limitations of the method, most importantly that currently it does not include any type of modelling of the shape of the stent or the aorta, nor does it include hemodynamic calculations allowing predictions of pressure gradients after the procedure. These functions can potentially be incorporated into the method in future, providing researchers and clinicians with more objective and unbiased analysis tools.
Conclusions
Our research has shown that using computer simulations and models could be a viable tool for predicting a range of possible stents to treat patients with aortic coarctation. Using virtual simulations saves a considerable amount of time required to print a physical model and is more cost-effective, as no printer or materials are required. The authors also consider virtual reality to be an efficient, fast and easy-to-learn tool for model assessment.
The experience provided by this study should help to avoid the aforementioned reasons for inadequate stent selection, which in time may lead to wider application of the method in planning intravascular treatment of aortic coarctation.


