
Purpose
Electronic brachytherapy (eBT) belongs to a group of treatment modalities, which use ionizing radiation to achieve therapeutic effect. Contrary to high energy of particles used in the currently well-established teletherapy, eBT devices utilized in contact therapy or intra-operative radiotherapy, generate low-energy X-ray radiation (< 100 keV, typically ≤ 50 keV). The eBT devices provide an alternative for radionuclide brachytherapy, where high-dose-rate afterloading systems with iridium-192 (192Ir) radionuclide or low-dose-rate seeds, e.g., iodine-125 (125I), are used. Lower energies and the possibility to turn the eBT source off, reduce the requirements for shielding of surrounding environment during treatment, transportation, and maintenance as well as decrease personal dose to operators [1, 2] and increase radiobiological effectiveness [3, 4].
Several eBT devices are available on the market, including INTRABEAM® (Carl Zeiss Surgical, Oberkochen, Germany), Xoft Axxent® system (iCAD Inc., Nashua, USA), ioRT-50 (formerly by WOLF-Medizintechnik GmbH, now Eckert & Ziegler), Esteya® eBT system (Elekta AB-Nucletron, Stockholm, Sweden), photoelectric therapy (Xstrahl Ltd.), SRT-100 (Sensus Healthcare), and Papillon 50 and Papillon+ (both by Ariane Medical Systems Ltd., United Kingdom). A thorough review of eBT treatment modalities is shown in Eaton study [1].
Dose prescriptions of eBT systems are solely based on vendor-supplied dose maps, which rely on individual calibration tools and procedures developed by the vendor, because primary laboratories do not provide absorbed dose to water calibrations for eBT. Each manufacturer uses its preferred dosimetry system, which is typically aligned with recommendations for dosimetry of low-energy X-rays provided in the IAEA TRS 398 [5], AAPM TG report 61 [6], IPEMB code of practice [7], German standard DIN 6809-4 [8], or a modified TG-43 dose calculation protocol [9]. Most systems, however, suffer from lack of dosimetric data independent of the supplier. Metrological traceability is needed here, which would improve the confidence in eBT dosimetry.
A three-year joint research project, named “Primary standards and traceable measurement methods for X-ray emitting electronic brachytherapy devices” (18NRM02 PRISM-eBT), was funded in 2018 by the European Metrology Program for Innovation and Research (EMPIR), and ended in 2022. The project objectives included defining primary standards for absorbed dose to water by eBT devices at 1 cm depth of water, establishing a dosimetric methodology for superficial eBT, characterizing detectors for measurement of 3D dose distributions and ensuring traceability for 3D dose distribution eBT dosimetry. Precise dosimetry of such low-energy photon fields requires the knowledge of either the photon fluence spectrum emitted by an eBT device or the photon fluence spectrum at the point of measurement. The spectra are required, for example, in correcting for the energy dependence of detectors or in traceable dosimetric studies with the respective eBT device [10, 11]. The project also generated a catalogue of eBT X-ray spectra gathered from literature or obtained during the project [12].
This paper provided the energy distribution of photon fluence generated by the eBT device Papillon 50, measured in air with a cadmium telluride semi-conductor spectrometer. There is another study on Papillon 50 [13] showing the measured spectrum. Also, a comparable study by Gérard et al. [14] reported additional spectra acquired with Papillon 50 applicators. However, the current paper goes beyond these results, delivering fluence spectra with low statistical uncertainties and measured close to the source and at different angles. The photon fluence spectrum was one of the basic parameters of X-ray beam, allowing for computation of dosimetric quantities and correction factors, or to be an input for Monte Carlo calculations.
Material and methods
Papillon 50
Papillon 50 is an electronic brachytherapy medical device manufactured by Ariane Medical Systems Ltd., United Kingdom, designed to deliver rectal cancer treatments [14]. It consists of an electron accelerator providing electrons with a nominal energy of 50 keV, which impinge on a thin transmission rhenium anode (Re, atomic number 75), and generate bremsstrahlung and characteristic photons. Inside the device, in the direction of original electron beam, photons pass through flattening filter and monitor chamber before they reach the exit window. The distance from the anode to the exit window is 13.5 mm. The output photon beam can be limited by cylindrical stainless-steel applicators [14] enclosing an anode at the side to provide a fixed opening angle of 45°. A detailed schematic of the distal part of X-ray source is presented in [14], while the schematic geometry with the applicators attached is provided in [13].
For the current study, the measurements were performed with the Papillon 50 unit installed at the Aarhus University Hospital, Denmark. Three straight applicators with nominal inner diameters of 22 mm, 25 mm, and 30 mm were employed.
Detector
Measurements were performed using a compact commercial semi-conductor detector X-123CdTe (AMPTEK, Inc., USA) [15] (Figure 1). This instrument allows to perform mobile in-beam X-ray spectrometry in laboratory and clinical conditions. Its sensor is made of a rectangular 3 mm × 3 mm × 1 mm (width, height, thickness) cadmium telluride (CdTe) crystal mounted onto a two-stage Peltier thermo-electric cooler, which decreases the sensor temperature to 220 K to reduce thermal noise, enabling an increased high voltage bias [16]. A bias of +950 V was applied in measurements. A 100 µm thick beryllium window allowed the detection of photons with energy >~ 4 keV. A stainless steel EXVC collimator [17] with an inserted variable set of tungsten collimation discs provided by the detector manufacturer, was fixed in front of the sensor to control the measured count rate. In the center, each disc had a laser-cut aperture of different diameter. The purpose of the discs was to further decrease photon flux at the sensor. The nominal aperture diameters were 100 µm, 200 µm, 400 µm, 1 mm, and 2 mm, while the thickness of the discs was 2 mm. A set of three discs with sequential aperture diameters was always inserted inside the collimator body from its front, and positioned close to the sensor. A disc with the smallest aperture diameter was placed closest to the sensor.

The detector was connected to a measuring computer with an Ethernet cable, and controlled by means of a DppMCA digital acquisition software [18] provided by the detector manufacturer. More details on the detector, its energy calibration, pile-up correction, and other characteristics are given in [19, 20].
Measurement setup
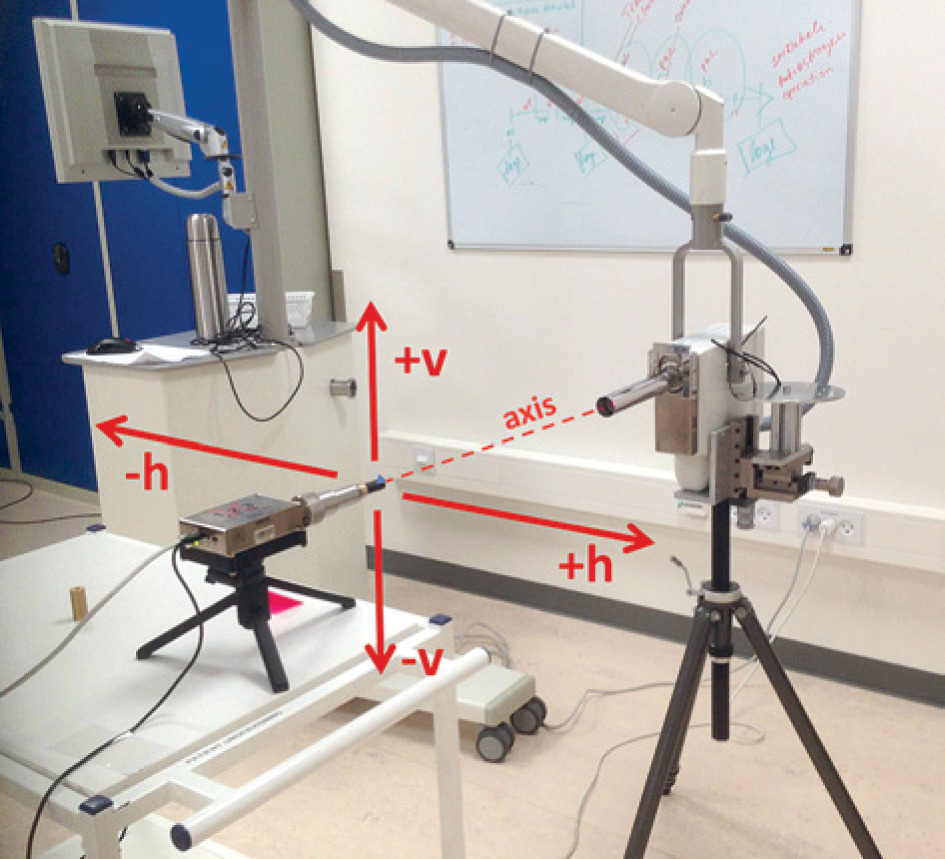
Measurements were performed at a distance of 52 cm between the front surface of detector collimator and exit window of X-ray tube (Figure 2) at several angles between the X-ray tube axis and detector axis: in the horizontal plane 0°, +5°, ±10°, +15°, ±20°, +22.5°, +25°, +30°, and in the vertical plane ±10° and ±20°. Figure 2 shows sign denotation. The detector axis always pointed towards the center of X-ray tube’s exit window. The alignment was set up with a dedicated laser pointer inserted into the steel collimator body.
Fig. 2
Measurement setup and description of coordinate system. h and v are horizontal and vertical planes, respectively
The detector count rate was kept between 12,000 and 20,000 counts/s, achieved by a set of collimation discs with suitable aperture diameters. A set containing a disc with the smallest aperture diameter of 1 mm, 400 µm, and 100 µm was used at +30°, +25° angles and at all other angles, respectively. Nearly all detected counts were generated by photons entering the detector through the collimation disc aperture. When the collimator was blocked with a beam stopper made of tungsten rod, the count rate decreased to 0.025 counts/s, i.e., by 6 orders of magnitude, suggesting that the sensor was fully shielded against radiation scattered in the room and in the steel collimator body.
The measurements were performed with 22-mm, 25-mm, and 30-mm diameter cylindrical applicators attached to X-ray tube. Measurements with naked tube, i.e., without any applicator, were not performed. The electron current was set to 2.7 mA. The beam-on time was limited to about 2 min per one measurement due to safety restrictions in the Papillon control software, preventing overheating of X-ray tube and attached applicator, which could cause burns to the patient if used during treatment.
To evaluate consistency and reproducibility, repeated measurements were performed on a beam axis with 22-mm and 30-mm applicators attached.
Fluence spectra unfolding
Photon fluence spectra were obtained from the measured detector spectra using an unfolding procedure GRAVEL (GRV_MC33) developed at Physikalisch-Technische Bundesanstalt (PTB), Germany [21]. The procedure was implemented into a MATLAB script that prepared input data, called the GRAVEL procedure, and evaluated the unfolded spectrum. The algorithm employed a detector response matrix obtained with Monte Carlo (MC) simulations for a detailed and validated MC model of spectrometer. More information on the unfolding process can be found in Šolc et al. [20].
Dosimetric quantities
Dosimetric quantities specifying the spectra are valuable for metrological characterization of measuring instruments intended to be used for measurements in these photon fields. The spectra were described by means of mean energy [22] (equation (1)), EmeanF, mean energy weighted by air kerma (equation (2)), EmeanK, half-value layer (HVL) in aluminum [23] (equation (3)), and homogeneity coefficient (HC) (equation (4)):
Φ(En) is the fluence of photons with energy En,
Results and Discussion
Measured spectra
The examples of the detector spectra measured on the X-ray tube axis and at +25° off the tube axis are shown in Figure 3. The latter angle approximately corresponded to the penumbra of the beam profile restricted by the applicator attached to X-ray tube. The end-point energy was marked on the figures.
Fig. 3
Examples of measured and pre-processed measured detector spectra. Green – raw measured; Red – smoothed and rebinned; A) Spectrum on X-ray tube axis; B) Spectrum at angle of 25° off the axis
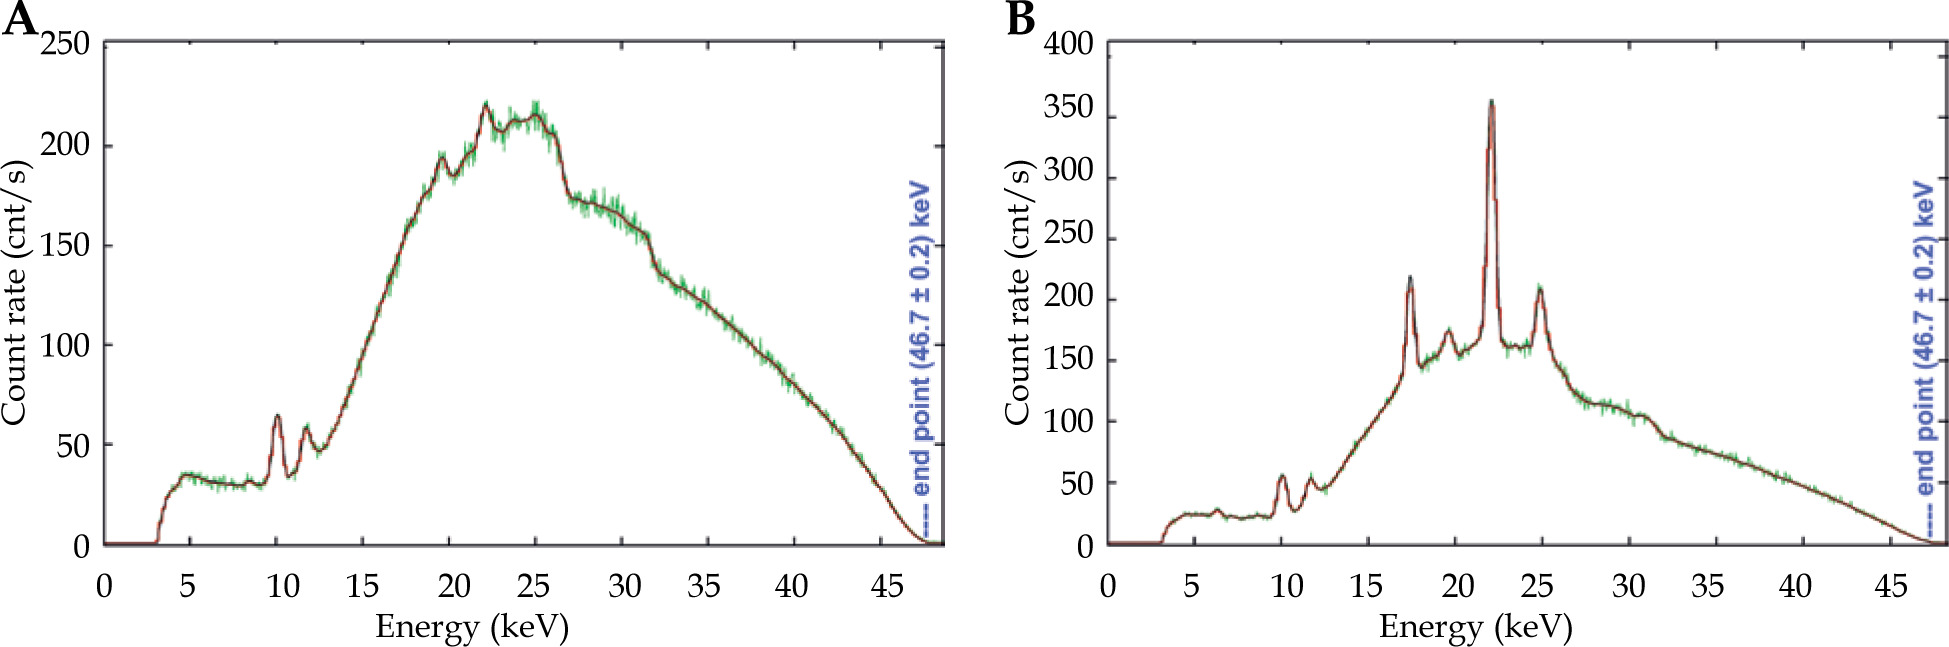
One of the outcomes of the spectra analysis was the low energy of spectrum end-point. Contrary to the anticipated value of 50 keV corresponding to the high voltage of 50 kV set in the Papillon 50 control software, the spectrum end-point energy was determined to be (47.6 ±0.2) keV. The detector energy calibration was correct, which was confirmed by the position of characteristic peaks of rhenium in the measured spectra. The summary of all characteristic peaks observed in the measured spectra is presented in Table 1.
Table 1
Analysis of characteristic peaks in measured spectra
| Peak energy [25] | Element and line | Assumed source |
|---|---|---|
| 6.4 keV | Fe XKα | Applicator |
| 8.7 keV | Re XLα | Anode |
| 10.0 keV | Re XLβ | Anode |
| 11.7 keV | Re XLγ | Anode |
| 17.4 keV | Mo XKα | Applicator coating |
| 19.6 keV | Mo XKβ | Applicator coating |
| 22.1 keV | Ag XKα | Applicator coating |
| 24.9 keV | Ag XKβ | Applicator coating |
Characteristic L-lines of the rhenium anode (i.e., 8.7 keV, 10.0 keV, 11.7 keV) were present in all the measured spectra. The other peaks were pronounced mainly in the spectra obtained at large angles, very close to, or in the beam profile penumbra, where the contribution of photons originated in the anode was significantly decreased due to shielding by the applicator’s body. However, characteristic photons originating on the inner surface of applicator could still reach the detector. The characteristic lines were assigned to molybdenum (17.4 keV and 19.6 keV) and silver (22.1 keV and 24.9 keV). The authors assumed that the stainless-steel applicator included components made of these elements, probably in coating layers, although it was not possible to confirm it.
For comparison, a publication [14] reported detector spectra measured with and without applicators in the scope of another study [13]. The spectra presented there included rhenium peaks only, but the spectra were acquired just on the beam axis. Moreover, they showed significant statistical fluctuations of bin counts, which may hide weak peaks identified in the present study.
The tube voltage lower than 50 kV, specifically 48.5 kV, with a full width at half maximum of 5% was also measured and reported in [13]. The end-point energy reported in the presented study was adopted in Monte Carlo (MC) simulations for the energy dependence of plastic scintillators described by Croce et al. [11].
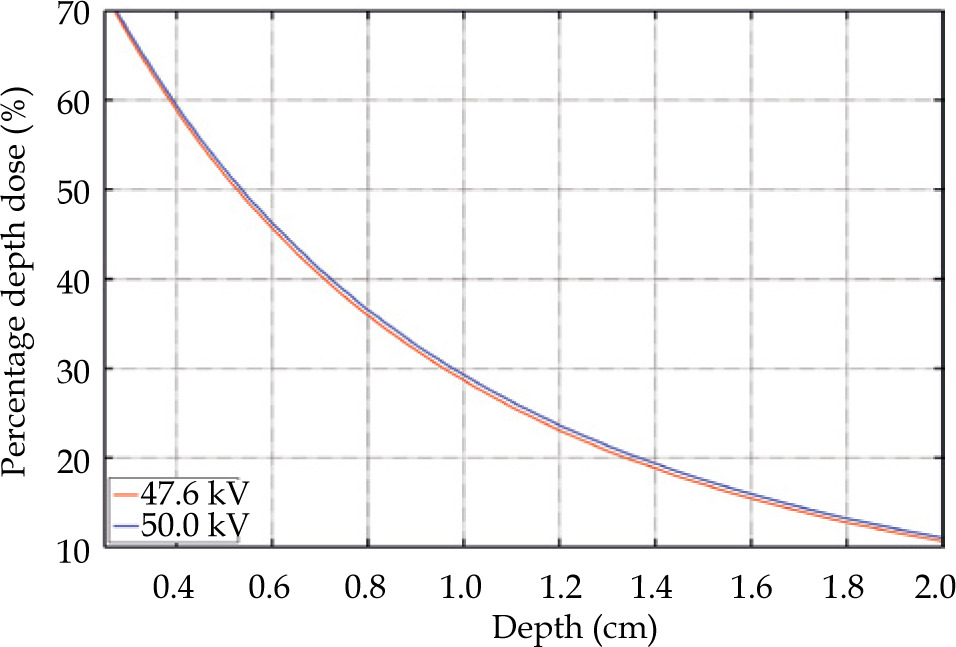
Monte Carlo (MC) simulations were performed to assess the influence of a lower spectrum end-point than expected on the depth-dose curve in water. Fluence spectra applied as a source in simulations were obtained using the SpekPy software [26], because the measured spectrum for a tube voltage of 50 kV was not available. Tungsten anode was applied as a surrogate for rhenium, which was not accessible as a target material in SpekPy. The aluminum filtration thickness was set to 0.76 mm, allowing to achieve the same HVL of calculated spectrum for a tube voltage of 47.6 kV as of the measured spectrum. The low-energy part of both spectra agreed well, confirming that the aluminum was a suitable approximation of materials present in the beam path inside the eBT device. The same filtration thickness was used to calculate the fluence spectrum for 50 kV.
The MC simulations of the depth-dose curve were performed with a general-purpose radiation transport code MCNP®, version 6.2 [27]. A simple geometry included a 30 cm × 30 cm × 6 cm water box with no walls placed in a vacuum. A point source was positioned 2.5 cm from the water surface on the box axis. Photons with energy distribution taken from SpekPy were emitted into a cone with a vertex angle of 45°. Scored quantity was the absorbed dose in a cylindrical mesh lying on the box axis and with a radius of 2.5 mm. The resulted percentage depth doses (PDD) are presented in Figure 4. The change of high voltage from 50 kV to 47.6 kV caused a shift of the PDD roughly by 2%; for example, the 50% and 20% PDD changed from 5.4 mm to 5.3 mm, and from 13.65 mm to 13.35 mm, respectively.
Unfolded fluence spectra
The main characteristics of the photon spectra on the beam axis and the spectra reproducibility for 22-mm and 30-mm applicators are summarized in Table 2. The spectrum was measured twice for each applicator. Before each acquisition, new positioning of the detector was performed to assure independent measurements. The maximum relative difference in the spectra characteristics reached 0.9% in the first HVL. Its value was very sensitive to fluence of low-energy photons. The relative difference in the mean energy was ≤ 0.2%, while the differences did not have any effect on the application of the presented spectra in practice.
Table 2
Reproducibility of spectra measured at the same conditions. RD – relative difference of the given parameter of Measurement 2 with respect to Measurement 1
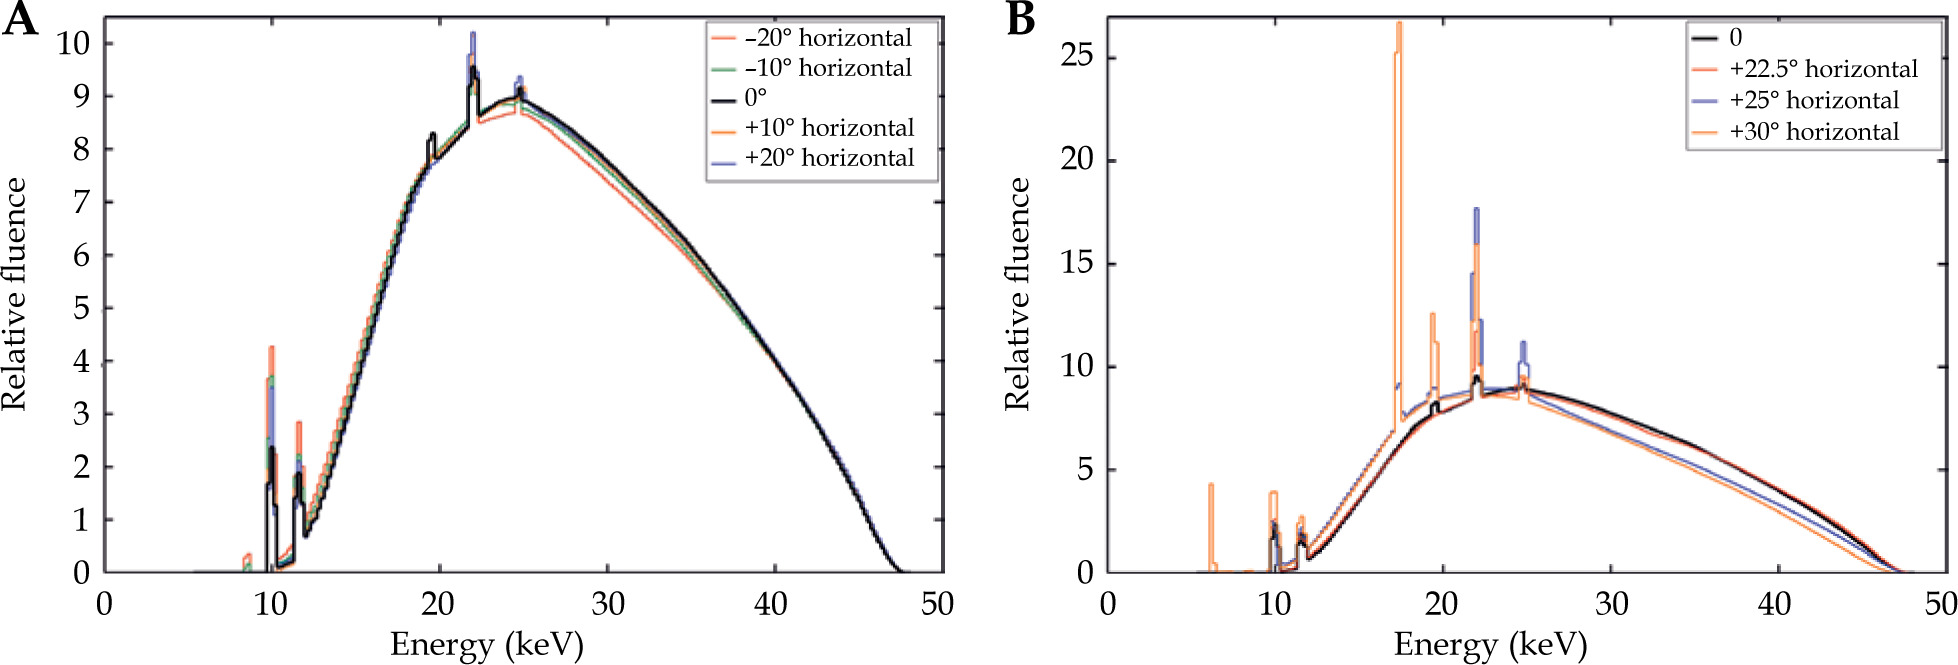
The comparison of the measured Papillon 50 photon fluence spectra on the beam axis and at +22.5° and +30° angles from the beam axis for all three applicators, is illustrated in Figure 5. No significant difference in fluence spectra obtained with different applicators was observed, whereas minor differences could be seen in areas of characteristic peaks. However, compared with the total fluence, the influence on dosimetry was not significant.
Fig. 5
Comparison of the measured photon fluence spectra obtained on the beam axis (A) and at angles +22.5° (B) and +30° (C) from the beam axis for three different applicators. In each plot, all spectra were normalized to the same area
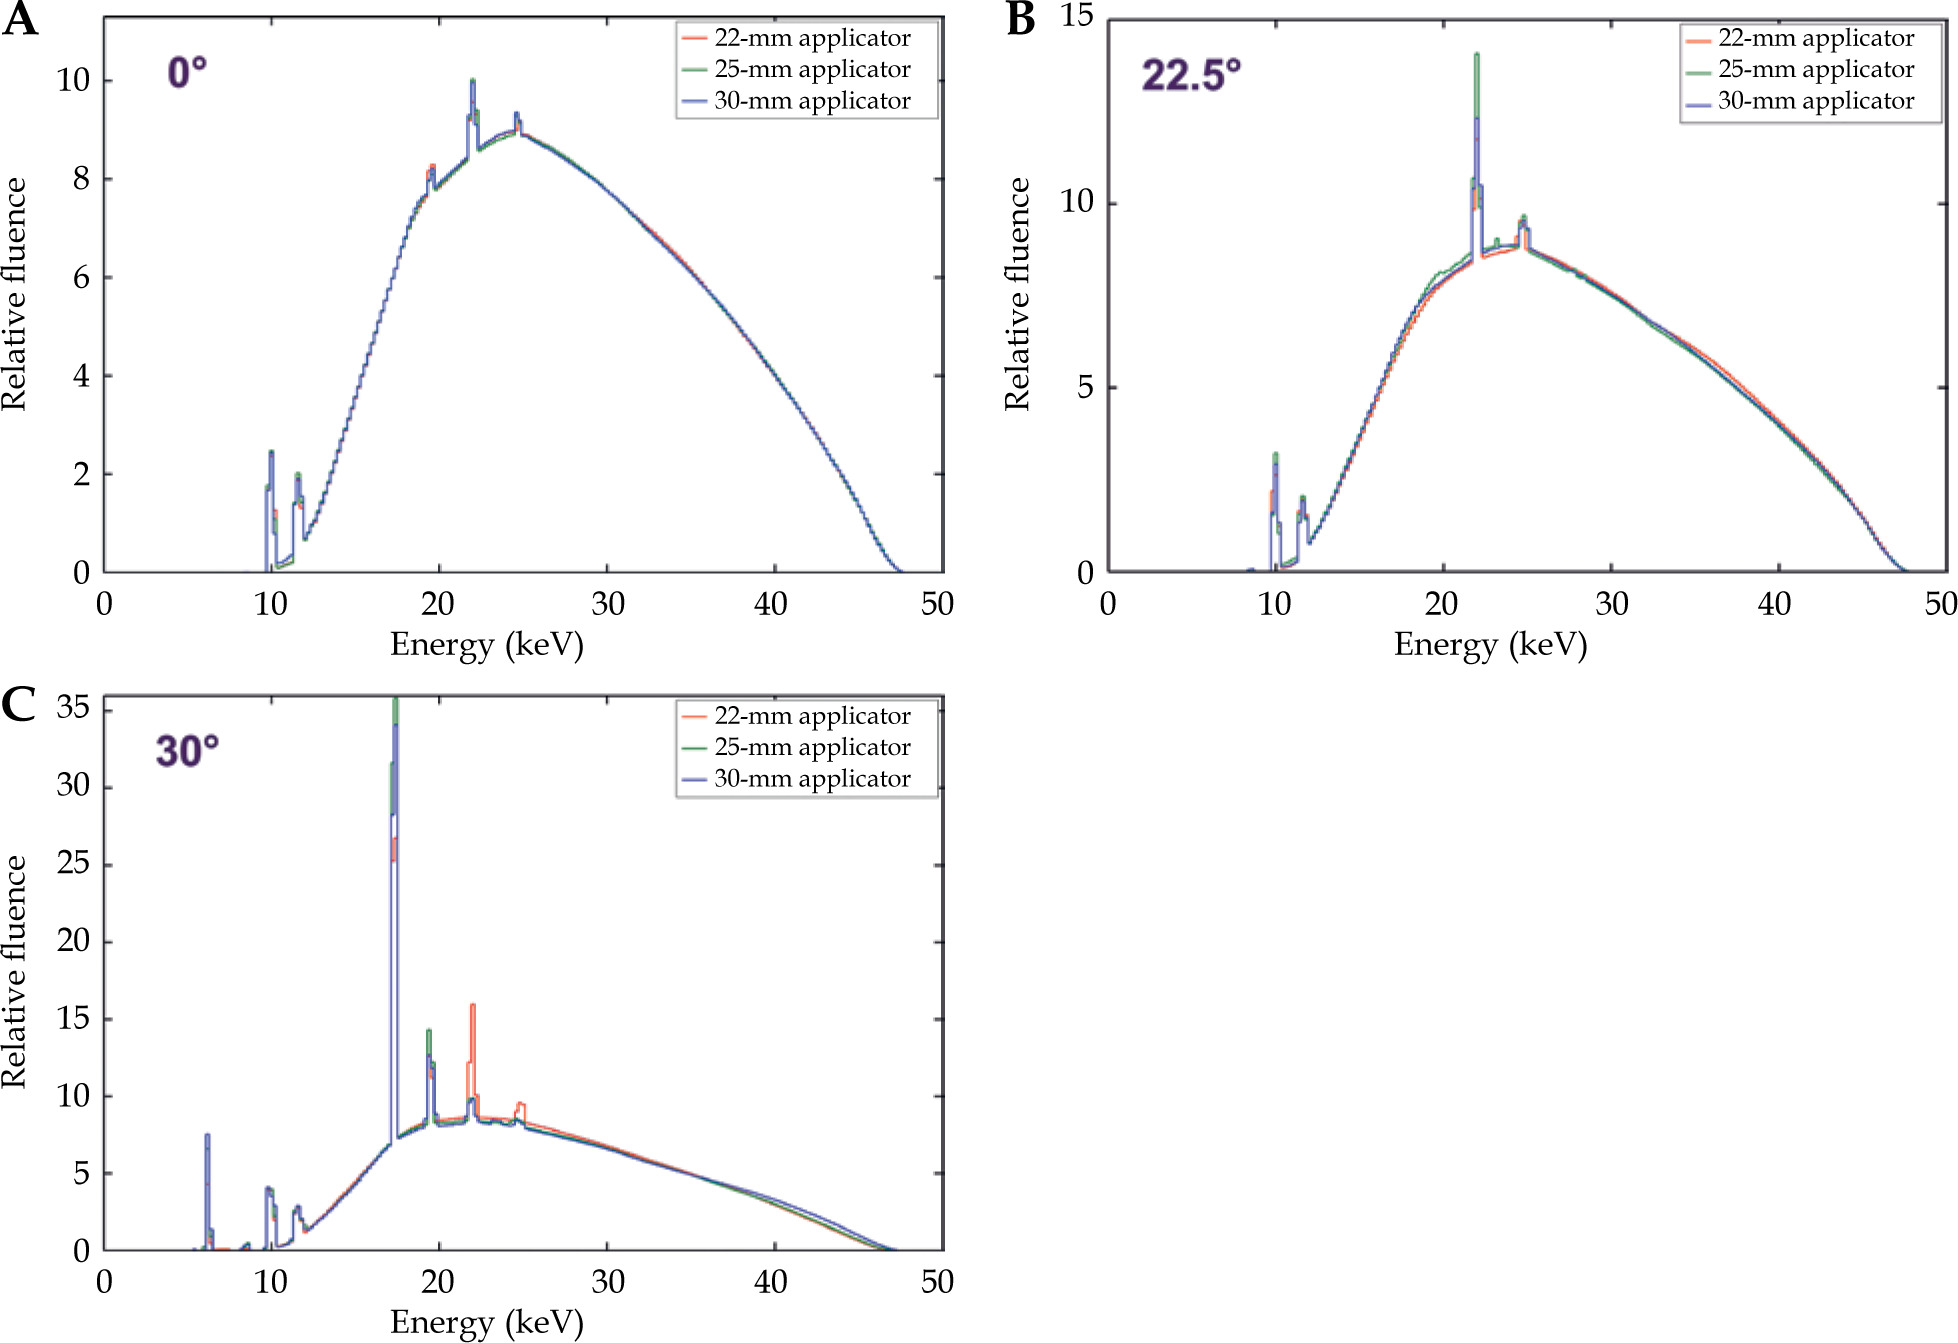
For the 22-mm diameter applicator only, the comparison of spectra acquired at different angles in the beam and in the beam penumbra is depicted in Figure 6. The spectra acquired at the angle interval between -22.5° and +22.5°, corresponding to a beam opening of 45° defined by the applicator shape, were nearly identical. Outside this interval, the detector was positioned in the beam penumbra, which influenced the photon spectrum shape caused by significantly decreased the fluence of photons originating directly in the anode.
Fig. 6
Comparison of the measured photon fluence spectra on the beam axis (black) and at various angles from the beam axis within the beam restricted by the 22-mm applicator (A) and outside the beam in the beam penumbra (B). In each plot, the spectra were normalized to the same area
Air kerma rate or absorbed dose-rate in water or tissue were not investigated in this study. However, for the constant X-ray tube current, they were roughly proportional to the measured count rate normalized to the unit area of collimator opening, neglecting the influence of the change of spectrum. The relative count rate is described in Figure 7. At angles of +22.5° and +30°, where the spectrum differed from the spectra at smaller angles, the relative count rate decreased to 5% and 0.5% of the maximum count rate achieved on the beam axis, respectively.
Fig. 7
Count rate per unit area of a collimation disc aperture determined in the horizontal plane (hor) at different angles from the beam axis and for different applicators (appl.). The values were normalized to the maximum count rate
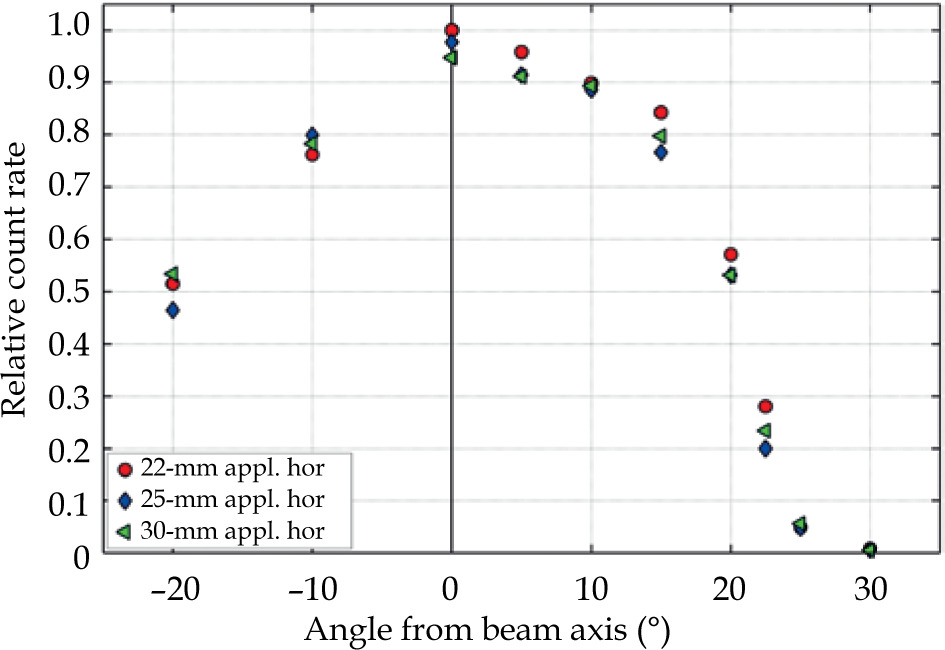
The influence of comparatively low-dose-rate and spectral changes in the beam penumbra on patient dosimetry requires clinical research, and is beyond the scope of this study.
Slight differences in the spectra characteristics were observed as a function of the angle from the beam axis, as presented in Figure 8, for the mean photon energy and the first HVL.
Fig. 8
Mean energy (A) and first half-value layer in aluminum (B) of the photon fluence spectrum as a function of angle from the beam axis. The results were presented for each considered applicator (appl. in the legend) and for both horizontal (hor) and vertical (ver) planes of the measurement
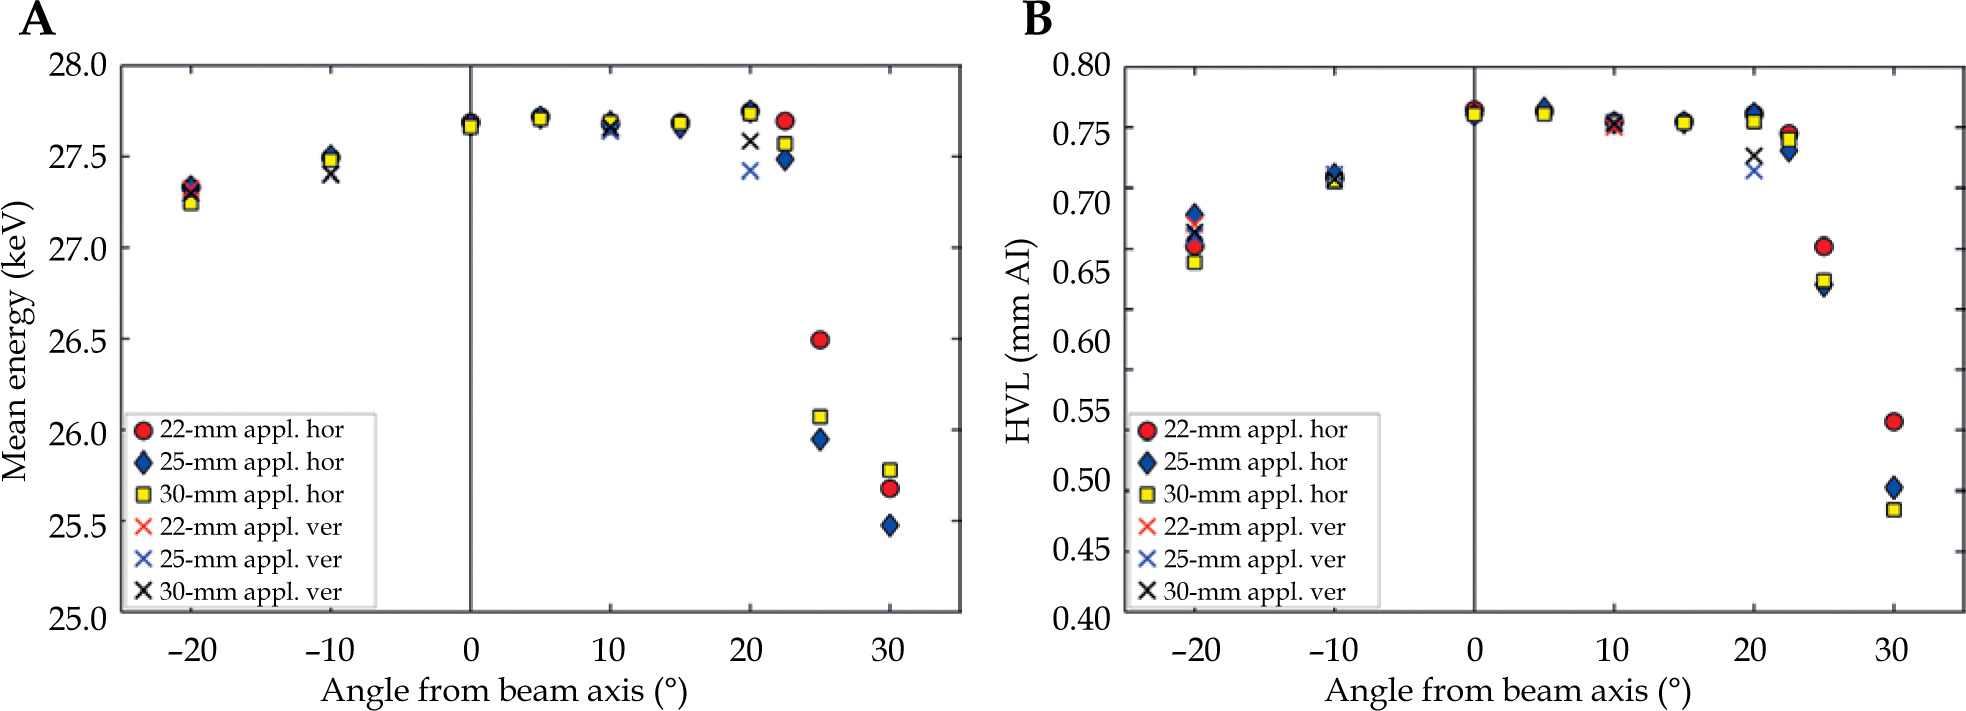
While EmeanF and HVL did not change at angles from 0° to +15° in both planes and up to +20° in the horizontal plane, in the negative direction in both planes, the EmeanF and HVL slightly decreased with an increasing angle from the beam axis. An asymmetry was also observed in the measurements of lateral dose profiles in water with a small plastic scintillation detector performed with the same piece of the eBT device [11]. The asymmetry could be caused by a misalignment of X-ray tube focus or, as assumed by the above-mentioned study, by unintended heterogeneities in its construction or by damage to the beam filter. On the other hand, the presented asymmetry was not observed by Croce et al. [13] investigating another Papillon 50 device, suggesting that the dose profile asymmetry was device-specific. The presented results indicated that comprehensive spectral and dose characterization studies are needed for eBT systems.
Except that described above, no difference was found between the spectra acquired at the same angle in the horizontal plane compared with the vertical plane. The results of the second HVL and HC for all spectra are provided in Supplementary Material.
In the beam penumbra at angles ≥ 25°, the EmeanF and first HVL significantly decreased due to the increased relative number of characteristic photons as well as due to the decrease of the number of higher-energy photons from the anode because of applicator shielding (Figure 6).
In the set of reference X-ray beam qualities typically available in calibration laboratories, the closest equivalent to the Papillon 50 spectrum on the beam axis was found in the low-energy therapy radiation qualities TW according to DIN 6817 [28]. The parameters of the Papillon 50 spectrum approximate those of the TW50 [29] (50 kV, additional filtration of 0.7 mm aluminum [30], EmeanF = 28.8 keV, EmeanK = 23.7 keV [30], first HVL in Al = 0.961 mm, second HVL in Al = 1.49 mm). Slightly lower values presented in Table 2 for the Papillon 50 spectrum were caused by the lower actual bias voltage, resulting in the lower end-point of 47.6 keV of the photon fluence spectrum.
Conclusions
The aim of this work was the spectrometric characterization of the X-ray beam emitted by the electronic brachytherapy unit Papillon 50. The spectra acquired at the angle interval between -22.5° and +22.5° from the beam axis are nearly identical and do not depend on the applicator used. Outside this angle interval, the photon fluence rate decreases significantly, the mean energy decreases, and the relative number of characteristic photons increases. The spectrum end-point was determined to be (47.6 ±0.2) keV for the nominal bias voltage of 50 kV set in the Papillon 50 control software.
Here, a comprehensive dataset of photon fluence spectra is provided with the aim to be used for traceable dosimetry with the Papillon 50 eBT device, which is required, for example, for the calculation of energy dependence corrections of detectors, or for dosimetric and Monte Carlo studies. The observed deviations from nominal values suggest that spectrometry and dose characterization studies are needed for eBT systems. The measured spectrum on the beam axis is also available in X-ray spectra catalogue of various eBT devices compiled within the PRISM-eBT project [31].


