
Introduction
Functional gastrointestinal disorders (FGID) are one of the most common reasons for patients to visit primary care specialists and gastroenterologists in outpatient clinical practice [1]. Recent populational studies revealed that the prevalence of FGID according to Rome IV criteria [2] is about 40% worldwide [3]. It should be noted that the prevalence of functional bowel disorder (FBD) is more than 30% worldwide [3, 4], which is higher than that of gastroduodenal, anorectal, and other FGID [3]. Functional bowel disorders include irritable bowel syndrome (IBS) with its subtypes with diarrhoea (IBS-D), constipation (IBS-C), mixed variant (IBS-M), and unspecified (IBS-U), functional constipation (FC), functional diarrhoea (FD), opioid-induced constipation, functional bloating/distention, and unspecified FBD [5]. Diarrheal FGID is one of the most prevalent FBDs: IBS-D accounts for more than 30% of all IBS variants [6], and FD has a prevalence of 5% [3]. Moreover, it was found that approximately 1 in 5 of people of different populations seek medical care due to diarrhoea [7].
Some studies in recent years have revealed the possible role of alterations of bile acid metabolism in the pathogenesis of FBD with diarrhoea [8, 9]. It was shown that approximately 25–50% of patients with IBS-D and FD may suffer from bile acid diarrhoea (BAD) or have features and evidence of bile acid malabsorption (BAM) [10, 11]. It is considered that 1% of the world population may have BAD and BAM [12]. Despite the supposedly high prevalence, including among patients with FD and IBS-D, BAD/BAM is considered as an underrecognized and underappreciated reason of chronic diarrhoea, leading to inappropriate management and treatment of such patients [13, 14]. Unfortunately, there are still limited literature data regarding the features of bile acid metabolism in patients with FBD.
Aim
Hence, the purpose of the present study was to evaluate the indicators of bile acid metabolism and their association with clinical characteristics in patients with IBS.
Material and methods
The present clinical trial was performed in accordance with the Ukrainian law, Good Clinical Practice (GCP), and the Declaration of Helsinki requirements. All the study participants signed a written informed consent form before starting the investigation. The Bioethical Committee of Bogomolets National Medical University (Kyiv, Ukraine) approved the protocol of the present trial.
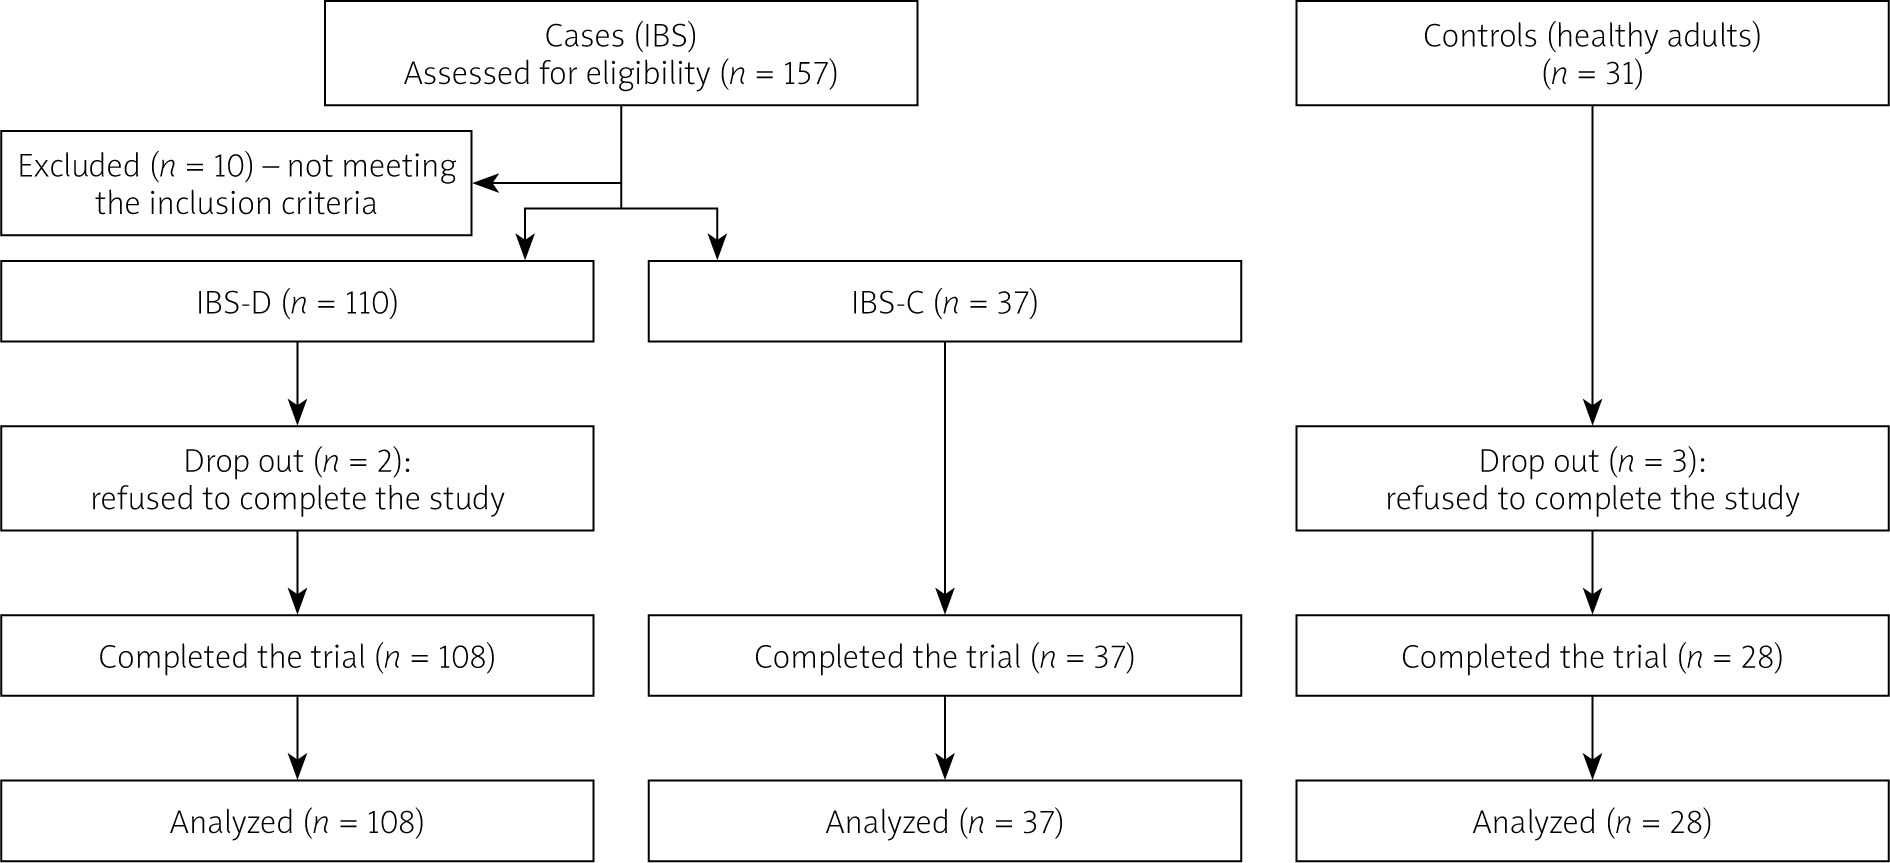
The investigation was conducted as a case-control study. The trial’s population consisted of participants of both sexes: 108 patients with IBS-D aged from 18 to 44 years, and 37 patients with IBS-C aged from 18 to 44 years, as well as 28 healthy volunteers aged from 19 to 45 years without any gastrointestinal (GI) diseases (including FGID), who composed the control group. The diagnosis of IBS was made using the Rome IV criteria [5]. The inclusion criteria for participants with IBS were as follows: men and women, aged from 18 to 45 years, diagnosed with IBS using a positive diagnostic strategy [15], normal values of faecal calprotectin, negative faecal occult blood test (transferrin and/or haemoglobin), negative values of celiac antibodies (for patients with IBS-D), negative pregnancy test for women, and signed informed consent for participation in the study. The exclusion criteria for participants with IBS were as follows: age more than 45 years, the presence of “alarm” symptoms (weight loss, nocturnal symptoms, blood in the stool, signs of anaemia, hyperthermia, changes in laboratory tests, family history of GI cancer), organic disorder of the GI tract, anamnesis of taking antibiotics, probiotics, laxatives, or bile acid sequestrants (BAS) less than 3 months before the beginning of the trial, severe somatic and oncological diseases, acute illness less than 2 months before the trial start, pregnancy and lactation, alcohol abuse, positive faecal calprotectin, occult blood test, and celiac antibodies. Use of antispasmodics on-demand to relieve abdominal pain was allowed.
Symptom questionnaires
All the participants were encouraged to fill in a written form with questions about stool appearance according to the Bristol scale [16], daily defecation frequency, and severity of abdominal pain and bloating based on a visual analogue scale (VAS) (points from 0 to 10).
Assessment of FBD severity
The severity of FBD was evaluated using the functional bowel disorder severity index (FBDSI) [17]. The FBDSI includes 3 questions: severity of abdominal pain based on VAS (points from 0 to 100), diagnosis of chronic functional abdominal pain, and the number of visits to a doctor during the last 6 months. A total FBDSI score of less than 37 points indicated mild FBD, 37–110 points indicated moderate FBD, and more than 110 points indicated severe FBD.
Assessment of visceral sensitivity
The visceral sensitivity was evaluated using the visceral sensitivity index (VSI) [18]. The VSI is a valid tool allowing the measurement of gastrointestinal-specific anxiety (GSA). It includes 15 items that range from 1 (strongly agree) to 6 (strongly disagree), which are then reverted to 5 – 0 points, respectively. The total score of the VSI may be from 0 to 75, and higher levels indicate more severe GSA.
Measurement of serum bile acids (BA)
Fasting (> 8 h) blood samples were collected from all the participants. The method of high-performance liquid chromatography – mass spectrometry (HPLC-MS) was used to measure the levels of serum total, primarily (cholic acid (CA) and chenodeoxycholic acid (CDCA)) and secondary (deoxycholic acid (DCA) and lithocholic acid (LCA)) BA, as previously described [19, 20]. The obtained levels of BA were expressed in nmol/l. Additionally, the levels of primarily and secondary BA were expressed in percentages of total BA.
Measurement of faecal BA
The faecal samples were collected from all the participants and then stored under anaerobic conditions at 4°C. After that the faecal samples were homogenized for 18 h and stored at –80°C, as previously described [20]. The method of HPLC-MS was used to measure the levels of faecal total, primary (CA and CDCA), and secondary (DCA and LCA) BA, as previously described [19–21]. The obtained levels of BA were expressed in nmol/g of faeces. Additionally, the levels of primarily and secondary BA were expressed in percentages of total BA.
Assessment of total relative activity (RA) of gut bacterial bile salt hydrolase (BSH)
The faecal samples were collected from all the participants and then stored at –80°C. The method of ultra-performance liquid chromatography – mass spectrometry (UPLC-MS) was used to evaluate the total enzyme activity of gut bacterial BSH, as previously described [22, 23]. The RA of gut bacterial BSH was expressed in units of cholylglycine hydrolase/ml (from Clostridium perfringens, EC 3.5.1.24, Sigma-Aldrich).
Statistical analysis
Results of present investigations were analysed using SPSS software (version 23, IBM Corp., Armonk, NY, USA). To check the normality of distribution of continuous variables, the Shapiro-Wilk test was performed. In the case of normal distribution, the data were presented as mean with standard deviation (mean ± SD), and in the case of non-normal distribution they were shown as median with first and third quartiles (median [Q1–Q3]). The differences between the means of the trial groups were checked by one-way ANOVA test (in the case of normal distribution) or Kruskal-Wallis (in the case of non-normal distribution). In the case of one-way ANOVA, post-hoc analysis was performed with Student’s t-test for independent variables with the use of Bonferroni correction, whereas the Kruskal-Wallis test was followed by a post hoc implementation of the Dunn test. The χ2 test was used to check the difference between qualitive variables. To determine the statistical relationship between the data, Spearman’s rank correlation (r) was used. Differences between groups were considered significant when p < 0.05.
A flow-chart of the study is represented in Figure 1.
Results
Baseline characteristics of the trial groups
Baseline characteristics of the trial groups are represented in Table I.
Table I
The Baseline characteristics of the compared groups
* The data were presented as Median (Q1–Q3), except for sex. Sex represented in absolute number (percentage). **Kruskal-Wallis test was used, except for sex. Differences in sex ratio were checked by χ2 test. #Significant difference in comparison with IBS-D (p < 0.05). §Significant difference in comparison with IBS-C (p < 0.05). &Significant difference in comparison with IBS-C (p < 0.05).
There were no differences between the compared groups in terms of age (p = 0.224) and sex ratio (p = 0.749). It was found that abdominal pain, bloating severity, and levels of VSI and FBDSI were significantly higher in the IBS-D and IBS-C groups compared to the control group (p < 0.01), but there was no difference between the IBS-D and IBS-C groups (p > 0.05). The daily defecation frequency was higher in the IBS-D group compared to the control and IBS-C groups (p < 0.01), but there was no difference between the control and IBS-C groups (p > 0.05). The mean values of Bristol stool type were different between all the 3 trial groups in a pairwise comparison (p < 0.05).
Indicators of bile acid metabolism of the compared groups
The levels of serum BA (sBA), faecal BA (fBA), and RA of gut bacterial BSH of the trial groups are represented in Table II.
Table II
The levels of sBA, fBA, and RA of gut bacterial BSH of the compared groups
* Data presented as mean ± SD or median (Q1–Q3) depending on the normality of data distribution. **One-way ANOVA or Kruskal-Wallis test was used depending on the normality of data distribution. #Significant difference in comparison with control group (p < 0.05). §Significant difference in comparison with IBS-C (p < 0.05).
The levels of total serum BA and absolute values of secondary BA were not different between the groups. Serum primary BA in absolute values and percentages of total BA were significantly higher, and serum secondary BA percentages were significantly lower in the IBS-D group compared to the control and IBS-C groups (p < 0.01), but there were no differences between control and IBS-C groups (p > 0.05).
The levels of total faecal BA and faecal primary BA in absolute values and percentages of total BA were significantly higher, and secondary BA in percentages were significantly lower in the IBS-D group compared to the control and IBS-C groups (p < 0.01), but there were no differences between the control and IBS-C groups (p > 0.05). Faecal secondary BA absolute values were significantly lower in the IBS-D group compared to the IBS-C group (p < 0.01), but there were no differences between the IBS-D and control groups, and IBS-C and control groups (p > 0.05).
The RA of gut bacterial BSH was significantly lower in the IBS-D group compared to the control and IBS-C groups (p < 0.01), but there were no differences between the control and IBS-C groups (p > 0.05).
Correlation between the indicators of bile acid metabolism and clinical features of the trial groups
Correlation coefficients are represented in Table III. Considering all the study participants together, it was found that the RA of gut bacterial BSH, and the percentage levels of serum and faecal secondary BA correlated negatively with the severity of abdominal pain, bloating, daily defecation frequency, Bristol stool scale, VSI, and FBDSI. While the levels of total faecal BA, and absolute and percentage levels of serum and faecal primary BA correlated positively with the same clinical parameters of the study population (p < 0.05 in all mentioned correlations).
Table III
Correlation coefficients between the indicators of bile acid metabolism and clinical characteristics of study participants (p < 0.05 in all correlations)
Discussion
Our present investigation revealed alterations of bile acid metabolism in patients with IBS with several differences between IBS subtypes. It was shown that participants with IBS-D had significantly higher levels of primary serum BA and lower levels of secondary serum BA in proportions from total serum BA (relative levels in %) compared to healthy participants and patients with constipation subtype of IBS. But at the same time, there were no differences in absolute levels of serum total BA between the study groups. These results of our investigation are comparable to the results of previous studies in which the authors also found no difference in levels of serum total BA between controls, IBS-C, and IBS-D patients [20] as well as increased primary serum BA in IBS-D compared to healthy controls [20, 24] and a decreased relative proportion of secondary BA compared to healthy controls [20]. It should be mentioned that in a previous similar study [20] there were no differences in levels of primary serum BA between IBS-C and IBS-D participants (which is different from the results of the present study), but also there were no differences in levels of secondary serum BA between IBS-C and controls, as in our investigation. Unfortunately, there are limited literature data regarding the features of serum BA metabolism in patients with IBS, and most other authors have used other serum markers of altered BA metabolism in IBS patients like serum FGF19 and serum C4 [25, 26].
In terms of faecal BA, we revealed increased levels of total faecal BA in patients with IBS-D compared to healthy controls and IBS-C patients. In some previous studies it differences between controls and IBS subtypes in excretion of total BA were not found [20, 21, 27], while in others their increased level in IBS-D compared to healthy controls [9, 24, 25, 28] and IBS-C patients was found [26, 28], as in our study. In the present investigation we did not reveal a difference in total faecal BA between controls and IBS-C participants, which is consistent with previous studies [20, 26], but in one study it was found that approximately 15% of IBS-C patients had decreased total faecal BA [29]. Regarding the primary and secondary faecal BA composition, our study revealed increased absolute amount and relative proportion of primary faecal BA and decreased relative proportion of secondary faecal BA in IBS-D compared to controls and IBS-C patients. These data are consistent with most previous investigations in which the increasing of faecal primary and decreasing of secondary faecal BA in IBS-D patients comparing to healthy people was also found [9, 20, 21, 24, 27, 28], as well as compared to IBS-C patients [20]. Also we did not reveal differences in faecal BA composition between healthy adults and IBS-C patients, as in one previous study [20], but at the same time, in the other studies decreased faecal excretion of primary CDCA [28] and increased of secondary LCA in IBS-C participants comparing to healthy controls was revealed [28, 29].
Additionally, we assessed the enzymatic activity of gut bacterial BSH and revealed that its activity was lower in IBS-D patients comparing to controls and IBS-C patients, without differences between the last two. In the literature data we found only one study with the assessment of BA deconjugation activity in patients with IBS [20] in which the authors revealed its decrease in both IBS-D and IBS-C participants compared to controls. So, it is assumed that decreased BSH activity that transforms primary BA to secondary BA may contribute to the altered serum and faecal BA composition and consequently the symptom development in patients with IBS. Moreover, in several studies it was shown altered gut microbiota composition in patients with IBS-D and possible BAM by decreasing abundance of bacteria with BSH-activity [9, 21] and decreasing abundance of BSH genes [24]. But further studies are needed to confirm the possible link between BSH activity, gut microbiota composition, indicators of BA metabolism, and IBS features.
To look for a possible relationship between the parameters of BA metabolism and IBS features, we conducted a correlation analysis. A link was found between altered BA metabolism and clinical parameters of study participants: severity of abdominal pain, bloating, stool appearance and frequency, as well as disease severity index (FBDSI) and visceral sensitivity (VSI). In previous studies similar correlations were also found [9, 20, 21]. It was shown that the higher serum primary, faecal total and primary BA with lower serum and faecal relative proportions of secondary BA – severe pain, bloating, disease severity, softer and more frequent stools. Additionally, it was revealed that the RA of gut bacterial BSH is negatively correlated with all clinical parameters, meaning that its lower levels are associated with more severe clinical presentation. Unfortunately, we did not find any information about such a relationship in the literature data. So, further investigations are needed to confirm and expand our data. Interestingly, we found a link between the visceral sensitivity assessed by valid tool (VSI) and parameters of BA metabolism. Some previous studies also show that BA may contribute to visceral sensitivity [30] but others did not reveal such a relationship [9]. Considering the altered composition of serum and faecal bile acids found in our patients with IBS, which is partially comparable with BAD, we can assume that the treatment of such patients may include the bile acids sequestrants [10–12, 14]. This group of drugs was also previously recommended by the Rome Foundation for patients with IBS-D [5]. Moreover, the decreased activity of gut bacterial BSH in patients with IBD-D may be a possible target for future treatment options, for example using BSH-containing probiotics, but future randomized trials are needed to check that. The limitations of our study include the absence of assessment of gut microbiota composition, serum biomarkers of BAM like C4 and FGF19, and single stool collection for the evaluation of faecal BA. We plan to overcome these limitations in our next trials.
Conclusions
The results of the present investigation revealed altered parameters of bile acid metabolism mainly in patients with diarrhoeal subtype of IBS. Compared to healthy controls and patients with constipation subtype of IBS, patients with IBS-D had higher levels of serum primary, faecal total and primary BA, and lower relative proportions of serum and faecal secondary BA, as well as decreased enzymatic activity of gut bacterial BSH. The mentioned altered indicators of BA metabolism were associated with the severity of clinical symptoms, disease severity, visceral sensitivity, and stool appearance and frequency, probably defining the subtype of IBS. Hence, the probability of bile acid malabsorption in patients with IBS-D should be considered by physicians when managing them. Further studies are required to confirm and expand the results of the present trial.