
Introduction
Traditionally, problems with gastric dyspepsia of both organic and functional genesis have been considered in terms of changes in the production of gastric juice; namely, its key component: hydrochloric acid. In modern gastroenterology, a number of probe and probe-free methods are used, most of which relate to research tools and are used in specialised laboratories to solve purely scientific problems [1]. In routine clinical practice the most often used test is the serum pepsinogens (PSG) assay. In recent decades conventional gastric acid aspiration tests with stimulation of histamine and pentagastrin are rarely used. Intragastric pH-metry remains relevant, but in most cases its practical application is reduced to simultaneous secondary monitoring when performing a 24-hour pH-metry of the oesophagus with a two-sensor probe. Solo use of the intragastric pH-monitoring is limited to pharmacodynamic studies of acid inhibitors.
In modern practical gastroenterology, there is a clear trend towards a reduction of instrumental testing in so-called acid-related diseases, which include peptic ulcers (PU), gastroesophageal reflux disease (GERD), non-steroidal anti-inflammatory drugs (NSAID)-gastropathy, and functional dyspepsia (FD) with certain limitations. There are “test and treat” strategies and there is empirical use of proton pump inhibitors (PPI), which is aimed at minimising the use of instrumental diagnostics [2]. This approach is definitely a compromise between quality of diagnosis and its cost. In recent guidelines and clinical protocols devoted to the above-mentioned nosologies, practical application of functional tests for the study of gastric acidity is not considered.
The main reason for ignoring intragastric pH-metry in the examination and controlled treatment of upper gastrointestinal diseases is the introduction into practice of potent inhibitors of secretion. The empirical use of PPIs satisfies almost all patients with the pathologies mentioned above. FD in contrast to GERD, NSAID-gastropathy, PU is not the acid-related disease. For persons with hypoacidity, a PPI treatment will not be effective and is theoretically more likely to provoke side effects in the form of bacterial diarrhoea etc. However, the risk of complications, as already noted, is small, and the proportion of patients with hypoacidity due to atrophic gastritis is minor. It varies within the range 5.5–8.5% of patients with FD [3, 4]. This contingent could be detected with the assistance of functional diagnostics, and as a result we will avoid unjustified prescription of PPI. This reason and the screening of premalignant lesions, including cases with gastric atrophy, are the most important practical tasks for applying method of assessment gastric acidity. Recently these problems have been resolved by using high-resolution magnification and image-enhanced (NBA and BLI) endoscopy [5]. These methods are now routinely available in Japan and are increasingly used in developed countries. The main obstacle for worldwide use of this approach is the high cost of equipment and necessity of appropriate training.
pH-metry is an inexpensive, well-reproducible test, but in Ukraine and other developing countries it is difficult to apply due to absence of registered stimulants of secretion (pentagastrin, teragastrin). Measurement only in the basal condition is popular in the former USSR [6]. This gives limited information because there is a significant group of people without gastric atrophy but with no production of acid in the basal conditions.
Aim
We aim to develop a simplified pH-metric test with a standardised meal for assessment of gastric secretion in the most common dyspepsias, including functional disorders and organic pathology.
Material and methods
pH recording
In our research we used an ambulatory system of MII-pH-monitoring AΓ-3pH-4R (“Start Ltd.”, Vinnytsia, Ukraine). We used a specialised catheter (ΠΕ-2pH, Company with additional responsibility “Special construction bureau of medical electrical engineering”, Kamianets -Podilskyi, Ukraine) with 1.8 mm diameter consisting of two tungsten oxide pH-sensors.
After an overnight fast, each subject attended the motility laboratory between 9:00 and 9:30 a.m. The 200-minute gastric pH-monitoring simulates usual digestive behaviour including rest and postprandial phases. A design of the recording is depicted in Figure 1. After placement of the probe, subjects remained in a sitting and a supine position alternately for 45 min to obtain a baseline recording. Stimulating breakfast was standardised by using a McDonald’s menu: a blackcurrant muffin and a small cup of Americano coffee with sugar – 507 kcal, 300 ml volume, carbohydrates 72 g, fats 27 g, protein 6 g, 100 mg caffeine.
Figure 1
Design of 200-minute gastric pH-monitoring with provocative breakfast and sample pH-tracing. Marks pH1, pH2, and pH3 depict minimal value in basal and two postprandial phases; t1 – time of acid-neutralisation, t2 – time after breakfast until reaching a threshold pH < 3.5
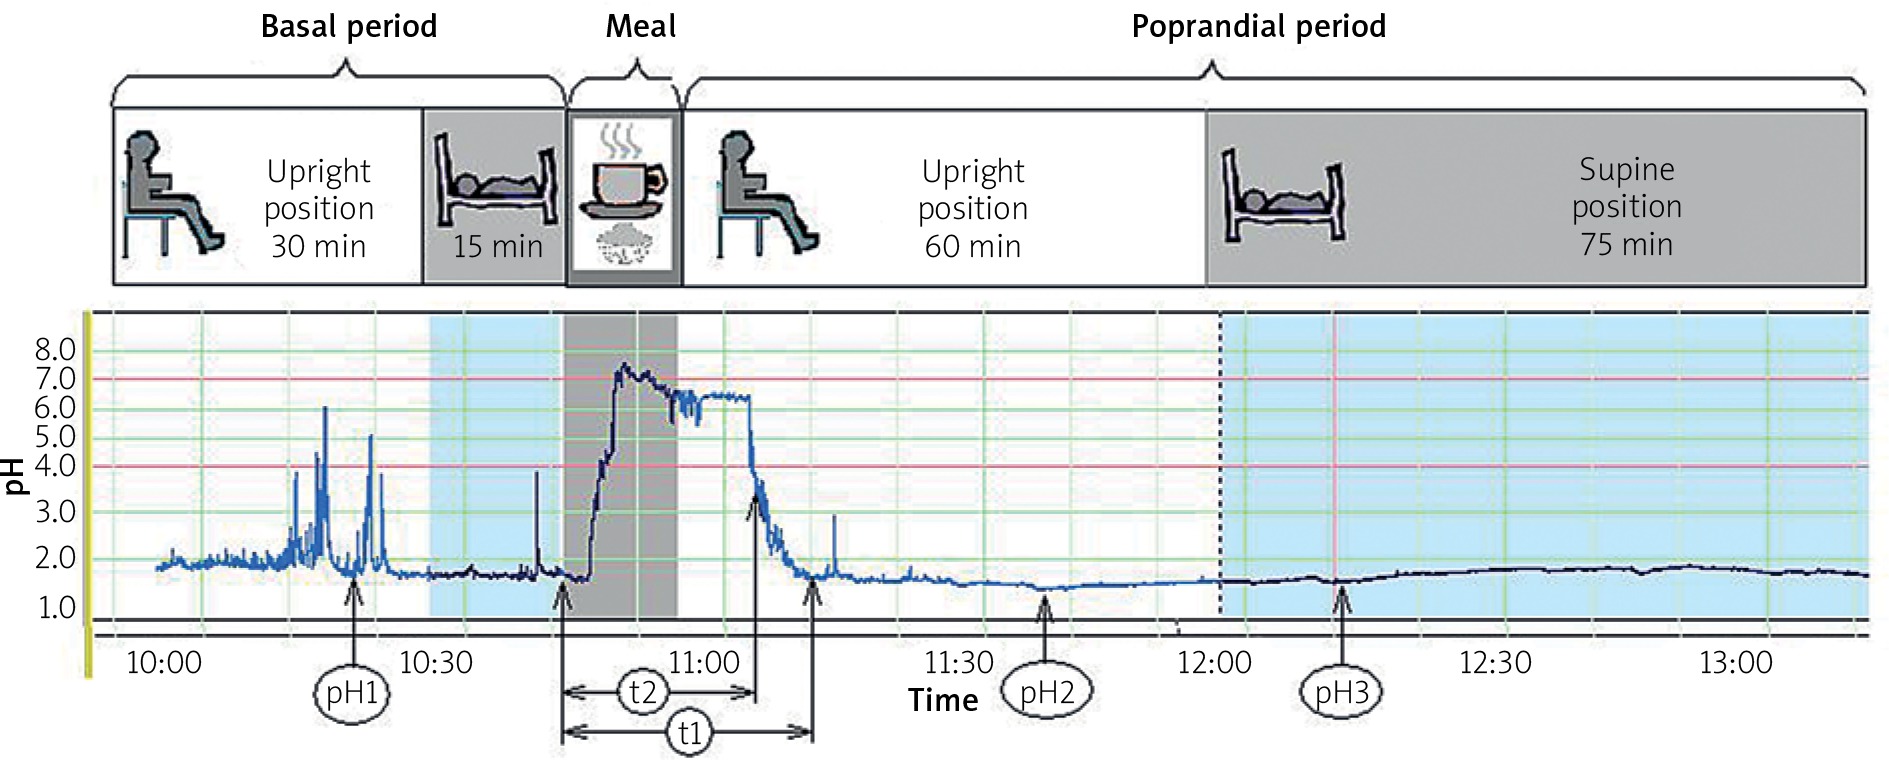
Indicators were determined during the study: 1) the minimum pH (nadir) in the basal phase during the first 45 min of test (pH1); 2) the minimum pH after standard breakfast during the first hour (pH2); 3) the minimum pH during the second hour after breakfast (pH3); 4) total time of acid-neutralisation in postprandial phase (t1); 5) time after breakfast until reaching a threshold pH of 3.5 (t2) (Figure 1).
Pepsinogen assays
As a reference method for the evaluation of gastric secretion, we used an enzyme-linked immunosorbent assay for plasma PSG1 and PSG2 (Vector-Best kits, Novosibirsk, Russia) according to the manufacturer’s instructions.
The result evaluation was carried out by comparison with the normative indicators, namely: the normal state of the gastric mucosa corresponds to the concentration of PSG1 in the range of 50–130 µg/l; with atrophic gastritis, the secretion of hydrochloric acid significantly decreases, and as a consequence, the serum PSG1 concentration drops to below 50 µg/l. An additional criterion for the presence of atrophy was a decrease in the ratio of PSG1/PSG2 to below 3.
Proton pump inhibitors and H2-receptor antagonists were withdrawn 1 week before a pH-monitoring and taking a blood sample.
Study design
The study was carried out in the Diagnostic Gastroenterological Laboratory at Vinnytsia National Medical University between 2011 and 2016. Outpatients with upper gastrointestinal symptoms were recruited after referral for consultation by a general practitioner. A preliminary check-up was used to select patients with FD and GERD. All patients were previously undergoing esophagogastroduodenoscopy, ultrasound examination of the abdominal cavity, and routine laboratory tests. The exclusion criteria were: age up to 20 years or above 76 years, pregnancy and lactation, gastric lesions (polyp, cancer), oesophageal varices, evidence of cancer or mass lesion in the oesophagus, resection of the stomach, previous oesophageal or gastric surgery, Zollinger-Ellison syndrome, ulcerative colitis, Crohn’s disease, chronic heart failure above third FC by NYHA, chronic kidney disease with glomerular filtration rate (GFR) less than 30 ml/min, pulmonary failure above second degree, and hepatic encephalopathy above first degree.
All patients were divided into four groups:
Non-dyspeptic – A reference control group was collected from subjects without suspicious complaints or clinical signs of GERD and functional disorders of the upper gastrointestinal tract. Most of them had a halitosis and burning mouth syndrome.
Duodenal PU – Patients with endoscopic proven lesion > 3 mm.
GERD – This group included 82 patients with NERD and 10 persons with endoscopy-positive forms. Diagnoses were established based on the criteria of the Montreal consensus (2006). NERD was diagnosed if there was confirmation either by oesophageal pH-monitoring including positive symptom association in cases with normal GER number or by subsequent positive PPI-test in the mode described by de Leone [7]. Subjects with oesophageal hypersensitivity (positive symptom association with non-acidic reflux) were defined as NERD.
FD – The main group of patients was formed from patients who fulfilled the Rome III criteria for FD. They were divided on three subgroups: epigastric pain syndrome (EPS), co-existing EPS and postprandial distress syndrome (PDS) (EPS/PDS), and PDS. In the FD group there were 30 patients with erosive duodenitis and gastritis with lesion size < 3 mm. According to American Gastroenterological Association technical review on the evaluation of dyspepsia, the presence of certain endoscopic abnormalities, including gastric erosions, oesophageal or duodenal erythema, or a hiatal hernia, does not exclude the diagnosis of FD [2].
The GERD and functional dyspepsia groups included patients who had a previous successfully healed PU with confirmation of the absence of H. pylori and ulcerative (erosive) lesions of the upper digestive tract at the time of the study (Table I).
Table I
Demographic data and clinical features of patient groups
Assessment of complaints
In this study, a face-to-face 30-min interview was conducted using a «Rome III Diagnostic Questionnaire» during the health examination visit. This tool was used as the main criteria of FD. They were given a unified seven-point scale to estimate how often they had suffered from disturbances of the digestive function within the last 3 months. We included in our analysis the answers to questions #8 (heartburn), #17 (epigastric pain/ burning), #13 (postprandial fullness), and #15 (early satiety). The latter two questions described the intensity of same item - postprandial distress syndrome (PDS). Therefore, we took into account the answer with the highest value from the two. Question #8, describing the frequency of heartburn, gave an opportunity to use the criteria of GERD according to the Montreal Consensus 2006 and Vevey NERD Consensus 2009 [8, 9].
In each group, persons who abused non-steroidal anti-inflammatory drugs (NSAIDs) were counted. The criteria for this was regular consumption of more than two standard doses per week or a daily intake of low-dose aspirin.
Statistical analysis
Data are expressed as mean ± SEM (standard error of mean) for each of the measured parameters, PSG, and age. Gender, presence of cholecystectomy, erosions, and atrophy are expressed as a ratio or absolute number. Helicobacter pylori infection rates are expressed as percentages of the total patient number. An independent t-test was used to analyse data with a normal distribution (age, PSG, time of acid-neutralisation, etc.). To find out the relationship between data, we used Pearson’s parametric correlation coefficient. A p-value below 0.05 was considered statistically significant (always two-sided).
To test the statistical significance of differences in a classification system (four patterns of acidity) we used a 4 × 2 contingency table with χ2 test.
The association between hypoacidity and potential risk factors was measured by odds ratio with 95% confidence intervals (95% CI) as result of regression analysis by using a logistic model (enter method). Statistical data processing was carried out using «MedCalc 11.3.3.0» software (MedCalc Software bvba, Holland).
Results
As a result of the study, we found that average plasma PSG1 and PSG2 in clinical groups did not differ significantly (p > 0.05) (Table II). There was a predictable tendency towards higher concentrations in the groups of acid-related disorders – duodenal peptic ulcers and GERD. Only in the FD group were there people with biochemical signs of atrophic gastritis. They comprised 14.4% and almost all of them demonstrated during a pH test the absence of acid in fasting conditions and a delayed excitation of secretion after a provocative breakfast.
Table II
Plasma pepsinogens determined in clinical groups
The correlation analysis between the level of serum PSG1 and the parameters of the intragastric pH-test showed a moderate association. In particular, the correlation coefficients between the values of PSG1 were as follows: r = –0.534 (p < 0.0001) for the nadir pH in basal conditions (pH1); r = –0.531 (p < 0.0001) for the nadir pH during the first postprandial hour (pH2); r = –0.419 (p < 0.0001) for the nadir pH during the second postprandial hour (pH3); r = –0.487 (p < 0.0001) for the total time of acid neutralisation (t1); r = –0.541 (p < 0.0001) for the time of acid neutralisation in range > 3.5 (t2).
The best values were obtained for pH1 and t2. Japanese scientist Kinoshita et al. conducted research of the association between parameters of the 24-hour intragastric pH-metry and serum PSG1/PSG2 and found that the basal pH and time fraction with pH > 3 correlated best: r = –0.76 and r = –0.62, respectively [10]. Our best two parameters were almost consistent with them but a little bit lower due to the shorter duration of our test. Therefore, we tried, by applying them, to deduce some integrative index of stomach acidity.
Using receiver operating characteristic (ROC)-curve analysis among persons with normal range and serum PSG1 outside the permissible level, we determined the minimal pH1 cut-off values for predicting hyper-/normo-/hypo-acidic conditions. The t2 was calculated in the same way. It should be noted that there were a considerable number of patients with normal secretion, who did not produce acid in the basal condition but did so only after a meal. Among them an excitation of secretion with the stable achievement at pH < 3.5 appeared before 80 min. In our study, persons with hypoacidity, proven by PSG assay, usually demonstrated acidification after this time threshold (16 cases out of 18).
To improve the diagnosis, all 200-minute intragastric pH-tests with stimulating breakfast were visualised with special attention paid to the last two parameters (t2 and baseline pH1). It was proposed that the array of received data be divided into four classification variants according to the distinctive patterns of acidity (Table III). Increasing numbers of patterns reflect the rise in gastric secretion.
Table III
Patterns of gastric acidity as results of 200-minute intragastric pH monitoring test with a standardised breakfast
By conducting a correlation analysis of the obtained results, we identified a significant association between the value of described patterns and the level of serum PSG1; r = 0.667 (95% CI: 0.528–0.774; p < 0.0001).
Using as reference method the PSG assay, we conducted an ROC-analysis to evaluate informational value of the proposed methodology. In cases of hyperacidity (pattern #4) the AUC (area under curve) was 0.755 (95% CI: 0.647–0.844; p < 0.0001) with sensitivity 80% and specificity 66.67%. In cases of hypoacidity (pattern #1) the AUC was 0.964 (95% CI: 0.895–0.989; p < 0.0001) with sensitivity 88.9% and specificity 100%. The second AUC was significantly better (p < 0.05).
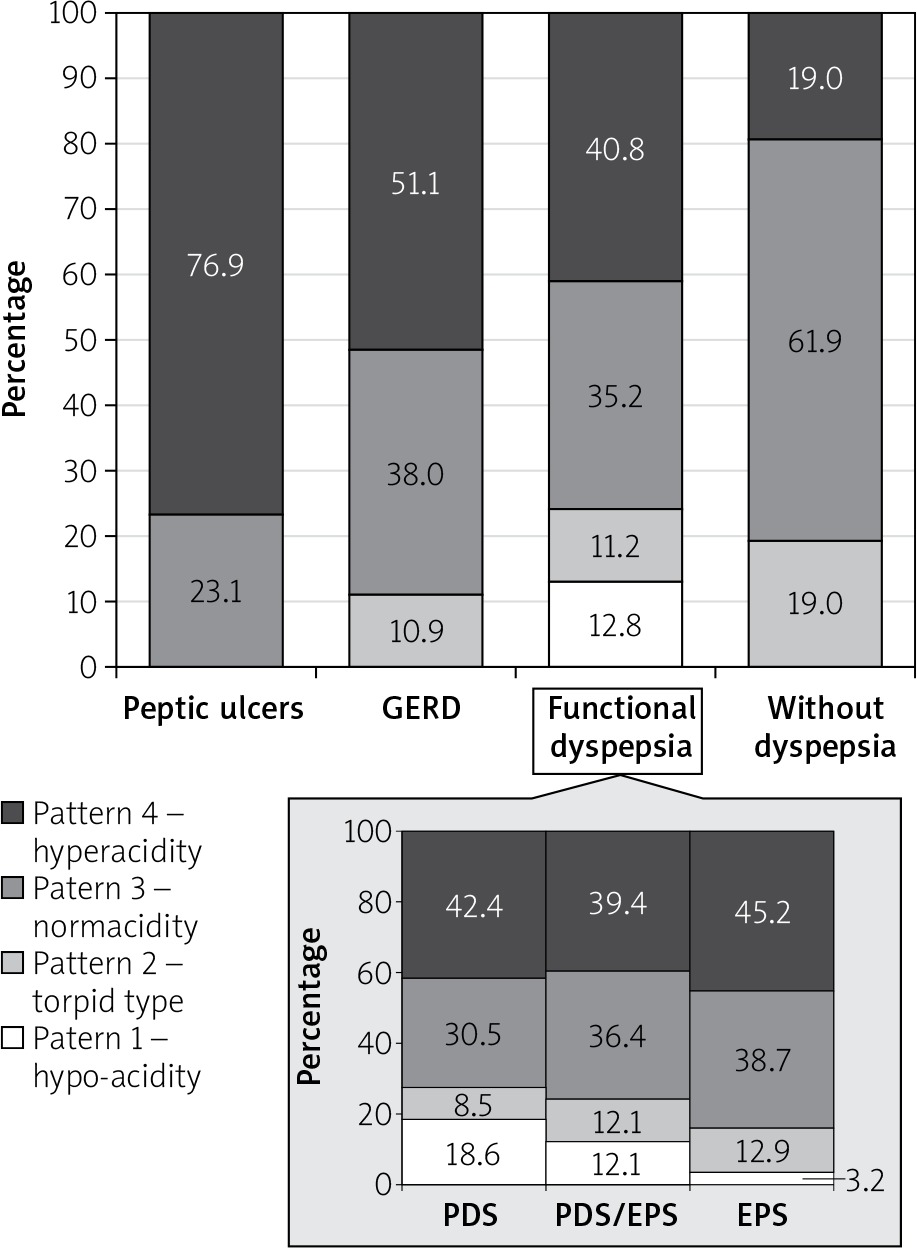
We tested our intragastric pH-test on the usual patient contingent, which included both functional and organic disorders. As expected, the highest acidity was demonstrated by the persons with duodenal PU (Figure 2). Patients with GERD also had hyperacidity in most cases. Between these two groups, we found no significant differences in the distribution according to the patterns of acidity (χ2 = 3.519; p = 0.1722), perhaps due to the small size of the PU group.
Patients with FD had a distribution of patterns with a tendency towards less acidic variants and had a significant difference with GERD (χ2 = 13.141; p = 0.0043) and PU (χ2 = 7.104; p = 0.0686). At the same time, the number of persons with hyperacidity was significantly greater than in the reference group “without dyspepsia” (χ2 = 9.129; p = 0.0276).
In all three subgroups of FD, persons with hyperacidity constituted an absolute majority (approximately 40%), and there was no significant difference between subgroups. Our results showed a significantly smaller number of persons with hypoacidity in the EPS vs. PDS (p < 0.050 by Fisher exact test). The subgroup of coexisting EPS/PDS contained a mix of people, thus it demonstrated an intermediate result (12.1%) that was insignificantly different from the subgroups of isolated PDS and EPS – 18.6% and 3.2%, respectively (Figure 2).
Figure 2
The distribution of patients by patterns of gastric acidity after a 200-minute intragastric pH-monitoring with a standardised breakfast
GERD – gastroesophageal reflux disease.
It should be noted that the 200-minute intragastric pH-test proposed by us was much more effective in detecting gastric atrophy than conduction of conventional endoscopy showing low sensitivity and specificity (Table IV). We did not take into account areas affected by atrophy. This can explain the low specificity due to the presence in this subgroup of patients with isolated antral atrophy assumed without decreasing the number of parietal cells. However, among our patients there were several cases with isolated antral atrophy and increased level of serum PSG1. This was the result of an obscure sign of atrophy in the corpus and a clear one in the antrum, which is typical for the dominant HP-associated gastritis with antro-fundal expansion of inflammation. This was the main reason for omitting the area of atrophy in our further analysis. The low sensitivity (37.5%) of endoscopy for atrophy is a more serious disadvantage, considering the consequences. In contrast, we found excellent sensitivity (88.9%) and specificity (100%) of our pH test using a PSG assay as a reference method.
Table IV
Distribution of patients according to results of 200-minute intragastric pH-test with a standardised breakfast and endoscopic findings
| Pattern | Atrophy revealed | Atrophy absent |
|---|---|---|
| #1 – «Hypo-anacidity» | 6 | 10 |
| #2–4 – «Preserved acidity» | 7 | 228 |
Only in the FD group were there persons with hypoacidity. We did not observe this state among patients with duodenal PU or GERD, or in non-dyspeptic subjects. Additionally, patients with previously successfully healed PU also did not have hypoacidity. In other subgroups there was a certain risk of having a reduced production of hydrochloric acid, and thus obvious signs of atrophic gastritis. Enter-mode multiple logistic regression analysis was performed to identify predictors of a hypo-anacidity (Table V). We analysed several factors such as gender, HP infection, erosions and atrophy revealed by endoscopy, pre-existing cholecystectomy, abuse of NSAIDs, and the presence of the PDS and/or EPS. In the analysis there were only 205 patients with FD and non-erosive GERD, because inclusion of persons with duodenal PU and endoscopic positive GERD did not make sense because their diagnoses were obvious and the probability of having atrophy of the stomach was low. The main intrigue concerns diseases that do not have a clear morphological presentation and frequently coexist: NERD and FD. In practice it is often difficult to distinguish between these two syndromes.
Table V
Comparison of clinical factors associated with hypo-anacidity in patients with FD and NERD using multivariate logistic regression analysis (method “Enter”). The coefficients of regression equation
The proven risk factors were only endoscopic signs of atrophy (OR = 5.914), age > 50 years (OR = 20.139), and clinical manifestation by PDS (OR = 9.821).
We performed analogous multiple logistic regression analysis to identify predictors in the opposite situation of the hyperacidity reflected by pattern #4 and did not find any variables significantly associated with this state.
Discussion
The main task of this study was to develop a simple affordable pH test for the evaluation of gastric acid production. The proposed four patterns of acidity describe the functional state of the stomach moderately objectively. The correlation coefficients calculated by us (r = 0.67) and the above-mentioned results from Kinoshita et al. [10] demonstrated a relatively low value due to the known fact that serum PSGs better reflect situations with hypoacidity. Their concentrations are determined by the number of chief cells and decrease in the case of gastric mucosal atrophy. In the situation of hyperacidity there are an increasing number of glands, hence the number of chief cells rise also. The hyperacidity is dependent not only on the number of glands but also, even more so, on the parietal cell proliferation. The clinical studies elucidating connections between PSGs and acidity were carried out on regular contingents of patients, in which the quota of persons with hypoacidity was relatively small and subjects with normal and increased acidity predominated. Thus, the obtained correlations were not very strong.
Intragastric pH-tests have a similar tendency. They excellently identify individuals with reduced production of acid [6]. However, the tests display only the concentration of hydrogen ions without volume and are unable to show acid output, and therefore approximately show the acidity in people with increased acidic production. In addition, the pH is a logarithm, and even small inaccuracies in the calibration significantly change the real concentration of hydrogen ions in acidic (low) range through the mathematical operation of raising to a power. In neutral range this is not so crucial. We confirmed a more accurate reflection of acid production in cases of hypoacidity vs. hyperacidity, comparing the parameters of the ROC curves in the identification of both states. In cases of hyperacidity (pattern #4) the AUC (area under curve) was 0.755 (95% CI: 0.647–0.844; p < 0.0001) with sensitivity 80% and specificity 66.67%. In cases of hypoacidity (pattern #1) the AUC was 0.964 (95% CI: 0.895–0.989; p < 0.0001) with sensitivity 88.9% and specificity 100%. It should be noted that the main practical task, which is solved by methods of assessing acidity, is the identification of patients with signs of atrophic gastritis. Consequently, an imperfect diagnostic value of pH-metric tests in cases of hypersecretory states is acceptable in regard to practical use.
Distribution by patterns in groups fully corresponds to the established concept of the highest level of acid production in patients with duodenal PU. A slightly lower level was seen in patients with GERD. In FD, acid production was noticeably lower than in acid-dependent diseases. The predominance of more acidic variants among patients with FD in comparison with non-dyspeptic subjects is very interesting.
In general, in the pathogenesis of FD, an excess of hydrochloric acid plays an important role. In a study on healthy subjects an acid infusion into the stomach induced PDS-like dyspeptic complaints [11]. In the same way the duodenal acidification increases sensitivity to gastric distension, induces proximal gastric relaxation, and inhibits gastric accommodation during a meal and in the postprandial phase [12]. Indirectly, the significance of acid confirms the clinical efficacy of PPIs and H2-blockers. Further proof is that in patients with FD elevated PSG1 and a higher ratio of PSG1/PSG2 is observed more often in comparison with non-dyspeptic persons [13]. Previous studies using the conventional gastric acid aspiration tests showed inconsistent results regarding gastric acid secretion in patients with FD. Tucci et al. did not reveal any difference between non-ulcer dyspepsia and healthy controls [14]. El-Omar et al., evaluating an HP-infected population, conversely found higher levels of acidity among dyspeptic patients in comparison with non-symptomatic subjects [15]; our results confirm this.
Approximately 40% of patients with FD in our study had hyperacidity without significant differences between subtypes. This finding contradicts the results of earlier pH-metric studies showing a higher prevalence of hyperacidity among persons with EPS [16, 17]. We noted the only insignificant trend. Although, it is a well-known fact that patients with EPS have better response to PPI [18], in our opinion, this is not a pretext for speculation about bigger amount of hyperacidic persons in EPS. The predominance of hypoacidity is key to explaining this issue.
Given the great practical importance of identifying hypochlorhydria, we tried to ascertain the most important associations by including in the multivariate logistic regression analysis suspicious variables: gender, age, HP-infection, erosions and atrophy revealed by endoscopy, pre-existing cholecystectomy, abuse of NSAIDs, and the presence of the PDS and/or EPS.
Finding of a decrease in gastric secretion with age is not so much confirmation of well-known age-related involution of gastric mucosa as an indicator of our regression model quality. The strong association of hypochlorhydria due to gastric atrophia with age over 50 years (OR = 20.139) confirms the statements of authoritative guidelines (NICE 2014, SIGN 68, etc.) about the necessity for endoscopy despite the lack of alarm symptoms in older individuals.
Despite the low informational value of conventional endoscopy in the detection of atrophy, revealed by us, the significance of this factor is so obvious that in our model an independent significant association was confirmed. In the Kyoto global consensus report on H. pylori gastritis 2015 [5] a conventional endoscopy without biopsy is considered an inadequate tool for diagnosing atrophy and intestinal metaplasia. Instead, it is necessary to widely use new equipment for image-enhanced endoscopy.
The existence of an association between hypoacidity and the PDS, as well as its absence with EPS, was not surprising. In most cases, patients with EPS suffer from pain, which is relieved by ingestion of a meal, or it occurs while fasting, due to an excess of acid temporarily neutralised by food. Therefore, in this subgroup, decreased acidity is much less common. We revealed only 1 person with hypoacidity in isolated EPS-subtype and 4 persons in coexisting EPS/PDS-subtype. Most of them had pains conversely induced by meal ingestion.
We confirmed the results of an endoscopic study performed by Chung et al., showing that subjects who had atrophic gastritis involved in the large area of the corpus were independently associated with a higher prevalence of PDS-related symptoms [19]. Another study from Japan revealed that the total symptom scores and PDS-related symptom scores were significantly higher in persons with gastric hypochlorhydria compared with the non-hypochlorhydria group [20].
Today it remains unclear what mechanism induces motor dysfunction associated with PDS in cases with advanced atrophy of the gastric corpus. PDS is associated with delayed gastric emptying or impaired proximal gastric accommodation to a meal. Presumably, the main cause is an increase in the level of gastrin, which is observed with the depletion of parietal cells. In a recent study of patients with autoimmune atrophic gastritis, Kalkan et al. found a significant association between delayed gastric emptying and serum gastrin, the degree of gastric atrophy, and inflammation of the mucosa [21]. A rat model showed retardation of gastric emptying by pentagastrin [22]. In a systematic review, Sanaka et al. argued that PPI-induced hypoacidity led to a delay in the solid food in the stomach [23]. However, he emphasised that consequent hypergastrinaemia was an assistance mechanism, and the main reason was the inhibition of hydrolytic digestion by acid-dependent peptic activity.
The production of ghrelin decreases at the atrophy of the corpus [24]; it has proven prokinetic properties and recently has been actively studied for the creation of new pharmacological preparations for the treatment of PDS [25].
Changing in production somatostatin observed among persons with atrophy show discrepancy with the expected derangements of motility of the stomach. Because somatostatin is decreased in atrophic gastritis and ceases to inhibit the production of hydrochloric acid, gastric acid secretion might be increased and provoke EPS-related symptoms [26].
We did not confirm associations with others variables, but in some prototype studies a significant inclination towards atrophy among males was revealed [19].
The current study has several strengths. First, the sample size was large enough, providing sufficient statistical power for analysis. Second, individuals undergoing health check-ups are appropriate for studying the relationship between acidity and specific subtypes of dyspeptic symptoms, including persons with regular organic derangements and subjects without dyspeptic complaints. Nevertheless, the current study has several limitations. First, at endoscopy, two antral and two corpus biopsy specimens were not taken for histological assessments. Second, cases with gastric atrophy were not subdivided into categories according to propagation of changes [27]. Third, the symptoms were not estimated daily using diaries and scale of intensity; instead, symptoms were assessed using subjective recall and only by frequency of complaints.
Conclusions
The proposed 200-minute intragastric pH monitoring with a standardised breakfast is a simple reliable tool that can detect clinically significant acid disturbances with more accurate detection of hypoacidity.
In patients with FD in comparison with non-dyspeptic persons, acid production is increased. There is a small proportion of patients with FD (12.1%) with biochemical and pH-metric signs of hypochlorhydria due to atrophic gastritis. The latter was independently associated with age over 50 years (OR = 20.139), PDS-related symptoms (OR = 9.821), and endoscopic signs of atrophy (OR = 5.914).