


INTRODUCTION
Allergic systemic reactions to Hymenoptera venom – primarily from bees, wasps, hornets, and bumblebees – affect up to 7.5% of the European population [1]. Approximately 56–95% of people have experienced a sting from a Hymenoptera insect at some point in their lives [2]. These allergies represent type I hypersensitivity reactions mediated by allergen-specific IgE antibodies. Symptoms range from large local reactions to systemic manifestations characteristic of anaphylaxis [3]. In Europe, bee and wasp venoms are the most common causes of severe anaphylactic reactions in adults and the second most frequent causes in children [2].
Hymenoptera venom contains a diverse array of compounds, including low-molecular-weight substances such as biogenic amines, lipids, bicarbonates, and cationic peptides, as well as high-molecular-weight proteins that serve as allergens [4]. These components can provoke either toxic or allergic reactions in humans. Enzymes, which constitute the majority of allergens, are primarily responsible for systemic reactions, while low-molecular-weight venom components are generally considered to cause toxic local effects [5, 6]. Honeybee venom, described in the 1970s, contains four primary allergens: phospholipase A2, hyaluronidase, acid phosphatase, and melittin. In contrast, the key allergens identified in wasp venom include phospholipase A1, hyaluronidase, and antigen 5 [7–9]. The complexity of Hymenoptera venoms suggests that their effects extend beyond immunological aspects, potentially influencing the metabolomic profiles of patients with this type of hypersensitivity.
Metabolomics arose as a novel field in allergy research, apart from recently introduced presumed factors in that condition including microbiota or even psychological aspects [10, 11]. The increasing interest in the contribution of metabolites to physiological and pathological conditions has revealed novel roles for families such as sphingolipids [12]. This research field has expanded to include immune-related aspects of sphingolipids, with demonstrated influences on macrophages, IL-17-producing cells, and regulatory T cells [13–15].
Among the sphingolipids investigated, ceramide and sphingosine-1-phosphate (S1P) have recently been shown to possess properties that can affect the course or even the onset of allergic diseases. These properties include the regulation of immune cell chemotaxis, proliferation, and differentiation, induction of inflammatory signals, and effects on epithelial surface integrity [16]. In addition, sphingomyelins have been implicated in mast cell activation as a source of ceramides, which mediate the release of inflammatory mediators such as histamine [17]. However, the role of these metabolites in allergic reactions in humans, including hyperreactivity to Hymenoptera venom, remains poorly understood.
MATERIAL AND METHODS
PATIENTS
A group of 20 patients allergic to Hymenoptera venom (10 bee and 10 wasp venom allergic subjects) was enrolled in the study, with peripheral blood collected by venipuncture at the time of diagnosis. The allergy diagnosis and blood collection were performed approximately 4 to 6 weeks after incidence of an anaphylactic reaction to bee or wasp sting. The sex- and age-matched control group comprised 10 subjects with allergic, cancer, autoimmune, and other inflammatory diseases excluded. Informed written consent was obtained from all participants. Allergy to specific allergens (bee or wasp venom) was confirmed with a combination of in-depth medical history, total IgE levels, presence of allergen-specific IgE, and skin prick test (SPT) and intradermal test (IDT) with specific allergens. All the procedures for diagnosis of insect venom allergy were performed in accordance with currently approved guidelines [18]. Plasma and peripheral blood mononuclear cells (PBMC) were isolated from the collected blood.
DIAGNOSTIC TESTING WITH SPECIFIC ALLERGENS
Skin prick tests (SPT) were implemented with specific bee or wasp venom extract (Venomenhal; HAL Allergy B.V., Holland), at a concentration ranging from 0.01 μg/ml to 100 μg/ml. The results were read after 15 min and when negative, 10-fold higher concentration of venom was applied until the dose of 100 μg/ml or positive reaction observed. In case of allergy suspected patients but negative SPT results, intradermal testing (IDT) was performed. IDT was conducted using bee or wasp venom solutions ranging from 0.001 μg/ml to 1.0 μg/ml. In addition to total IgE measurement, sIgE testing was performed when SPT and IDT yield negative or inconclusive results, patient at high risk of anaphylaxis, skin conditions (damaged or diseased skin) or interfering medication used (antihistamines). ImmunoCAP (Thermo Fisher Scientific Inc., USA) diagnostic tests were used for detection of IgE specific for bee (Apis mellifera i1) and wasp (Vespula vulgaris i3) venom extract.
METABOLITES EVALUATION IN PLASMA
The targeted metabolomics analysis was performed using liquid chromatography coupled with tandem mass spectrometry – 6470 LC–MS/MS (Agilent Technologies), with the implementation of methodology and reagents included in the AbsoluteIDQ® p180 kit (Biocrates Life Sciences AG) [19]. Quantitative measurement of 10 sphingolipids was performed, including sphingomyelin C16:0 (SM C16:0), C16:1 (SM C 16:1), C18:0 (SM C18:0), C18:1 (SM C18:1), C20:2 (SM C20:2), C22:3 (SM C22:3), C24:0 (SM C24:0), C24:1 (SM C24:1), C26:0 (SM C26:0), C26:1 (SM C26:1) (Table 1). Preparation of samples was performed as described previously [20]. Spectral data processing and quantification were conducted using MetIDQ software (version Oxygen DB110-3005-290, Biocrates).
Table 1
List of selected metabolites investigated in studied groups of Hymenoptera venom allergy and control group. Indication of abbreviations used, extended metabolite name, and the Human Metabolome Database number (HMDB)
FLOW CYTOMETRIC ANALYSIS OF REGULATORY T CELLS
Fluorochrome-conjugated monoclonal antibodies were used for the detection of regulatory T cells (Tregs) in PBMC: anti-CD4 FITC (clone RPA-T4) and anti-Foxp3 AlexaFluor647 (259D/C7) (BD Bioscience). Extracellular staining of CD4 on T cells was followed by permeabilization (FACS Permeabilizing Solution 2) and intracellular staining of the Foxp3 transcription factor. Cells fixated in 1% paraformaldehyde were later subjected to acquisition on FACS Calibur flow cytometer (BD Bioscience, San Jose, CA, USA). Data processing was performed using FlowJo software (Tree Star Inc., Ashland, OR, USA). Tregs were distinguished based on morphological properties: relative size (forward scatter, FSC) and relative granularity (side scatter, SSC), and presence of CD4 marker on the cell surface (CD4+ helper T lymphocytes (Th)) and intracellular expression of Foxp3 (forkhead box P3) (immunosuppressive activity marker). Data were presented as the frequency of CD4+Foxp3+ T cells (Tregs) within the lymphocyte pool.
STATISTICAL ANALYSIS
The obtained data were processed using GraphPad Prism 9.0 biostatistical software (GraphPad Software Inc., San Diego, CA, USA). Depending on the data distribution, parametric (t-tests) or non-parametric (Mann-Whitney) tests were implemented for group comparison. Correlation analysis was performed with Pearson (parametric) or Spearman (non-parametric) test for the presence or lack of normal Gaussian distribution, respectively. The significance level was set at p < 0.05, indicated on the graphs as exact p-value or asterisks: * – p < 0.05. Post-hoc analysis of the study power demonstrated value within the range of 70–98% depending on additional stratification implemented.
RESULTS
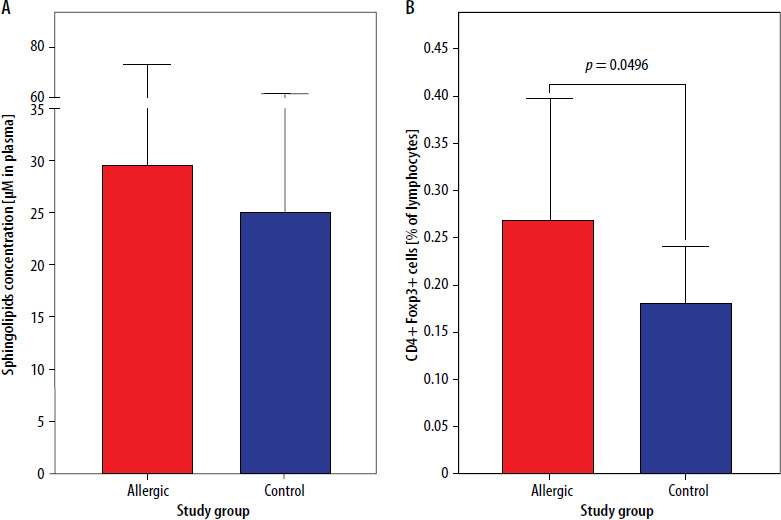
Initial results showed no significance in the context of total sphingolipids concentration in plasma between patients allergic to Hymenoptera venom and control group subjects (p = 0.3799) (Figure 1 A). The same groups showed a difference in regulatory T cells frequency (p = 0.0496), with elevated values of CD4+Foxp3+ cells in allergic patients (Figure 1 B).
Figure 1
Concentration of total sphingolipids in plasma (A) and frequency of regulatory T cells (Tregs) (B) in freshly diagnosed Hymenoptera venom allergic patients and control group. Data were presented as mean values with standard deviation, and significant differences were indicated with exact p-values
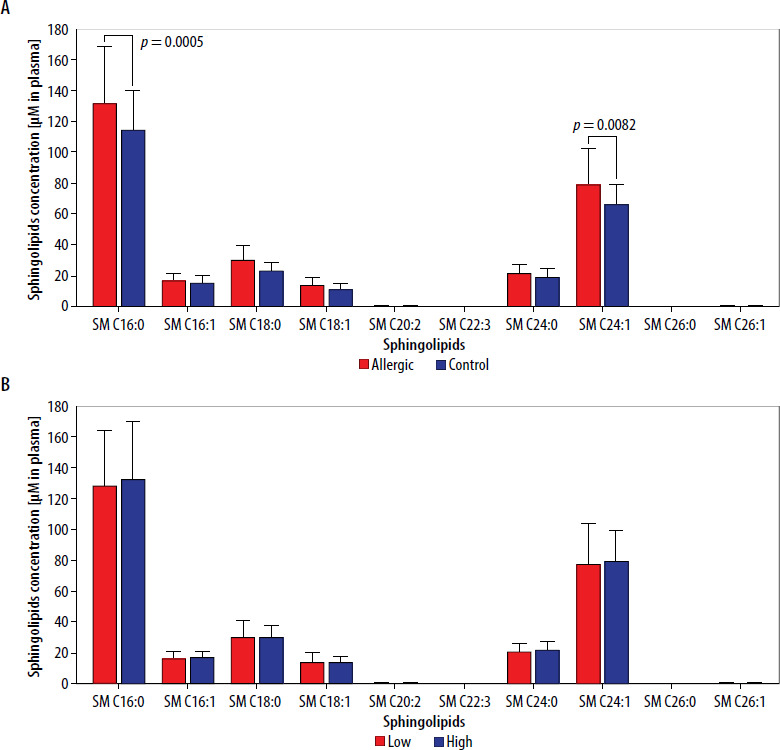
Subsequent analyses focused on individual selected metabolites belonging to the sphingolipids’ family. Detailed evaluation of variations between Hymenoptera venom-allergic patients and control group revealed significantly higher concentrations of SM C16:0 (p = 0.0005) and SM C24:1 (p = 0.0082) in the first group (Figure 2 A). Additional stratification of allergic patients into groups with low/high levels of Tregs (based on mean value of 0.269%), allowed for determination of that immunosuppressive cell population influence on the selected sphingolipids concentrations in plasma. Stratification into low/high Treg frequencies showed no effect on any differences in the metabolites within allergic patients’ group (Figure 2 B).
Figure 2
Concentration of selected plasma sphingolipids (SM) in patients allergic to Hymenoptera venom and control group (A). Additional stratification within allergic group into low/high frequency of Tregs and visualization of the metabolite levels (B). Data were presented as mean values with standard deviation, and significant differences were indicated with exact p-values
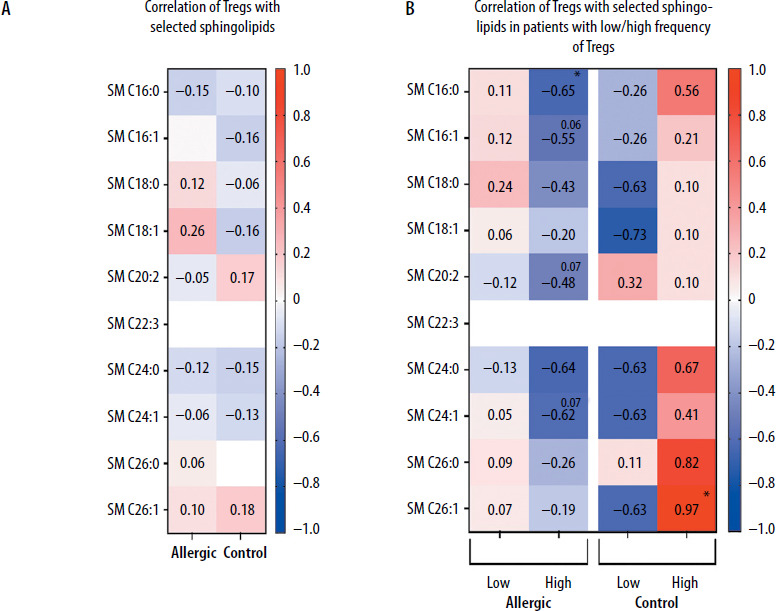
Despite no low/high Treg levels influence on selected sphingolipids concentrations, we further decided to verify whether regulatory T cells correlate with those plasma metabolites. At first, we did not demonstrate any substantial associations between immunological and metabolomic parameters (Figure 3 A). However, the division of patients into those with low/high frequency of Tregs affected mutual relationships of these (based on the mean value of 0.269% for allergic and 0.181% for control group). Regulatory T cells were found to correlate negatively in a moderate/strong manner in allergic patients with their high levels, with SM C16:0 (p = 0.0208). The tendency for similar associations was also shown in reference to SM C16:1 (p = 0.0603), SM C20:2 (p = 0.0734), and SM C24:1 (p = 0.0667). We did not observe such phenomenon in the control group, with negative correlations rather present in subjects with low Tregs group, yet not statistically significant. The only significant association in the control group was shown in high-frequency Tregs subjects, where a strong positive correlation was reported between Tregs and SM C26:1 (p = 0.0333) (Figure 3 B).
Figure 3
Demonstration of correlations between regulatory T cells (Tregs) and selected plasma sphingolipids (SM) in Hymenoptera venom allergic patients and control group subjects (A). Additional stratification within studied groups into subjects with low/high frequency of Tregs was implemented (B). Data presented as heat-maps showing correlation coefficient values and statistical significance indicated with asterisks or p-values in case of tendencies (*p < 0.05)
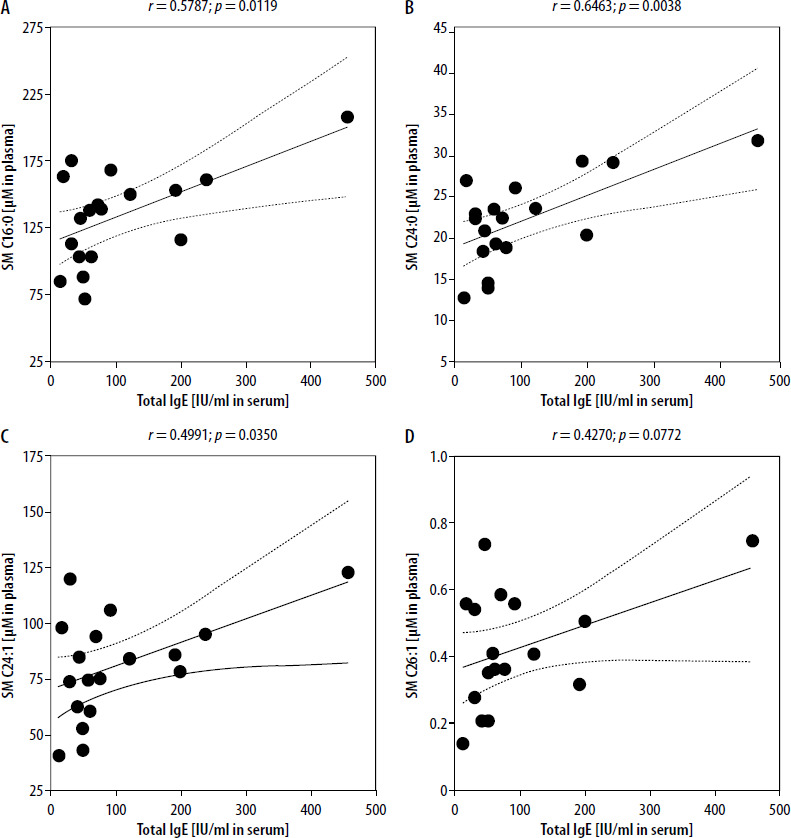
Considering significant associations between selected plasma metabolites and regulatory T cells, we intended to assess sphingolipids’ relation to the mediator of allergic reactions – IgE. Among all tested metabolites, moderate/strong positive correlations were demonstrated between total serum IgE and SM C16:0 and SM C24:0 (Figures 4 A, B). Slightly weaker, yet still moderate and positive associations were reported in total IgE and SM C24:1 or SM C26:1 sphingolipid (Figures 4 C, D).
Figure 4
Significant correlations between total serum IgE and selected sphingolipids: SM C16:0 (A), SM C24:0 (B), SM C24:1 (C), and SM C26:1 (D). Correlation coefficient (r) and statistical significance (p) values are demonstrated. Plotted associations supported by regression line (solid line) and 95% confidence bands (dashed line)
DISCUSSION
Metabolomics in allergic diseases remains a largely unexplored field despite the increasing volume of research. Among recently identified metabolite groups, sphingolipids have been found to play significant roles in allergic conditions such as skin allergies, asthma, and food allergies [16]. The role of sphingolipids may be tied to their previously characterized functions in maintaining cellular membrane integrity and influencing immune cell homeostasis [21]. However, a more detailed investigation of circulating metabolites from this family is required to broaden our understanding of their characteristics and involvement in hyperreactive conditions. While the discussion references other allergic conditions, such as asthma and food allergies, it is important to note that the findings of this study are based on a specific allergic condition – Hymenoptera venom allergy. Therefore, the extrapolation of these findings to other allergic conditions should be done cautiously, given the limited generalizability of the study. In this study, we aimed to evaluate the previously unknown interplay between plasma sphingolipids and regulatory T cells (Tregs) in patients with Hymenoptera venom allergy.
Our initial findings demonstrated that selected sphingomyelins – specifically SM C16:0 and SM C24:1 – were elevated in allergic patients compared to the control group. This observation may reflect increased immune cell activity resulting from the hyperreactive state. Specific sphingolipids, such as sphingosine-1-phosphate (S1P), have influenced T cell differentiation by inhibiting Tregs and promoting a shift toward Th1 development [22]. Considering their specificity, these metabolites may serve as potential novel biomarkers for Hymenoptera venom allergy.
Patients with Hymenoptera venom allergy in our study exhibited elevated frequencies of CD4+Foxp3+ regulatory T cells compared to controls. This could potentially represent a compensatory mechanism to mitigate heightened immune activation [23]. Interestingly, that could support our previous observation that challenge with Hymenoptera venom allergen potentially affects Tregs through decline in IL-7R (CD127) – characteristically lowered in those immunosuppressive cells [24]. Such mechanisms have been described in other contexts, such as food allergy, where higher Treg frequencies have been associated with more favorable outcomes and an increased likelihood of achieving tolerance [25, 26].
Stratification of allergic patients based on Treg levels revealed that in individuals with high Treg frequencies, these cells correlated negatively with specific sphingomyelins, including SM C16:0, SM C16:1, SM C20:2, and SM C24:1. This suggests that regulatory T cells may be influenced not only by immune status but also by the sphingolipid profile in allergic conditions. Previous research has shown that certain sphingolipids can inhibit Treg proliferation and suppress their activity [27]. Our findings are indirectly supported by studies on acid sphingomyelinase (ASM) in allergic asthma, which reported increased Foxp3-expressing Tregs in the absence of ASM, an enzyme responsible for breaking down membrane sphingomyelin into circulating metabolites [28]. The absence of these relationships in the control group highlights the unique metabolic and immunological landscape of allergic individuals. Furthermore, the positive correlation of sphingomyelin C26:1 with Tregs underscores the potential role of this metabolite in Treg expansion as suggested by recent research into the broader sphingolipid family [13].
Assessment of correlations between sphingolipids and the allergic reaction mediator IgE revealed significant associations with specific sphingolipids, including SM C16:0, SM C24:0, SM C24:1, and SM C26:1. These findings support the hypothesis that sphingolipid metabolism is closely linked to IgE-driven allergic mechanisms. For instance, studies on allergy development in an asthmatic mouse model demonstrated increased sphingosine-1-phosphate (S1P) levels, which correlated with the severity of airway hyperreactivity [29]. Additionally, reduced ASM activity, presumably leading to decreased sphingomyelin breakdown products, was associated with a decline in serum IgE levels as observed in studies on airway tolerance [30].
More extensive, multicenter cohorts are necessary to validate these findings and evaluate their clinical potential, especially due to a small sample size that is one of the study limitations. Functional experiments, constituting another limitation, would be essential for directly assessing the effects of specific sphingolipids on regulatory T cells and B cells, which are the primary source of the allergy mediator IgE. Such investigations could provide deeper mechanistic insights. Future studies should aim to elucidate the causal relationships between lipid metabolism and immune regulation.
CONCLUSIONS
Our study identified distinct immunometabolic profiles in Hymenoptera venom allergy, characterized by elevated sphingolipid levels and their correlations with Tregs and IgE. These results, yet preliminary, suggest that specific sphingolipids may play a role in modulating immune responses in allergic individuals. Better understanding of the interactions between sphingolipids and Tregs could reveal novel mechanisms underlying hyperreactivity to Hymenoptera venom. Moreover, this knowledge has the potential to pave the way for new diagnostic and therapeutic strategies.