INTRODUCTION
Multiple sclerosis (MS) is a chronic inflammatory auto immune degenerative disease of the central nervous system (CNS) [1] that leads to physical and neuropsychological disability [2]. The disease is prevalent worldwide and is one of the leading causes of disability in Europe [3]. MS can result in cognitive deterioration in at least 50% of patients, even in the early stages of the disease [4]. Psychological stress and anxiety have a negative impact on cognitive function [5]. The level of intelligence and education provide some cognitive reserve, which influences the resilience of the brain when some of its structures are damaged [6]. Identification of patients at risk for cognitive dysfunction can be an initial step in introducing measures aimed at modifying the risk factors. Early diagnosis of memory impairment in patients with MS can allow holistic care, including the identification of motor-unrelated relapses [7].
The causes of MS are multifactorial and are still not fully understood [8]. The inflammatory process is related to damage to the blood–brain barrier (BBB), multi-focal perivascular infiltration of inflammatory cells, damage to the myelin sheath, loss of axons and oligodendrocytes and secondary astroglial hypertrophy [9]. The cascade of the inflammatory and degenerative processes is most likely triggered by autoimmunity, which can be initiated by various environmental and genetic factors [10].
Epidemiology
Among Europeans, MS is the most common cause of non-traumatic neurological disability in young adults [11]. The prevalence of the disease ranges from 40-150 cases per 100,000 inhabitants in Europe and the United States; the disease mainly affects young Caucasian adults around the age of 30 [12]. Approximately 2.5 million people worldwide are diagnosed with MS [13]. The incidence and prevalence of the disease increase with latitude in the regions of temperate climates; MS is rare in the tropics and subtropics [14]. Approximately 40,000 patients are diagnosed with MS in Poland and about 2,000 new cases are diagnosed annually. Prevalence in Poland was estimated at 109.1/100,000 (149.8/100,000 in women and 66.5/100,000 in men) [3].
Criteria and diagnosis of multiple sclerosis
MS was first described by Jean-Martin Charcot in 1868. Different criteria for the diagnosis of it have been developed over the years. The McDonald Criteria were introduced in 2001, with modifications introduced over the following years [15]. In 2017 the criteria were modified on the basis of magnetic resonance imaging (MRI) in MS (MAGNIMS) [16]. Further updates to these criteria will allow earlier diagnosis and therapy [17].
MRI of the nervous system is essential for the diagnosis of MS and in the search for different radiological features that do not confirm this diagnosis [18]. MAGNISM and the Consortium of Multiple Sclerosis Centers proposed standardized magnetic resonance protocols for the diagnostic process in MS [16]. The Polish Medical Society of Radiology recommendations helped to standardize the imaging examination of patients with MS in all MRI centres [19].
Clinical assessment of the progression of the disease
The Expanded Disability Status Scale (EDSS), which was first described by John Kurtzke in 1955, is an instrument for assessing motor disability in MS patients [20]. The complete version of the EDSS translated into Polish was published in the Polish Neurological Review in 2017 [21]. Further modifications of the EDSS have contributed to the development of an independent platform for the training and certification of physicians (www.neurostatus.net).
The Multiple Sclerosis Functional Composite Battery (MSFC) is a tool for quantitative functional assessment of MS patients developed by Cutter et al. in 1999 [22]. The three components of the MSFC are used to assess leg function, ambulation, hand function and cognitive functions. A timed 25-Foot Walk (T25-FW) is used to evaluate lower extremities and ambulation, the patient is instructed to walk 25 feet as quickly but safely as possible [23]. The Nine-Hole Peg Test (9HPT) is used to assess upper extremity function; this evaluates the performance of each limb separately, both the dominant and non-dominant hands are tested twice [24]. The Paced Auditory Serial Addition Test (PASAT) is the third component of the MSFC, used to measure cognitive functions (assessment of auditory information processing speed and flexibility as well as calculation ability) [25].
Cognitive dysfunction in multiple sclerosis
Some patients present with relatively subtle cognitive impairment, such as difficulty with word retrieval, while others cannot recall important information they once knew [4]. Information processing and memory are the most commonly affected cognitive domains in MS [4], and cognitive processing speed is a primary factor affecting daily activities and participation in everyday life [26].
Brain atrophy in MS patients progresses more rapidly in comparison to healthy individuals, with the brain volume decreasing by 0.5-1% per year in MS patients compared to 0.1-0.3% in healthy individuals [27]. The extent of CNS damage and localization of brain lesions vary among MS patients. Therefore, as cognitive dys-function varies neuropsychological tests are considered the most sensitive methods for detecting cognitive dys-function [28]. The testing methods proposed by Rao in 1991 are extremely useful (Rao’s Brief Repeatable Battery; BRB) [6]. These tests include the Symbol Digit Modalities Test (SDMT) [29, 30] used to assess patient attention [31] and the PASAT test to assess working memory. Both tests are also applied to evaluate concentration, sustained attention and the speed of cognitive processes [26]. The Selective Reminding Test (SRT) and the Selective Reminding Test Delayed (SRT-D) assess short- and long-term memory [32]. In 2018, recommendations were issued for evaluating the cognitive domains of MS patients [26]. They were approved by the Consortium of Multiple Sclerosis Centers and the International Multiple Sclerosis Society. The society recommends early initial testing using the SDMT or a similarly validated test when the patient is clinically stable [26]. To assess cognitive function, experts recommend the Brief Repeatable Neuropsycho-logical Battery (BRNB) [33]. The Minimal Assessment of Cognitive Function in MS (MACFIMS) [34] is also recommended. It takes about 90 minutes and includes PASAT, SDMT, BVMTR, the California Verbal Learning Test (CVLT) [35], the Judgment of Line Orientation (JLO) test [34], and the Delis-Kaplan Executive Function System Sorting Test (D-KEFS ST) [36]. In January 2020, Polish recommendations of the Section of Multiple Sclerosis and Neuroimmunology of the Polish Neurological Society for the treatment and symptomatic management of MS patients were developed [37]. Currently, the following neuropsychological tests are recommended: BICAMS and SDMT or BRNB. The second recommendation is related to the application of MACFIMS and the 3-second PASAT. Table 1 shows the tools used to assess cognitive dysfunction in MS patients.
Table 1
Batteries of neuropsychological tests used in the diagnosis of MS (source: https://www.msif.org)
[i] BRB-N – Brief Repeatable Battery for Neuropsychological evaluation, MACFIMS – Minimal Assessment of Cognitive Function in MS, SDMT – Symbol Digit Modalities Test, PASAT – Paced Auditory Serial Addition Test, D-KEFS sorting test – Delis Kaplan Executive Function System sorting test, SRT – Selective Reminding Test, CVLT-II – California Verbal Learning Test, SPART – Spatial Recall Test, BVMT-R – Brief Visuospatial Memory Test, Revised version, WLG – Word List Generation, COWA – Controlled Oral Word Association test, JOL – Judgement of Line Orientation test
Aim of the study
The aim of this study was to compare the results of the selected neuropsychological tests in patients with newly diagnosed MS in relation to the selected volumetric brain measurements assessed by MRI.
The following research hypotheses were adopted:
There is an association between atrophic changes in brain structures and the severity of cognitive dysfunction in MS patients.
The severity of cognitive dysfunction is related to MS duration.
Cognitive dysfunction increases with the degree of disability assessed by the EDSS.
Cognitive dysfunction does not depend on the gender of the patient.
The progression of cognitive dysfunction is related to the severity of brain atrophy.
METHODS
The study group consisted of patients with newly diagnosed MS treated in an MS centre. In accordance with the standards of the centre, each patient underwent functional assessment using the MSFC and evaluation of cognitive function using the battery of tests. The patients also underwent head MRI with the assessment of the volume of the cortex and subcortical structures. Seventy-six patients (21 men and 55 women) with MS diagnosed based on the 2017 McDonald criteria were enrolled in the study. Functional status was assessed using the Kurtzke EDSS. Psychological assessment and head MRI were performed before initiating immunomodulatory treatment and after 12 months of follow-up.
Head MRI examinations were performed according PLTR recommendations [38], using standard sequences for head MRI and a 3D T1 volumetric sequence, which is part of the protocol for examining MS patients [38]. The examinations were conducted with a 1.5 T General Electric HDx MR. The study assessed images obtained using 3DT1 FSPGR IR (TR/TE/TI:11.6/5/150/450) with a layer thickness of 1 mm. The evaluated parameters were calculated using FMRIB Software Library (FSL) v5.0 (SIENAX; Analysis Group, FMRIB, Oxford, UK). The software uses cranial measurements to spatially normalize the image compared to the standard image. The standard error is estimated at 0.5-1% when the brain volume is measured at a single time point. Cortical reconstruction and volu metric segmentation were performed using the FreeSurfer image analysis package, which is documented and available for free download online (http://surfer.nmr.mgh.harvard.edu/).
The MRI scan was performed on the same MR machine and assessed by the same radiologist.
The following volumetric parameters were evaluated in each patient:
partial brain volume,
total volume of the grey matter,
volume of the cerebral cortex,
volume of supratentorial structures,
estimated total intracranial volume.
To assess cognitive function, the group of patients was evaluated using the following tests: SDMT, PASAT3”, SRT, SRT-D, BVMT-R and BVMT-RD. In all subjects, the following tests were performed: SDMT – oral version, which reflects the speed of information processing; PASAT3” – two versions of the test alternatively, which assesses the ability and speed of information processing and sustained and divided attention; SRT and SRT-D adapted to verbal learning and memory [39]; and BVMT-R and BVMT-RD, assessing visuospatial memory [33, 40]. The first assessment was performed immediately after the diagnosis was established and before the administration of treatment affecting the course of the disease. Another assessment was performed after 12 months of follow-up. The same procedures were performed each time. A 12-month interval between tests reduces the risk of learning influencing the results. The tests were conducted by the same specialist under the same environmental conditions. Before the cognitive tests were performed, patient history was taken to exclude fatigue, sleep deprivation, stressful situations, or other factors that could affect the results. Neurological and functional evaluations were also performed to exclude relapse. All the procedures lasted about 90 minutes. After 12 months of follow-up, the patients were treated with interferon β-1a or inter-feron β-1b or glatiramer acetate.
Table 2
Patient characteristics
The analysis of quantitative variables (i.e., expressed by the number) was carried out by calculating the mean, standard deviation, median, quartiles, minimum and maximum values. The analysis of qualitative variables (i.e., those not expressed by a number) was carried out by calculating the number and percentage of the occurrence of each value. Quantitative variables were compared in the groups using the Mann-Whitney U test. Correlations between quantitative variables were analysed using Spearman’s correlation coefficient. A p < 0.05 was considered statistically significant.
Univariate and multivariate analysis of the effect of multiple variables on the quantitative variable was performed using linear regression. The results are presented in the form of regression model parameter values with a 95% confidence interval.
The analysis was performed in R version 4.0.3. R Core Team (2020). R: A language and environment for statistical computing. R Foundation for Statistical Computing, Vienna, Austria (https://www.R-project.org/).
RESULTS
Seventy-six patients were enrolled in the study. Fifty-two of them remained after 12 months of follow-up. MRI and cognitive tests were performed in 47 patients. During follow-up, 24 patients changed the treatment centre or were included in the clinical trial. Another group of patients was excluded due to technical reasons (i.e., poor quality of MRI, inability to perform procedures at the right time, or random events).
Finally, 47 patients aged between 26 and 36 years (mean age 33 years; 36 women – mean age 33.5 years; 11 men – mean age 33 years) were enrolled for another assessment after 12 months of follow-up. The disease duration in months from the first symptoms to diagnosis ranged from 1 to 84 months. The duration of education ranged from 11 to 23 years. Functional status, as assessed by the EDSS, ranged from 1.5 to 4.5 points. At the beginning of follow-up, the neurological status assessed by the EDSS was good in 80% of patients (EDSS < 3.0 points). The characteristics of the study group are given in Table 2. The following were considered: patients’ age, the duration of MS from the first symptoms of the disease, education (in years), and the degree of disability assessed by the EDSS. They were mostly right-handed subjects who worked and did not require assistance. Only one patient required some assistance due to impaired visual acuity.
The analysis of the data at baseline
Statistically non-significant differences were obtained in terms of gender for the following cognitive tests: SDMT, PASAT3”, SRT, SRT-D, BVMT-R and BVMT-RD (Table 3). The results of the volume calculations at baseline are given in Table 4. All parameters were significantly higher in men.
Table 3
Cognitive test scores
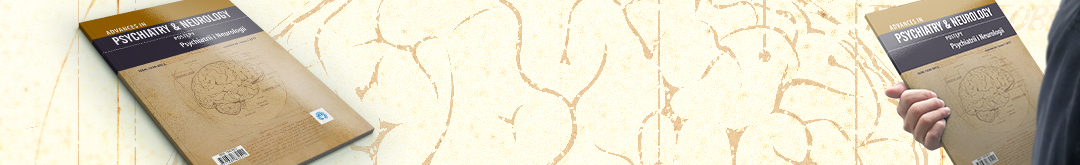
The baseline examination comparing cognitive test results with the volumetric measurements on MRI showed no significant correlations in the cohort of patients (all p > 0.05). Figure I (the heat map) shows the correlation coefficients between the analysed variables. Blue areas represent positive correlations (correlation coefficient r > 0), red areas represent negative correlations (r < 0), and white areas show no correlations. No significant relationships were found between disease duration and cognitive test scores (all p > 0.05).
Analysis of the data obtained based on examination results after 12 months of follow-up
The study group underwent another evaluation 12 months after the baseline assessment. We used the same measurement tools that were applied at baseline. Results were obtained from 46 patients. One patient had an exacerbation of the depressive syndrome. For this reason, these data were not calculated.
The analysis of cognitive function scores after 12 months of follow-up showed correlations that were not statistically significant (all p > 0.05) according to gender. The mean scores were higher after one year in the following tests: SDMT, PASAT3”, SRT, SRT-D and BVMT-R. The patients had average scores of 65/110 (SDMT), 52/60 (PASAT3”), 56/72 (SRT), 10/12 (SRT-D), 26/36 (BVMT-R) and 10/12 (BVMT-RD). Of note, during the evaluation after 12 months, all subjects were receiving disease-modifying therapy.
Table 4
The results of volumetric parameters
As in the case of cognitive assessment, MRI examination was performed 12 months after the first MRI. Volumetric analysis is given in Table 5. The results of the patient with an exacerbation of the depressive syndrome and the results of the subjects who were on oral steroids were excluded from the statistical analysis due to the effect of drugs. The results were correlated in terms of gender. Calculations performed after 12 months showed statistically significantly higher volu-metric measurements in men. The percentage differences between the data from the baseline examination and after 12 months are given in Table 6. The smallest difference was found in the estimated total intracranial volume (8.91%) in men at baseline and after 12 months of follow-up (9.1%). The largest difference was observed for partial brain volume (higher value in men by 15.43% at baseline and 11.42% after 12 months of follow-up). No significant relationships were found in the assessment of the relationships between the volumetric measurements and cognitive test scores after 12 months of follow-up (all p > 0.05). Figure II shows the relationships between the study variables. Positive correlations were obtained between the volumetric parameters and the PASAT3” score. For SDMT, correlations were found with all volumetric measurements except for the estimated total intracranial volume. This parameter poorly correlated with the results of other cognitive tests.
Assessment of progression of cognitive impairment in MS patients
A comparative evaluation of cognitive test scores was performed between the baseline assessment and after 12 months of follow-up. Statistically significant values (p < 0.05) were found in terms of changes in cognitive test scores for SDMT and PASAT3”. The scores of SDMT and PASAT3” were significantly higher during the second measurement. However, the scores of other tests did not change statistically significantly after 12 months. During the second measurement, the SDMT score was, on average, 4 points higher compared to the baseline score. In turn, the PASAT3” score was, on average, 6 points higher than the baseline score. The results may indicate improvement in cognitive domains. The influence of disease-modifying therapy cannot be ruled out.
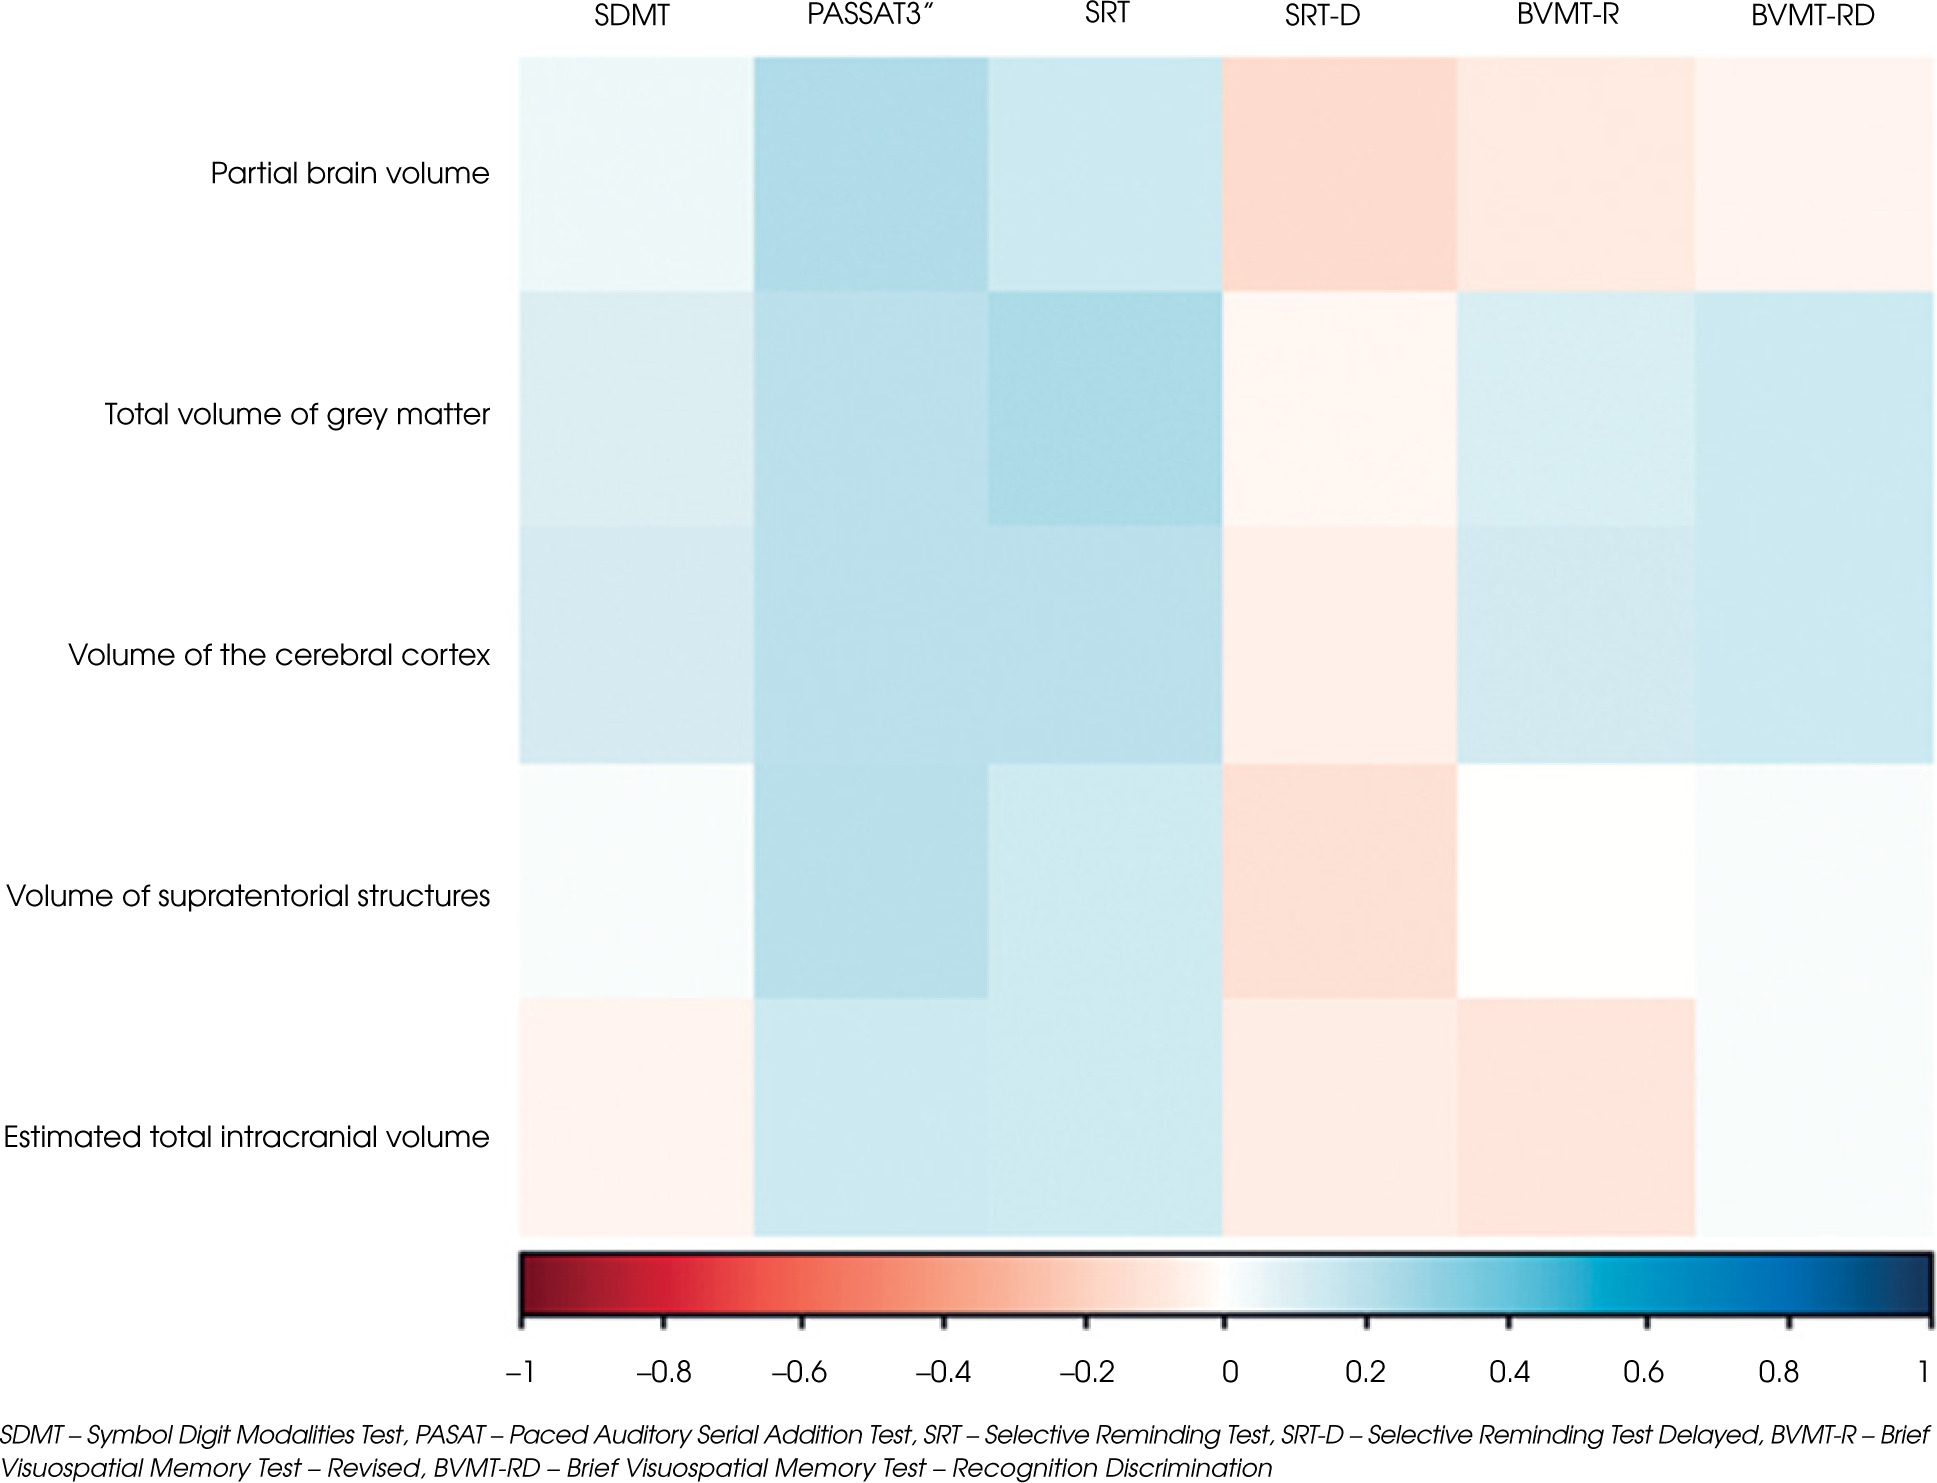
Table 5
Volumetric differences between men and women
Despite the lack of significant changes in the results of SRT, SRT-D, BVMT-R, and BVMT-RD tests performed after 12 months of follow-up, the factors that could influence the result were also analysed (age, gender, education, MS duration, EDSS). None of the parameters was a significant predictor of changes in univariate and multivariate analysis.
The analysis of changes in the volumetric parameters was performed in relation to changes in cognitive test scores (Table 7). The change in partial brain volume correlated significantly (p < 0.05) and positively (r > 0) with the change in the score of PASAT3”.
Similarly, the change in the total volume of grey matter correlated significantly (p < 0.05) and positively (r > 0) with the change in the score of PASAT3”. Positive correlations were obtained between all volumetric parameters and the scores of PASAT3” and SRT. Negative correlations were obtained between the change in the estimated total intracranial volume and SDMT and between the change in partial brain volume and BVMT-R and BVMT-RD. No correlations were found between the change in partial brain volume and SRT-D and between the change in the cortical volume and BVMT-R.
Assessment of cognitive functions and the degree of disability
Based on the degree of disability assessed by the EDSS, the study group was divided into patients with no disability and minimal disability (EDSS ≤ 2 points; 34 patients) and those with EDSS > 2 points to 4.5 points (13 patients). Cognitive test scores were assessed in each group. During the first assessment, the differences in scores between patients with lower EDSS and those with EDSS > 2 points were statistically non-significant (all p > 0.05). The largest differences in scores were found for SDMT, PASAT3”, SRT and BVMT-RD. In the group of patients with EDSS ≤ 2 points, the scores in the above tests were slightly better. Patients scored, on average, 4 points more in SDMT, 1 point more in PASAT3”, 3 points more in SRT and one point more in BVMT-RD. In the case of the SRT score, patients with EDSS ≤ 2 scored, on average, 5 points more compared to patients with EDSS > 2. These data were at the limit of statistical significance.
After 12 months of follow-up, the patients were analysed in terms of their cognitive test scores according to the degree of the EDSS (Table 8). The group of patients with EDSS ≤ 2 points included 37 subjects, while the group with EDSS > 2 points consisted of 9 patients. After 12 months, PASAT3”, BVMT-Rand BVMT-RD scores were significantly higher in the group of patients with EDSS ≤ 2 points. The group of patients with EDSS ≤ 2 had better scores on these cognitive tests.
DISCUSSION
Despite the extensive knowledge of cognitive impairment in MS and its significant impact on the daily functioning of patients, cognitive function is still not routinely assessed or optimally treated. This study highlights the need to monitor cognitive domains in MS patients. The patient’s functional limitations and depressive disorders that may affect the results should be taken into consideration [41].
Despite the increased prevalence of MS in women, the prevalence and the severity of cognitive deficits are higher in men [42]. Schoonheim et al. [43] found that cognitive domains, such as executive functioning, verbal memory, information processing speed, working memory, attention and psychomotor speed, were affected in men with MS compared to controls, while none of these domains was significantly affected in women.
In our study, sex had no significant effect on cognitive function, which is in line with the results of Tam et al. [44], who did not find sex to be a predictor and Beatty et al. [45], who observed that sex was not a predictor at the cognitive level. Also, Pouramiri et al. [46] found no significant association between sex and cognitive and executive functions. However, these findings are not in line with those obtained by Shaygannejad et al. [47], who described more cognitive disorders in women than in men. A limitation of our study is the lack of a control group.
In our study, the selection of cognitive tests was dictated by the possibility of assessing several cognitive domains and an attempt to select a test that would be reproducible and easy to use in practice. Portaccio et al. [31] recommended screening a short BRB version of SDMT, PASAT3” and SRT because failure on one of these three subtests predicted neuropsychological deficits with high degree of sensitivity (94%) and specificity (84%).
Table 6
Analysis of the data at baseline and after 12 months of follow-up
[i] p – Wilcoxon paired t-test
*Statistically significant (p < 0.05)
SDMT – Symbol Digit Modalities Test, PASAT – Paced Auditory Serial Addition Test, SRT – Selective Reminding Test, SRT-D – Selective Reminding Test Delayed, BVMT-R – Brief Visuospatial Memory Test – Revised, BVMT-RD – Brief Visuospatial Memory Test – Recognition Discrimination
Table 7
Correlation between changes in the volumetric parameters and changes in cognitive test scores
[i] r – Spearman correlation coefficient
*Statistically significant (p < 0.05)
SDMT – Symbol Digit Modalities Test, PASAT – Paced Auditory Serial Addition Test, SRT – Selective Reminding Test, SRT-D – Selective Reminding Test Delayed, BVMT-R – Brief Visuospatial Memory Test – Revised, BVMT-RD – Brief Visuospatial Memory Test – Recognition Discrimination
No significant predictors of the dynamics of cognitive function were found in the univariate or multivariate model, as opposed to the results of long-term studies. After a 10-year follow-up of cognitive functioning in patients with MS, Lacy et al. [48] found that the degree of physical disability, the progressive course of the disease and increasing age influenced cognitive impairment and that work-related and social limitations were correlated with the degree of cognitive decline irrespective of the degree of physical disability. Caneda et al. [35] found that the SDMT score was associated with disease duration, and the level of formal education. A protective factor for the onset of memory impairment is greater cognitive reserve indexed by higher premorbid intelligence or more years of education, which protects against the progression of cognitive dysfunction in MS [26]. In a 5-year follow-up, Benedict et al. [49] demonstrated that patients with high cognitive reserve at the start of the study did not present with the loss of cognitive function, while patients with low cognitive reserve presented with significant cognitive decline. Silva et al. [50] found that patients with higher education were less likely to have cognitive deficits than those with lower education, even when other concomitant variables were considered. In a study on the Polish population of 61 MS patients, Betscher et al. [51] assessed cognitive function using BICAMS compared to a group of 61 healthy volunteers. The following were evaluated: age, years of education, MS duration and disability on the EDSS. The study showed a negative correlation between age and SDMT and BVMT-R scores in the MS group and the SDMT score in the healthy group. BVMT-R and SDMT scores were negatively correlated with disease duration [51].
Table 8
Cognitive test scores after 12 months of follow-up based on the EDSS
[i] p – Mann-Whitney U test
*Statistically significant (p < 0.05)
SDMT – Symbol Digit Modalities Test, PASAT – Paced Auditory Serial Addition Test, SRT – Selective Reminding Test, SRT-D – Selective Reminding Test Delayed, BVMT-R – Brief Visuospatial Memory Test – Revised, BVMT-RD – Brief Visuospatial Memory Test – Recognition Discrimination
In the study group, no significant correlations were found between the scores of cognitive tests performed at the beginning of follow-up and the duration of MS. Similar conclusions were drawn on the basis of the assessment after 12 months of follow-up. In a trial on 487 patients with relapsing-remitting multiple sclerosis (RRMS), Ozak bas et al. [52] found a significant negative correlation of Brief Repeatable Battery of neuropsychological tests (BRB-N) subtests with age, disease duration and the EDSS score.
Amato et al. [4] screened 150 patients for cognitive impairment and found no association with MS duration. Patti et al. [53] found that disease duration, depression and years of formal education were not significantly different between patients with cognitive impairment and those with preserved cognitive function. In a large cross-sectional study on 1,500 patients with MS who were assessed with computerized neurocognitive tests, Achiron et al. [54] examined the effect of disease duration and observed that the percentage of cognitive impairment increased over 25 years. In another study on 168 patients that assessed different MS phenotypes using Rao’s BRB-N, Dackovic et al. [55] found a negative effect of disease duration on cognitive function.
In our study, after 12 months the PASAT3”, SDMT and BVMT-R scores were significantly higher in patients with EDSS ≤ 2. Carotenuto et al. [29] conducted a study on a young group of MS patients (aged 12-25 years) and found that a lower SDMT score was associated with a higher risk of increasing disability, and a decrease in EDSS by 1 step was associated with a worse SDMT score. De Caneda et al. [56] performed a study on 40 patients with MS and calculated the correlation coefficient between EDSS and neuropsychological tests (BICAMS). Statistically significant relationships were obtained for SDMT, BVMT-R and CVLT. Patients with EDSS ≤ 3.5 had better scores on the above tests [35]. In another study on a group of 550 patients, Patti et al. [57] found that EDSS scores were also significantly higher in patients with cognitive impairment than in patients with preserved cognitive function.
In a 10-year retrospective study involving 155 patients with MS, Moccia et al. [58] used the Rao Brief Repeatable Battery and EDSS at MS diagnosis. The reaching of EDSS 4.0 and secondary progressive conversion were recorded. Patients with cognitive impairment at MS diagnosis had a rate of reaching the EDSS score of 4.0 more than three times greater and a rate of secondary progressive conversion more than two times greater. Better scores on the SRT-D test and the SDMT test at baseline visit were associated with lower rates of conversion to progressive MS.
Our study showed no significant changes in volumetric measurements on MRI at baseline and after 12 months. This correlation warrants further investigation. Long-term studies using MRI in MS patients have demonstrated a strong correlation between changes in cognitive functioning and the progression of brain atrophy at the early onset of the disease and offered the possibility of predicting cognitive impairment five years before they occur [59]. Information processing speed, as assessed by the SDMT, is associated with atrophy of the deep gray matter, particularly in the thalamus [60]. Quantitative assessment of T1 hypointense lesions that reflect changes in demyelination and axonal density showed no significant clinico-radiological associations. In turn, quantitative assessment of volume reduction of the whole brain or selected brain areas provides strong correlates of cognitive dysfunction associated with MS [61]. Since the brain volume is variable, and only the intracranial volume remains unchanged in adulthood [62], the results cannot be easily compared except for studies on large cohorts [63]. We assessed the minimum estimated total intracranial volume and partial brain volume. However, measurements did not differ significantly after one year. In FREEDOMS, FREEDOMS II and TRANSFORMS, age, baseline T2-weighted lesion volume, MS duration, baseline EDSS scores and MSFC correlated independently with brain volume in all studies [64]. The strongest individual baseline predictors of brain volume reduction over time were T2 lesion volume, the number of enhancing lesions after administration of the contrast agent and T1-hypointense lesion volume. Age, T2 lesion volume, MS duration and the MSFC score were significant independent variables explaining the reduction in normalized brain volume in all three studies [64].
In most studies, brain volume measurements correlate more with cognitive impairment than T1 and T2 lesion volume measurements [65]. In a study on 327 patients, Patti et al. [66] found that T2 lesion volume, intelligence quotient and age were significant predictors of cognitive impairment. In a multicenter study, Tillema et al. [67] found that hippocampal atrophy and deep gray matter atrophy/subcortical nuclei were the best predictors of cognitive decline in MS, while atrophy in the white matter was associated with the degree of disability.
Many studies indicate that volumetry of cortical and subcortical structures and white matter diffusion measurements are crucial for understanding the progression of disability. These measurements should be considered in clinical trials and daily clinical practice [68].
The limitations of our study include the small sample size and a short follow-up. In this study, we mostly selected the volumetric parameters that had not been previously assessed in MS patients. The choice of methods is justified by the need to indicate MR parameters that can be easily applied in daily practice. The tools used to assess cognitive function seem reasonable. All the selected tests are recommended by both Polish [51, 69] and international MS consortia [70]. Further studies are warranted in this respect.
CONCLUSIONS
There is a clear need to evaluate particular cognitive domains in patients with MS as early as from the onset of the disease and to perform long-term follow-up of these. Repeated tests, at the onset of the disease, assessing cognitive function in correlation with MRI examination at specific time intervals, may allow the determination of the progression of cognitive dysfunction and the severity of atrophy of brain structures. The assessment of the two most frequently impaired cognitive domains (i.e., episodic memory and information processing speed) could be a screening indicator for detecting cognitive dysfunction in MS patients. These results are influenced by the short observation time. The study is limited by the small study group and short observation period, as well as the lack of a control group due to the lack of financial resources for MRI examinations.
DETAILED CONCLUSIONS
Positive correlations were obtained between partial brain volume and PASAT3”, total volume of grey matter and SRT and BVMT-RD, the cortical volume and PASAT3”, SRT, BVMT-R and BVMT-RD in assessing the relationship between atrophic changes in brain structures and the severity of cognitive deficiency in MS patients at baseline. The least significant relationships were found between the volumetric parameters and SRT-D. Positive correlations were obtained between the volumetric parameters and the scores of PASAT3” after 12 months of follow-up. As regards SDMT, correlations were found with all volumetric measurements except for the estimated total intracranial volume. This measurement, however, correlated poorly with the scores of other cognitive tests.
At baseline, no statistically significant relationship was found between the severity of cognitive dysfunction and the degree of disability assessed by the EDSS.
Cognitive dysfunction was not associated with gender.
No relationship was found between the progression of cognitive dysfunction and the severity of brain atrophy, probably due to a too short follow-up and too small a sample size.
In this article, the hypotheses were too general and not detailed enough. For this reason, no specific cognitive functions were compared with any specific factor influencing the outcome.
The most clinically useful tests were found to be SDMT, which reflects the speed of information processing and PASAT3” – two versions of the test alternatively – which assesses the ability and speed of information processing and sustained and divided attention.


