

Introduction
Thyroid cancer (TC), the most frequent endocrine malignancy in the head and neck, arises from the follicular or parafollicular epithelial cells. With 586,000 cases worldwide according to the World Health Organization (WHO), TC incidence ranked ninth in 2020 [1]. At present, the therapeutic approach to TC is mainly surgical treatment, complemented by other treatment methods. Thyroid cancer is prone to metastasize, and incurable as demonstrated by current studies. It has a high rate of early detection and a much higher five-year survival rate than other tumors. However, the prognosis of different types of TCs varies, and the prognosis of recurrent and metastatic TCs and undifferentiated TCs is poor [2, 3]. Therefore, it is particularly important to understand the factors influencing the prognosis of TC patients.
T cell infiltration is an essential factor in modulating tumor progression, which determines the clinical response to immunotherapy [4]. CD8+ T cells are important for intracellular protective immunity against tumors. It was reported that dysfunction of CD8+ T cells could influence the efficacy of immunotherapy [4]. It has been confirmed that the number of resident CD103+CD8+ T cells or the density of tumor infiltrating CD8+ T cells in colorectal tissue can be a critical prognostic indicator of colorectal cancer [5]. Yang et al. [6] investigated the immune genes of colon cancer and found that related genes in T cells are correlated with prognosis of colon cancer. Lin et al. [7] identified a potential prognostic biomarker of clear cell renal cell carcinoma based on CD8+ T cell infiltration. Oshi et al. [8] standardized scores for CD8+ T cell abundance, which can be used to predict overall survival (OS) of patients suffering from triple negative breast cancer. Shigeta et al. [9] reported that CXCR3+CD8+ T cell infiltration is increased by upgrading CXCL10 expression in hepatocellular carcinoma, thus achieving inhibition of tumor growth and higher survival via regorafenib/anti-PD1 combination therapy. Yang et al. [10] discovered that the relationship between high CD8+ T infiltration is correlated with favorable survival of prostate cancer patients after radical prostatectomy. Therefore, it contributes to prognostic assessment and development of an immunotherapy molecular biomarker for TC patients by developing a CD8+ T cell infiltration- related biomarker and prognostic model.
At present, there are few studies on the prognosis of TC based on CD8+ T cell-related genes. Here, mRNA data of TC from The Cancer Genome Atlas (TCGA) database were analyzed by bioinformatics methods. We identified a significant association between CD8+ T cells and survival of TC patients. Subsequently, a TC prognostic risk assessment model based on immune-related genes in CD8+ T cells was constructed according to the screened DEGs. Next, we verified the model and evaluated immune infiltration to provide a basis for the prognostic gene screening and prognosis determination.
Material and methods
Data download and processing
mRNA expression information in TCGA-THCA was accessed from the TCGA database (https://portal.gdc.cancer.gov/) in FRKM format and count format (normal:58 tumor:510) as well as clinical data.
Assessment of immune cell abundance and its correlation with survival
CIBERSORT [11] was employed to analyze the mRNA expression data (FPKM format) of TC samples in the TCGA-THCA dataset, and the data were iterated 1000 times to obtain the composition proportion of 22 immune cells in all samples. Samples with a p-value < 0.05 were selected for subsequent analyses. The vioplot package (CRAN-Package vioplot (r-project.org)) was utilized to assess the difference in cell abundance between normal and tumor samples. The samples were grouped according to the median cell abundance. The survival package was applied for survival analysis, which was performed by combining immune cells with altered infiltration levels in TC. The results showed that CD8+ T cells could well predict the survival of patients.
Screening of differentially expressed genes related to CD8+ T cell abundance
Differential expression analysis (|logFC| > 1.5, padj < 0.05) of mRNA expression data (count format) was conducted on CD8+ T cells in high- and low-abundance groups via the edge package [12]. After the DEGs were obtained, the clusterprofiler package [13] was used for gene ontology (GO) and Kyoto Encyclopedia of Genes and Genomes (KEGG) enrichment analyses of DEGs (q-value < 0.05). Finally, the enrichplot package (CRAN-Package shadowtext (r-project.org)) was employed to visualize enrichment results.
Screening of prognosis-related feature genes in CD8+ T cells and construction of the prognostic model
Thyroid cancer samples were randomized to the training set (counts: 352) and validation set (counts: 150) at a ratio of 7 : 3. The samples with less than 30-day OS were deleted from the training set. Combined with the OS of patients, univariate Cox regression analysis (p < 0.05) was performed on the CD8+ T cell-related DEGs in the training set using the survival package, and survival-related genes were selected. To avoid over-fitting, the glmnet package [14] was applied to conduct Lasso Cox regression analysis on the genes selected above. The cross-validation method was used to remove genes with a strong correlation using the penalty parameter lambda, thus reducing the model complexity. Finally, the survival package was utilized to conduct multivariate Cox regression analysis on the genes screened by Lasso. The risk assessment model was constructed based on genes acquired hereinbefore. Based on the expression of each gene and regression coefficient, the risk score of the samples in the training set was formulated as follows:
n is the number of feature immune-related genes in CD8+ T; expi is the expression value of each prognostic feature gene; and βi refers to the corresponding multivariate Cox regression coefficient.
Finally, we assigned TC samples in the training set and validation set to high- and low-risk groups with the median risk score as the cut-off value. Significant differences of the Kaplan-Meier (KM) curve between two groups were analyzed using the survival package. The ‘timeROC’ package [13] was applied to draw the receiver operating characteristic (ROC) curve. The AUC values of 1-, 3-, 5-year OS were calculated and then verified in the training set and validation set.
Gene set enrichment analysis
To identify the key signaling pathways that affected OS differences between samples in two risk groups, gene set enrichment analysis (GSEA) software [15] (http://www.gsea-msigdb.org/gsea/index.jsp) (FDR < 0.05) was employed to screen KEGG pathways with different activation levels in the two risk groups.
Immune infiltration assessment
Stromal, immune, and ESTIMATE scores of TC samples in the training set were assessed using the estimate package [16]. Single-sample GSEA (ssGSEA) analysis was performed on tumor samples in the two risk groups using the Gene Set Variation Analysis (GSVA) package [17], and the Wilcoxon test was applied to verify differences between two groups.
Results
Immune cell abundance and its correlation with survival
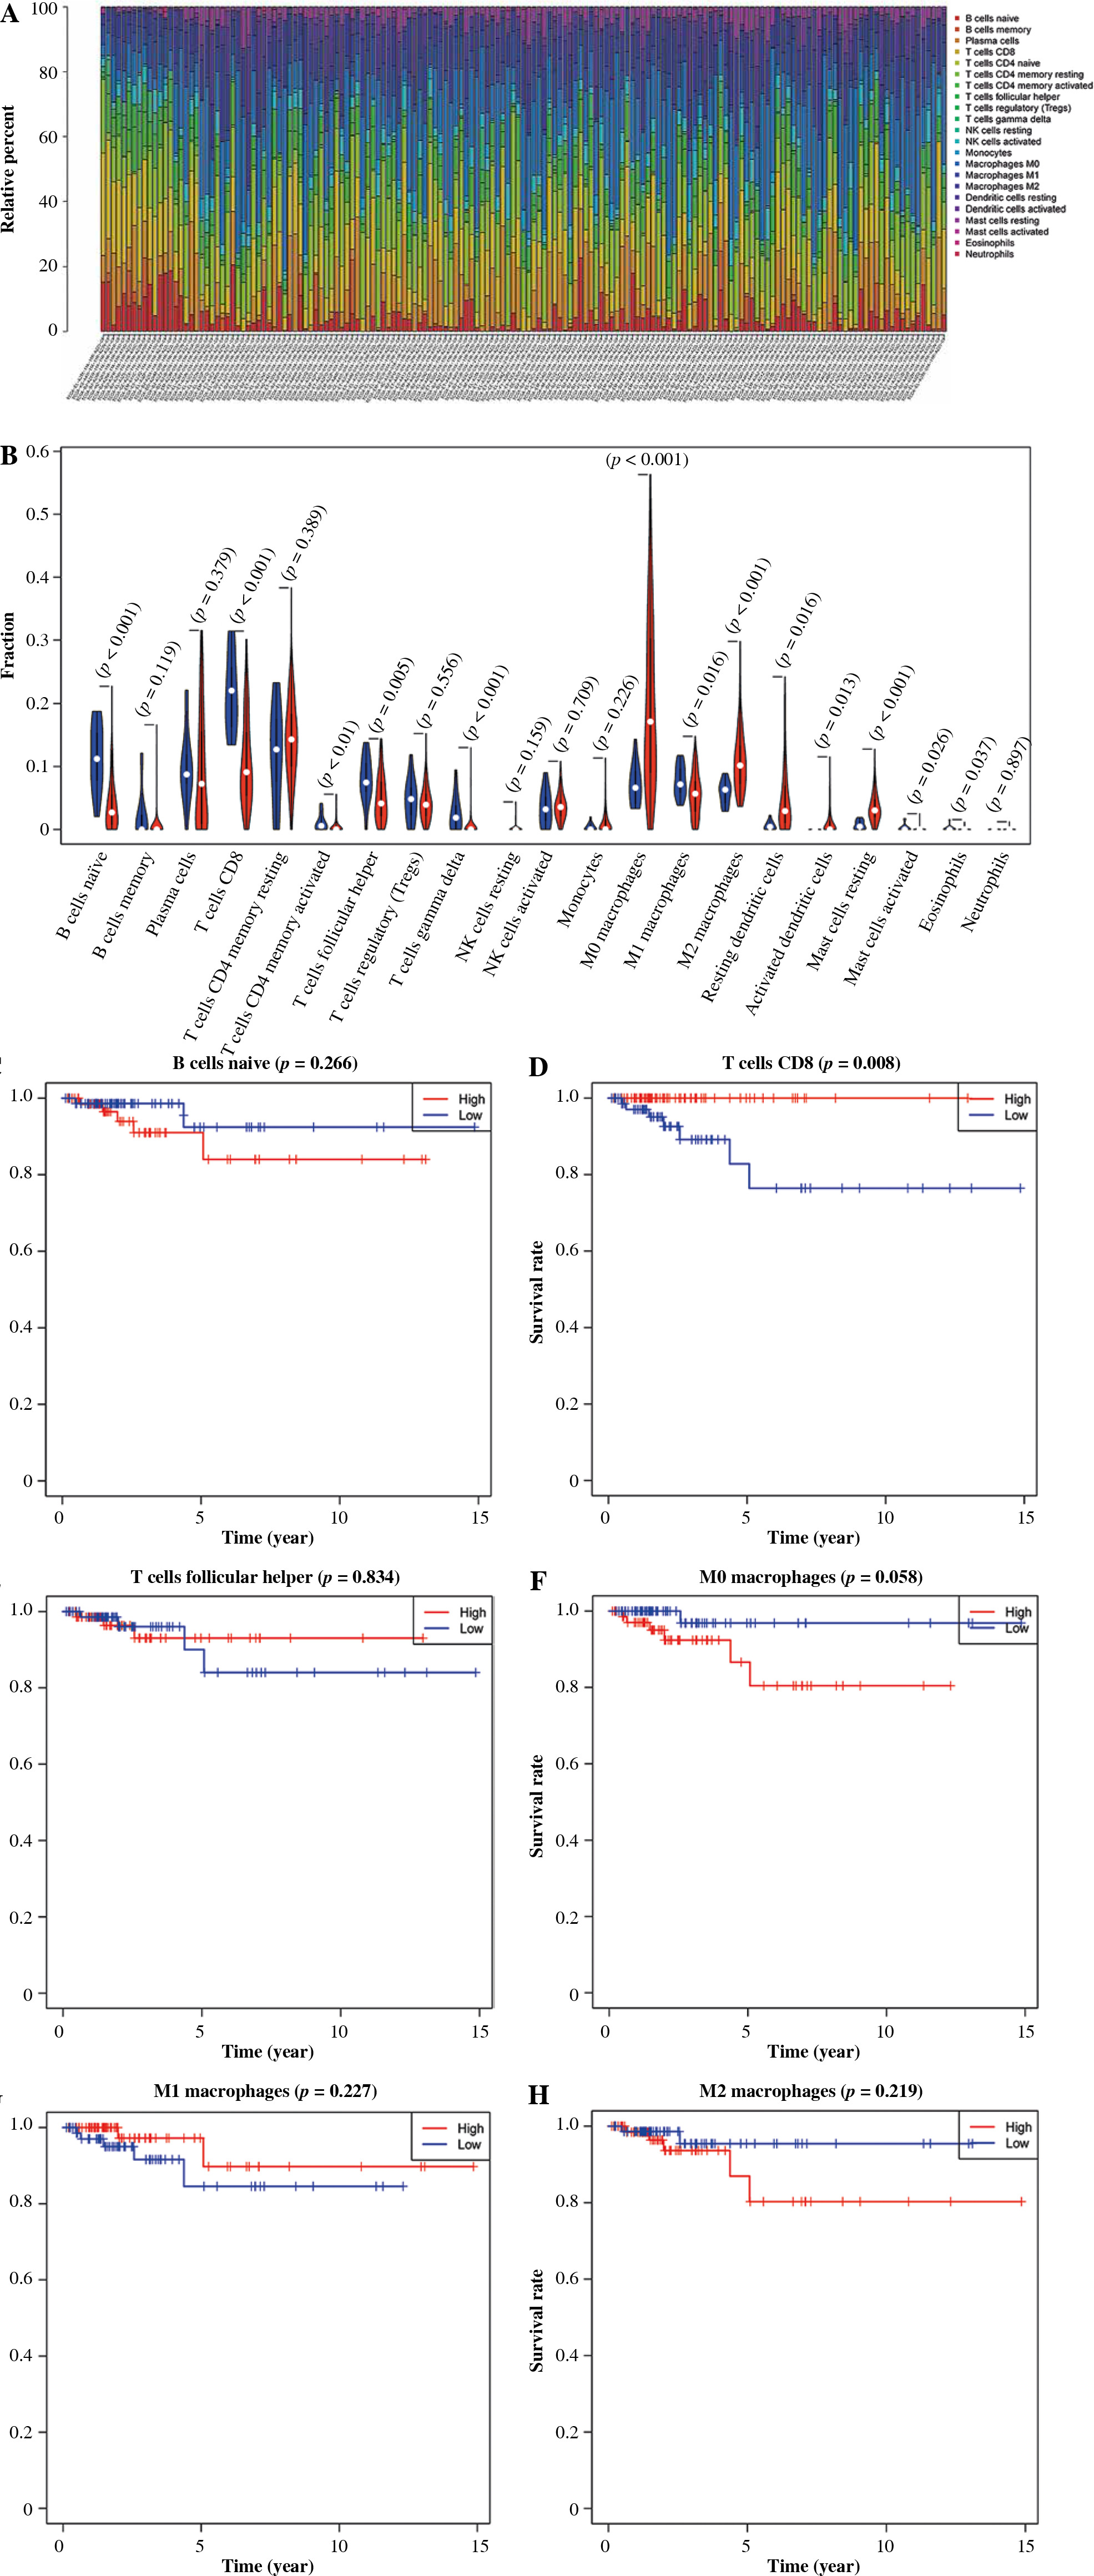
CIBERSORT was applied to evaluate the relative abundance of 22 kinds of immune cells from TCGA-THCA samples. 163 samples were screened for subsequent analyses with q-value < 0.5 as the threshold (Fig. 1A). The results of differential expression analysis showed that naïve B cells, follicular helper T cells, CD8 T cells, M0 macrophages, M1 macrophages and M2 macrophages had significant differences and high abundance (Fig. 1B, Table S1). Combined with clinical information, we plotted the survival curves of patients in high- and low-abundance groups of immune cells. The results indicated that patients with TC in the high abundance CD8+ T cell group presented a higher survival rate. In contrast, the abundance of other immune cells was not significantly associated with OS (Fig. 1C-H).
Fig. 1
Correlation analysis of immune cell abundance and overall survival (OS). A) Abundance ratios of various immune cells in thyroid cancer (TC) samples. B) Differences in the abundance of immune cells between normal (blue) and tumor tissue samples (red) The survival curves of patients in high- and low-abundance groups: C) naïve B cells, D) CD8 T cells, E) Follicular helper T cells, F) M0 macrophages, G) M1 macrophages, H) M2 macrophages
Differentially expressed genes affect CD8+ T cell abundance
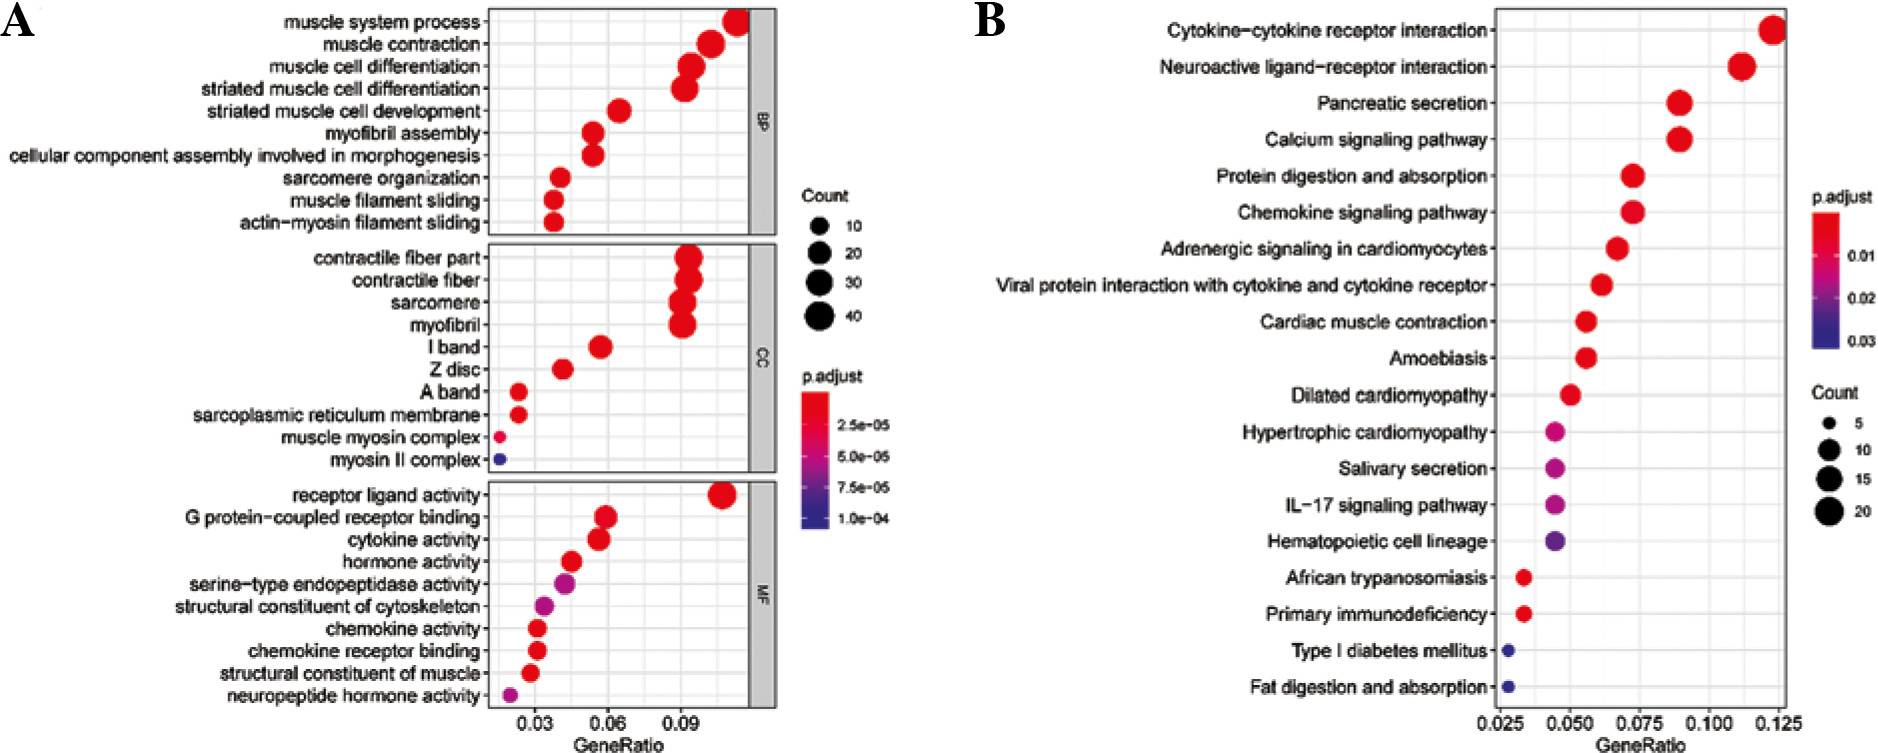
Differential expression analysis was conducted on CD8+ T cells in the two abundance groups, and 397 differential genes were obtained, including 144 up-regulated genes and 253 down-regulated genes (Fig. 2). GO and KEGG enrichment analyses were performed on immune-related DEGs. The results of GO analysis showed that most of the DEGs were gathered in the molecular activities, such as receptor ligand activity, G protein-coupled receptor binding, cytokine activity and chemokine activity (Fig. 3A). The results of KEGG analysis demonstrated that most of the DEGs were enriched in neuroactive ligand-receptor interaction, cytokine-cytokine receptor interaction, chemokine signaling pathway and interleukin (IL)-17 signaling pathway (Fig. 3B). Differential expression of these immune genes may contribute to the remarkable difference in prognosis of TC patients.
Fig. 2
Volcano plot of differentially expressed genes (DEGs) in high- and low-abundance groups of CD8+ T cells in thyroid cancer (TC) samples. Red – notably up-regulated genes; blue – markedly down-regulated genes
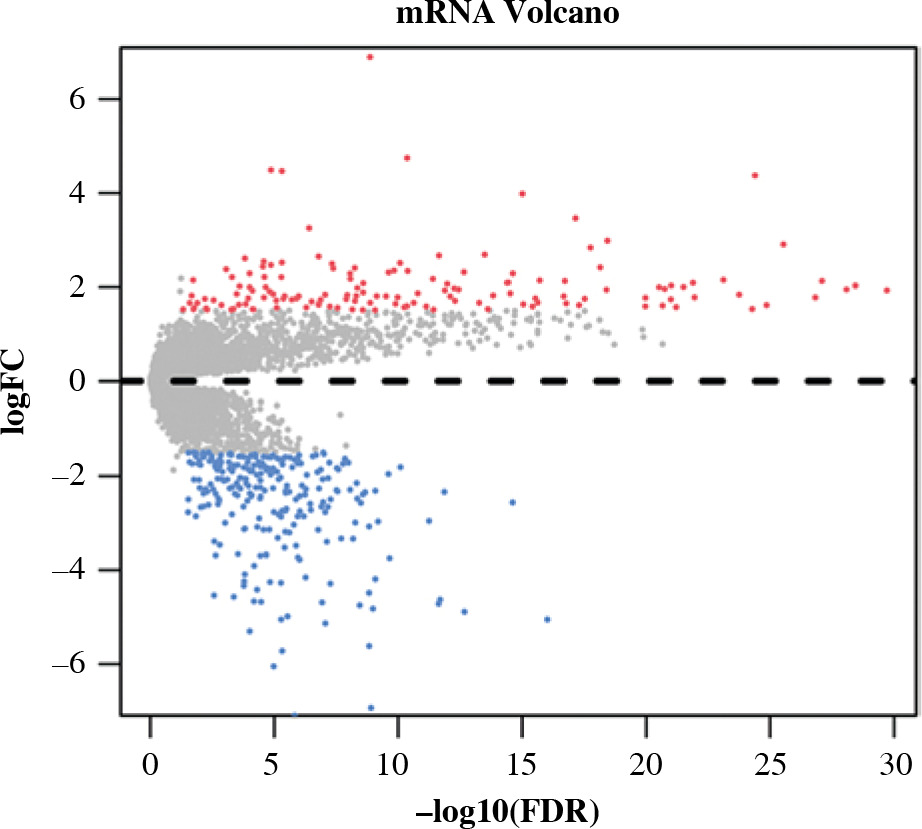
Fig. 3
Enrichment analysis of differentially expressed genes (DEGs) in CD8+ T cells. A) Bubble chart of DEGs GO enrichment analysis. B) The results of KEGG enrichment analysis of DEGs. Nodes represent the terms of enrichment, and the larger the nodes are, the more genes are enriched; the color of nodes tends to red, the smaller the p value is.
Constructing a 6-gene prognostic model on the basis of CD8+ T cells
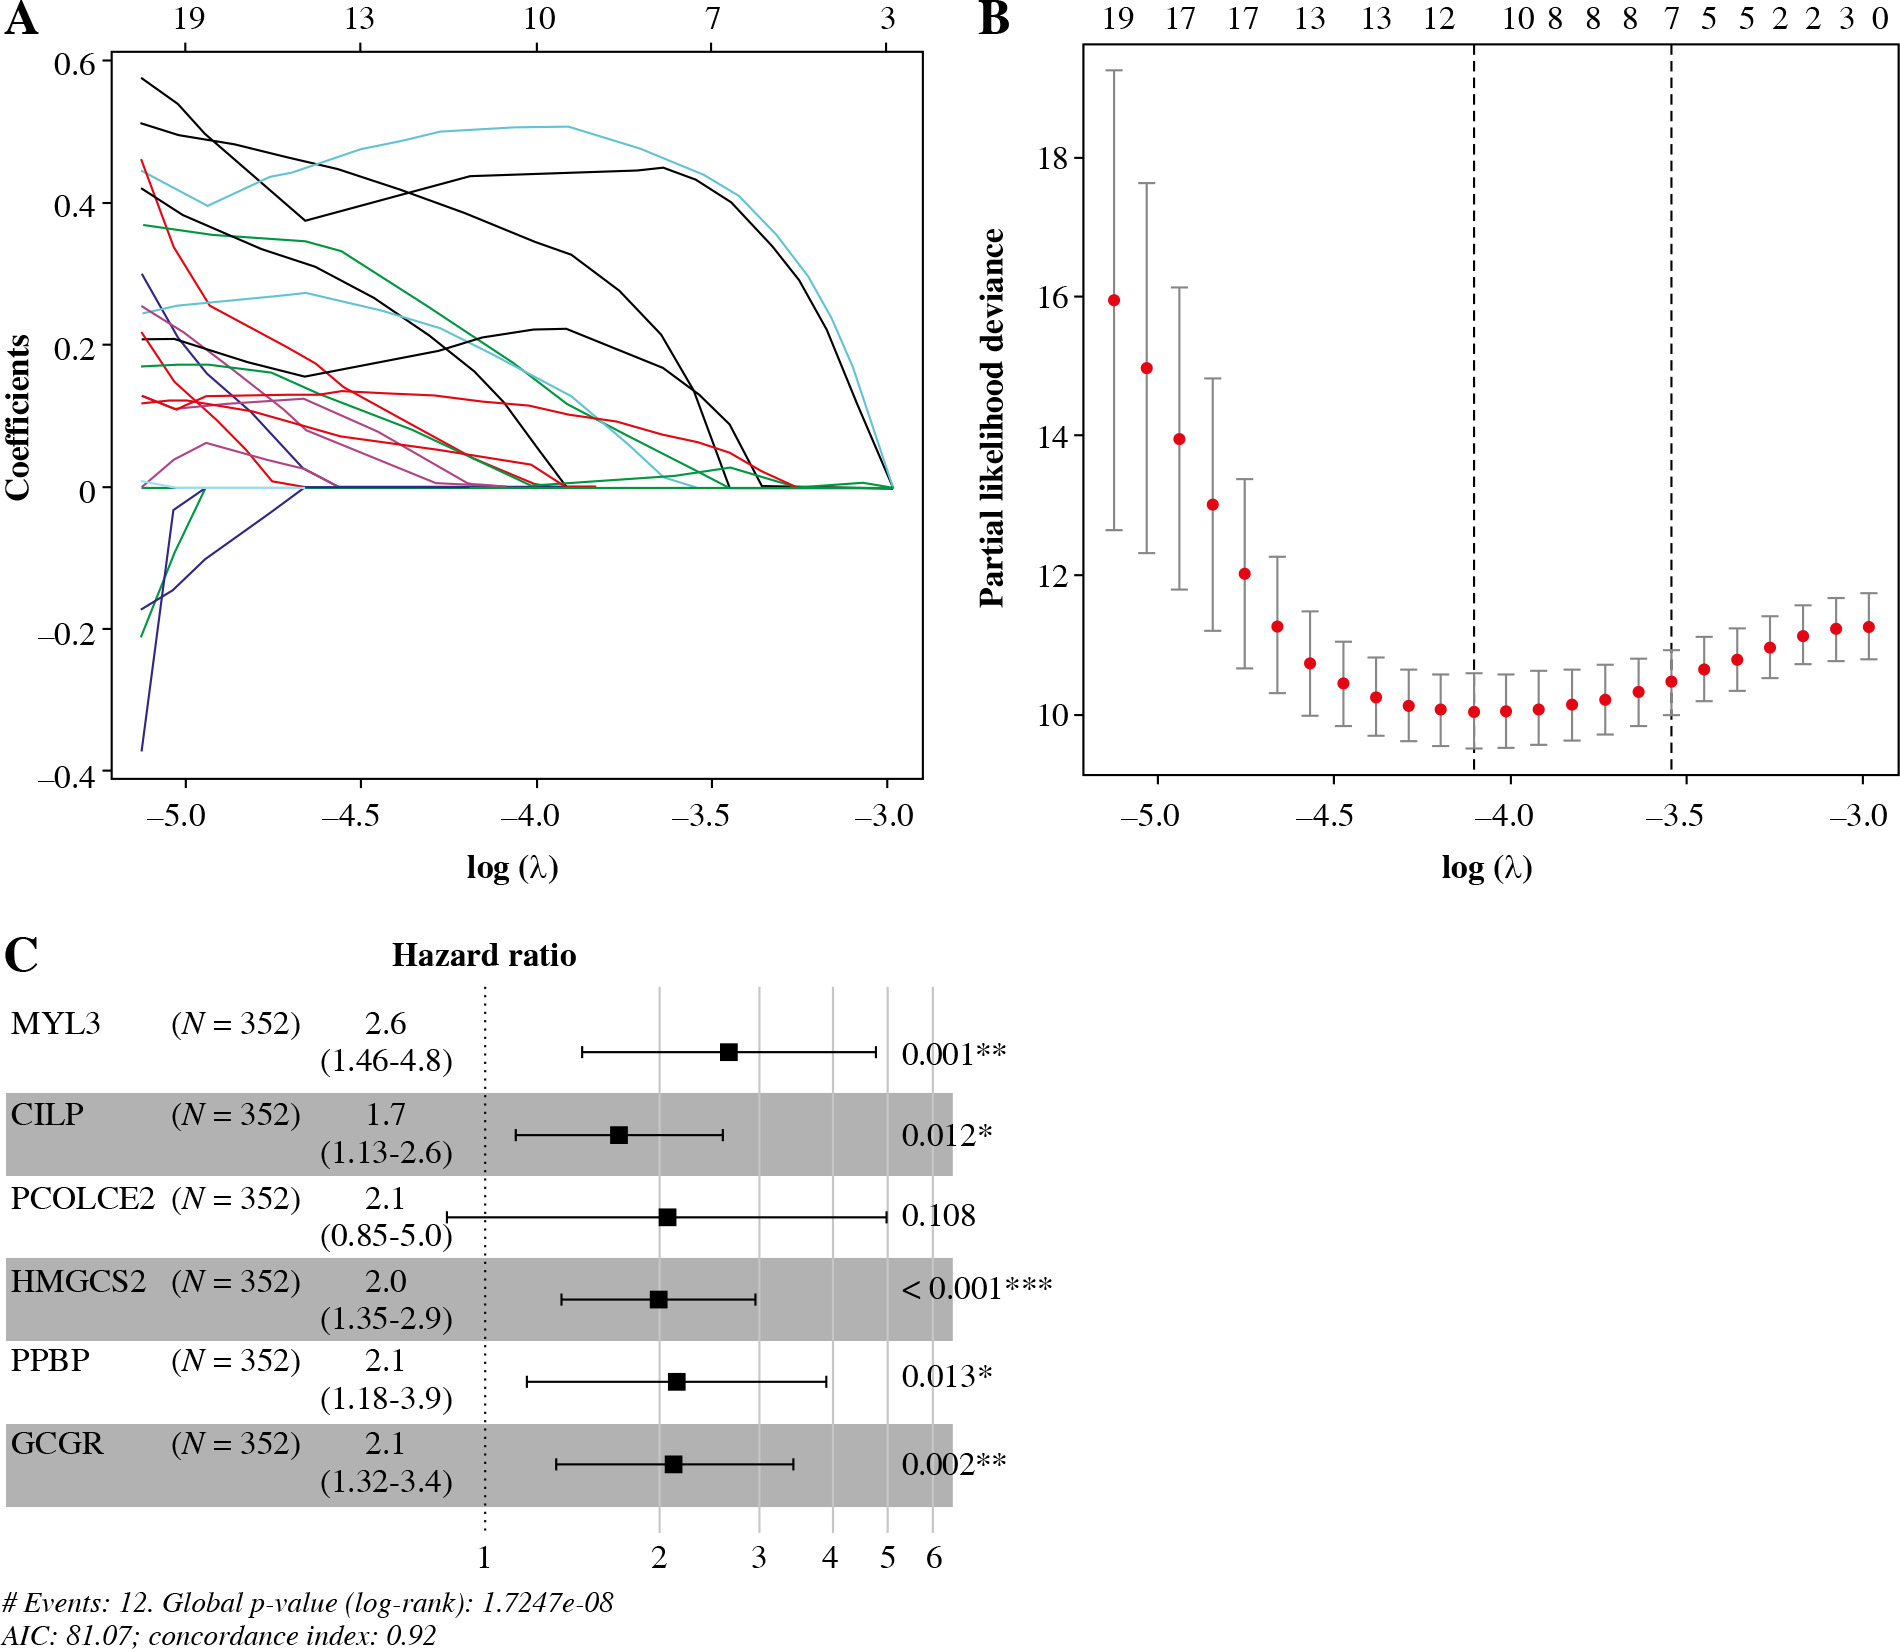
Univariate Cox analysis was carried out in combination with immune-related DEGs, and 61 immune-related genes were screened (Table S2). Lasso regression analysis was performed to assess these 61 genes to prevent overfitting of the model, and 11 important feature genes were screened (Fig. 4A, B). A multivariate Cox regression model was constructed for the 11 genes, and 6 prognostic feature genes (MYL3, CILP, PCOLCE2, HMGCS2, PPBP, GCGR) were screened (Fig. 4C). The risk model was obtained. Risk score = 0.9703 × MYL3 + 0.5322 × CILP + 0.7225 × PCOLCE2 + 0.6878 × HMGCS2 + 0.7626 × PPBP + 0.7528 × GCGR.
Fig. 4
Immune-related feature genes in CD8+ T cells. A) Changing trajectory of coefficients of 61 prognosis-related feature genes with penalty parameter lambda in Lasso regression analysis. B) The selective interval of the optimal penalty parameter λ, where the above coordinate represents the numbers of genes corresponding to different lambda values. C) Forest plot of six feature genes by multivariate Cox regression analysis (*p < 0.05, **p < 0.01, ***p < 0.001)
Assessment of predictive ability of the 6-gene prognostic model
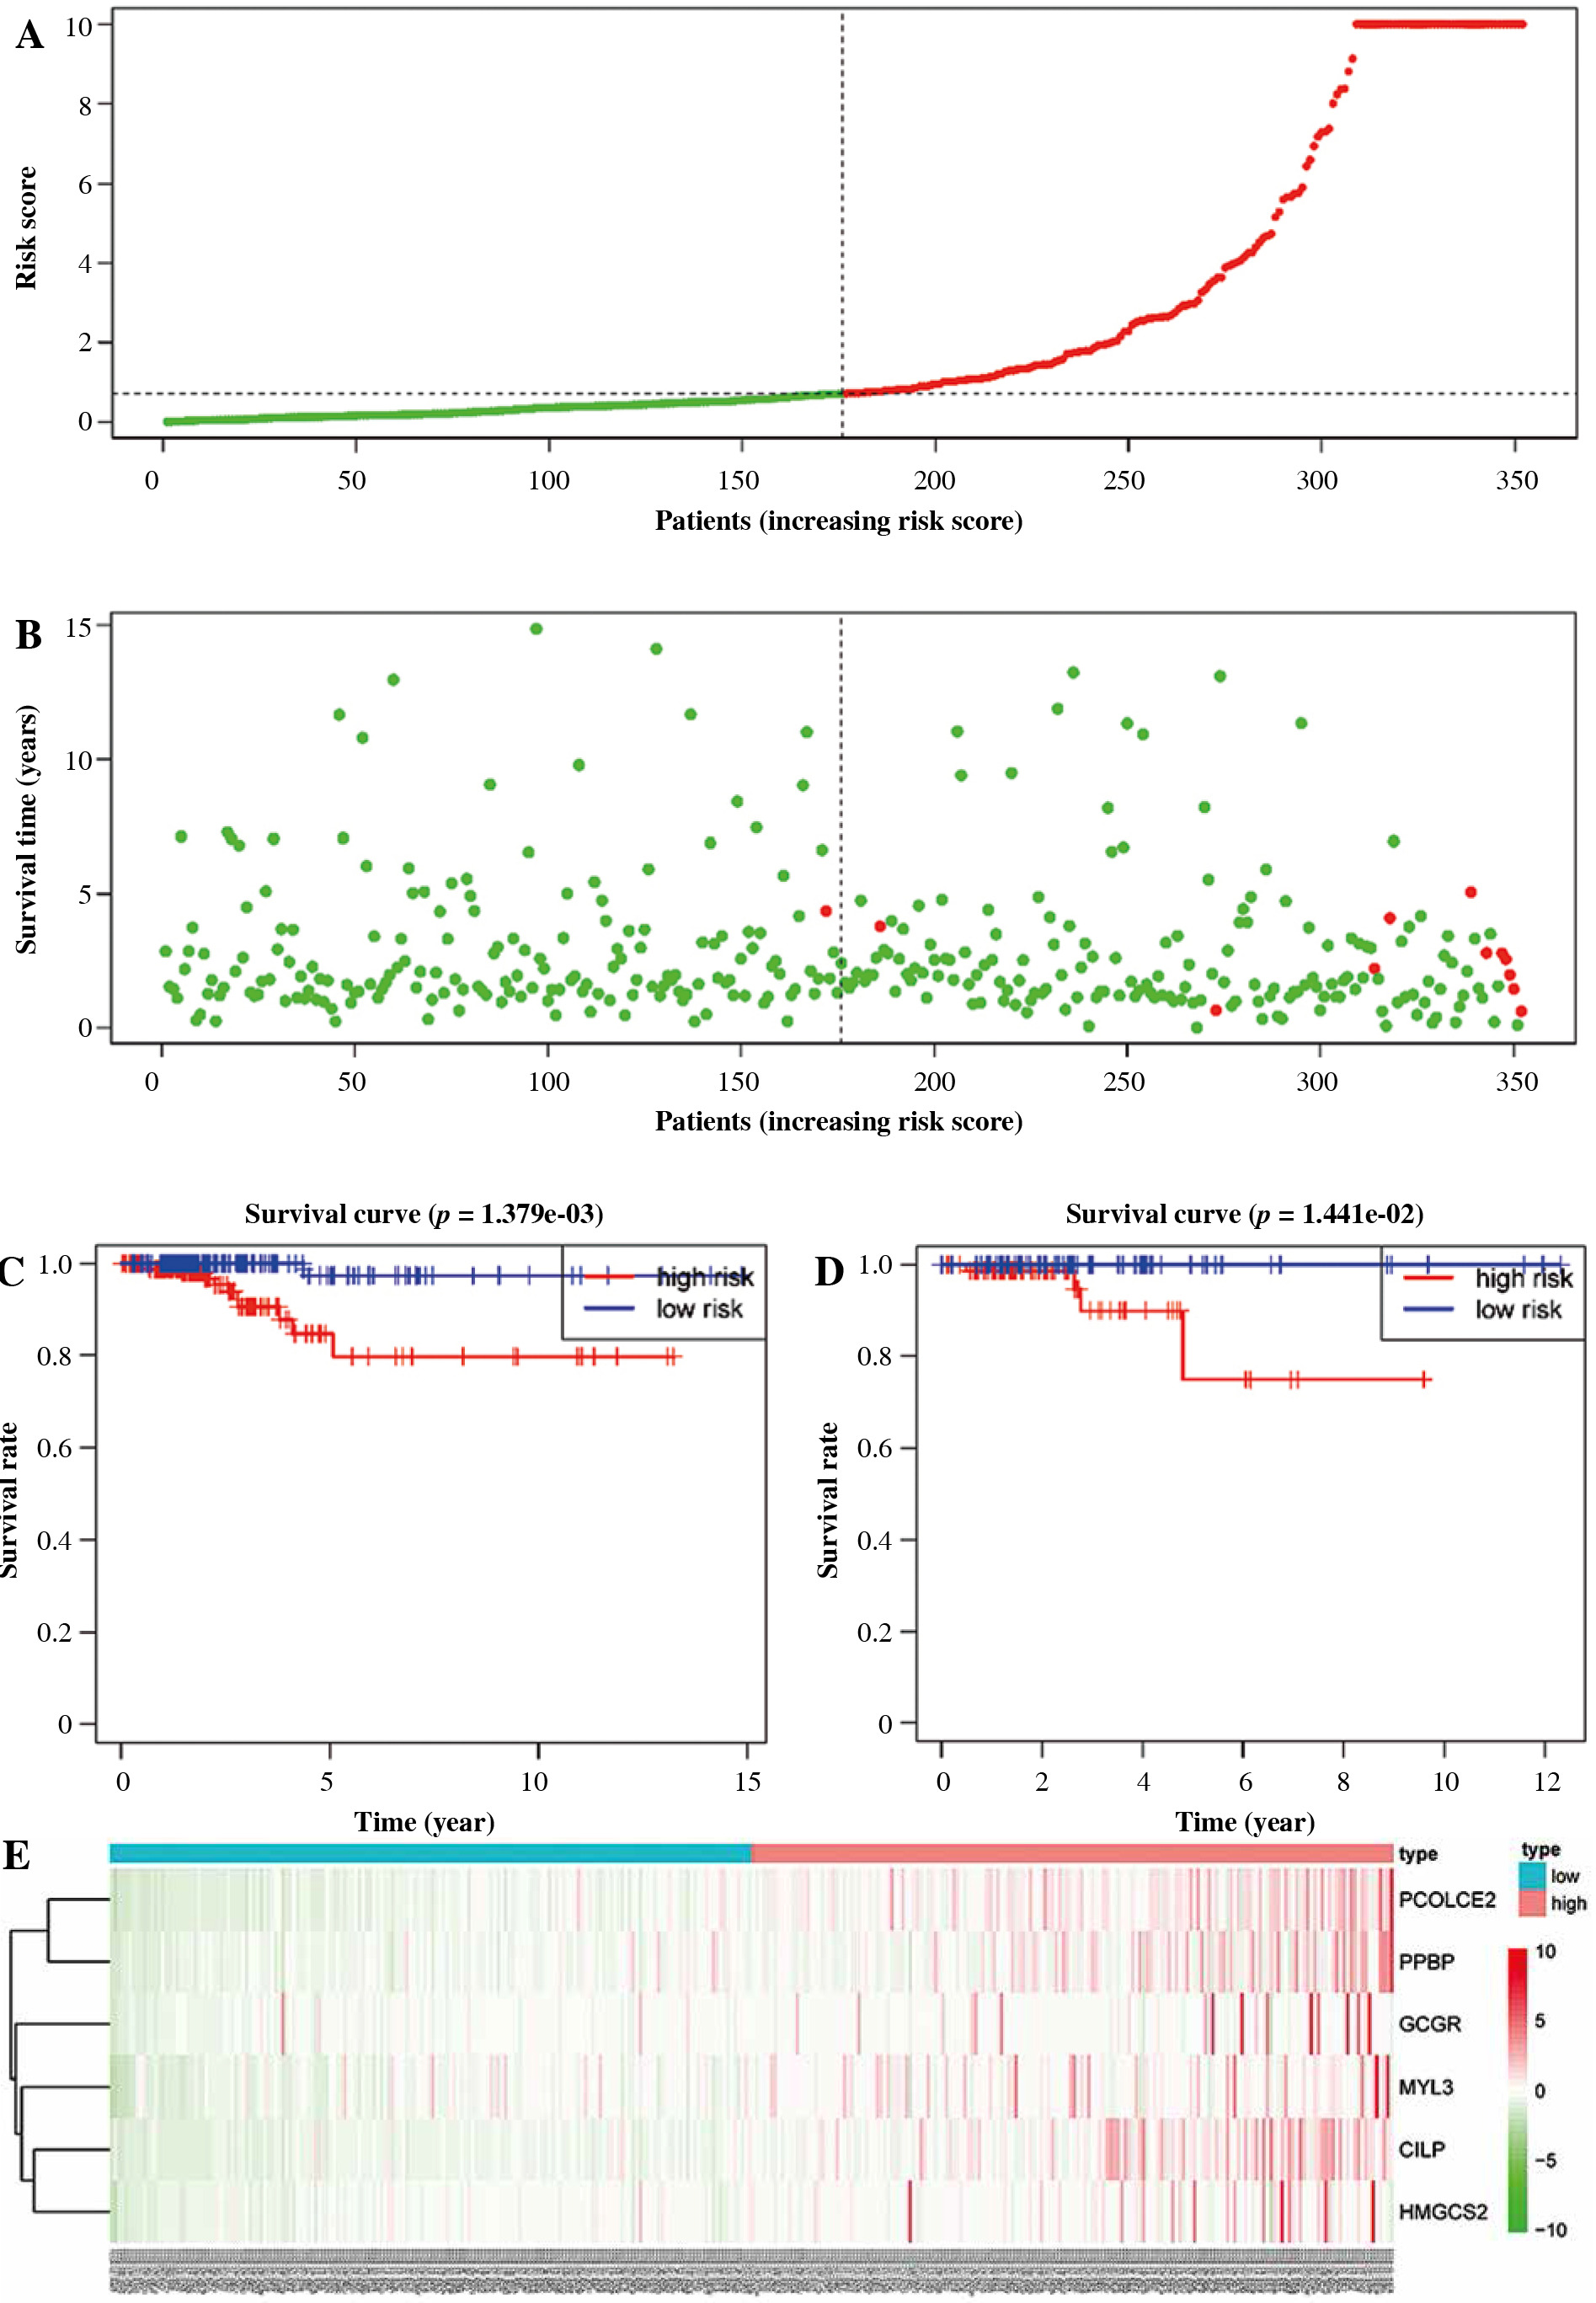
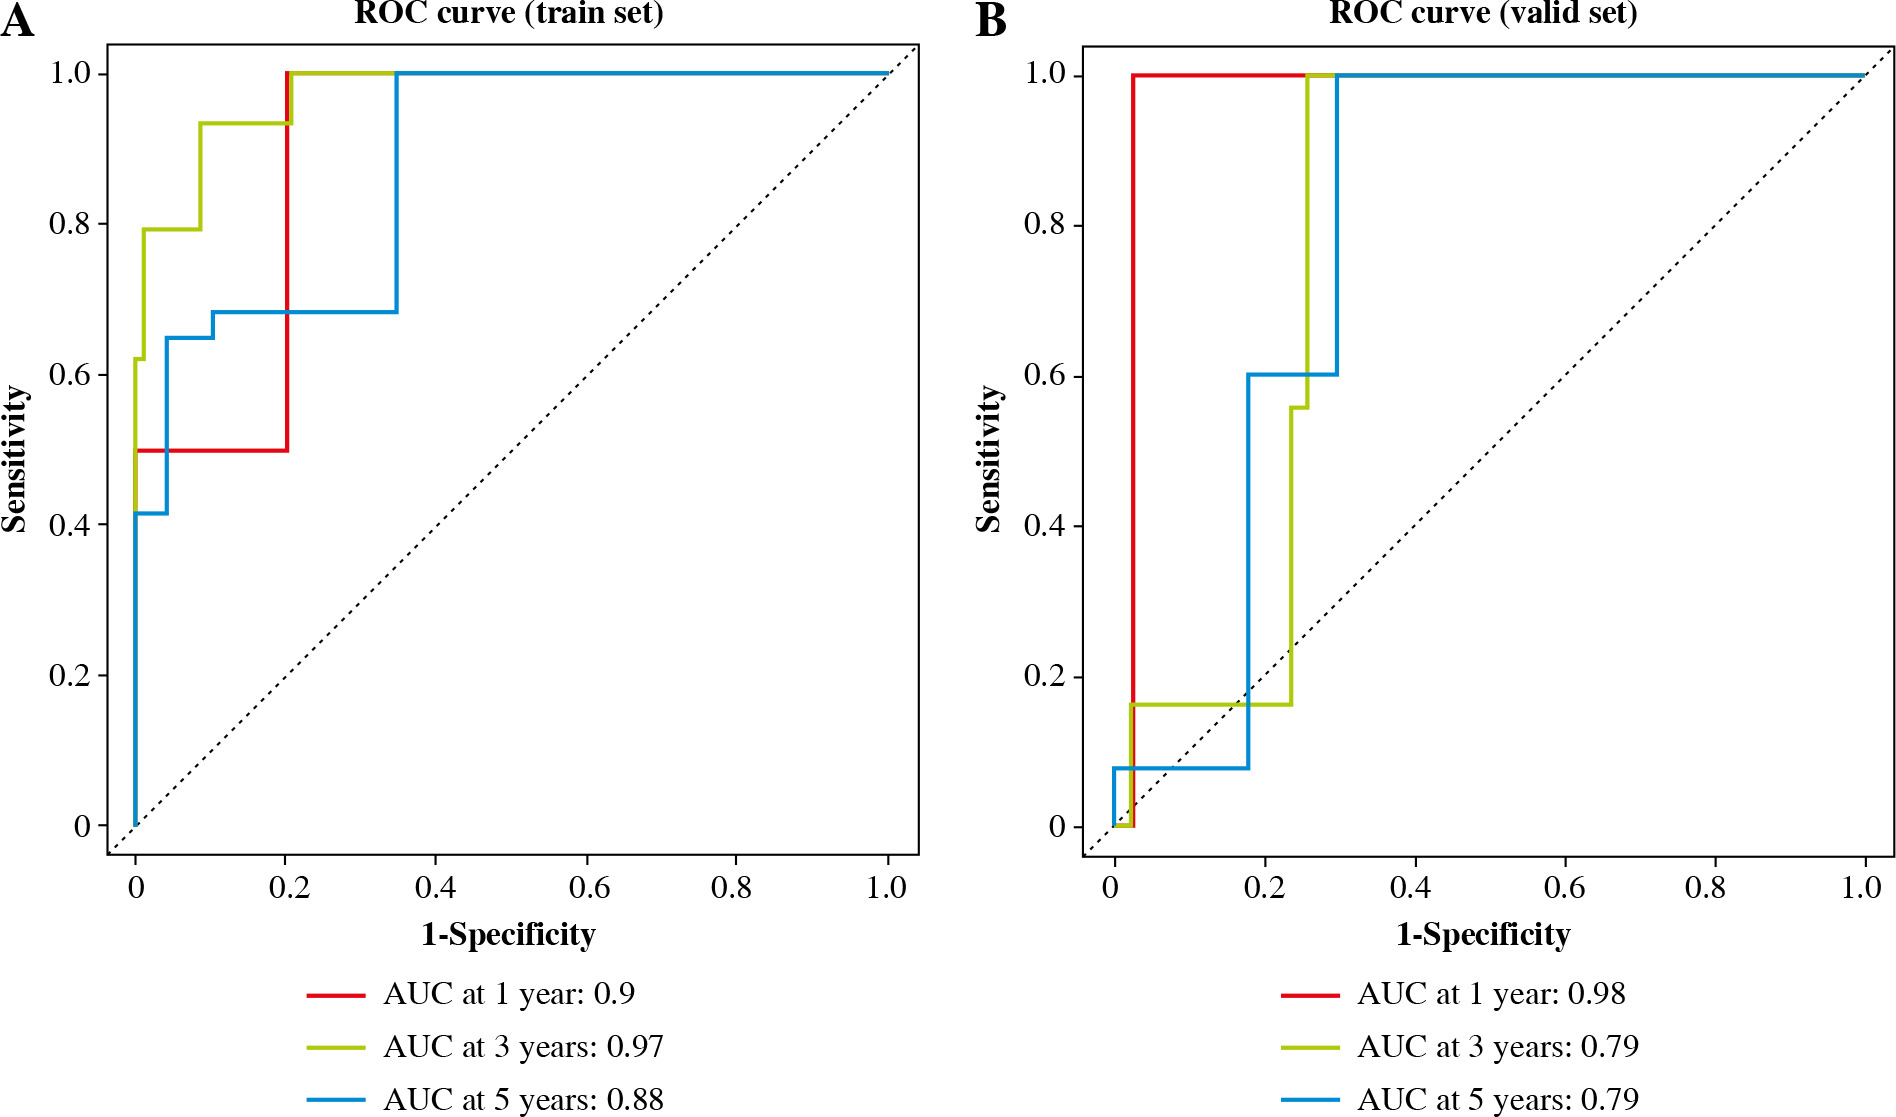
The risk value of each TC sample in the training set was calculated based on the 6-gene prognostic model. Patients were assigned to high-risk and low-risk groups (Fig. 5A). Then, the survival distribution figure of TC patients and the KM curves of the two risk groups were drawn (Fig. 5B, C), and the survival analysis of the two groups in the validation set was conducted (Fig. 5D). The results revealed that the OS of samples in the low-risk group was notably longer than that in the other group. Subsequently, we analyzed the expression patterns of 6 feature genes, and it could be seen that the expression of feature genes increased with the increase of risk score (Fig. 5E). The timeROC package was employed to draw the time-ROC curve. The results showed that 1-, 3-, and 5- year survival rates of patients were predicted by the prognostic model in the training set, with 0.9, 0.97 and 0.88 AUC values respectively (Fig. 6A). The prognostic model in the validation set was used to further verify the 1-, 3- and 5-year survival of patients, with 0.98, 0.79 and 0.79 AUC values respectively (Fig. 6B). It was confirmed that the risk score obtained from the 6-gene risk model based on the training set has a certain predictive ability for the prognosis of TC patients.
Fig. 5
Performance assessment of 6-gene prognostic risk model. A) Distribution of risk scores of thyroid cancer (TC) patients in the high-/low-risk group in the training set, with green representing low risk and red representing high risk. B) Survival distribution map of TC patients in the training set by the risk score, with green representing surviving patients and red representing dead patients. C) Kaplan-Meier (KM) survival curve of patients in the two risk groups in training set. D) KM survival curve of patients in the two risk groups in validation set, with blue representing low risk, red representing high risk E) Heat map of survival of patients in the high- and low-risk groups
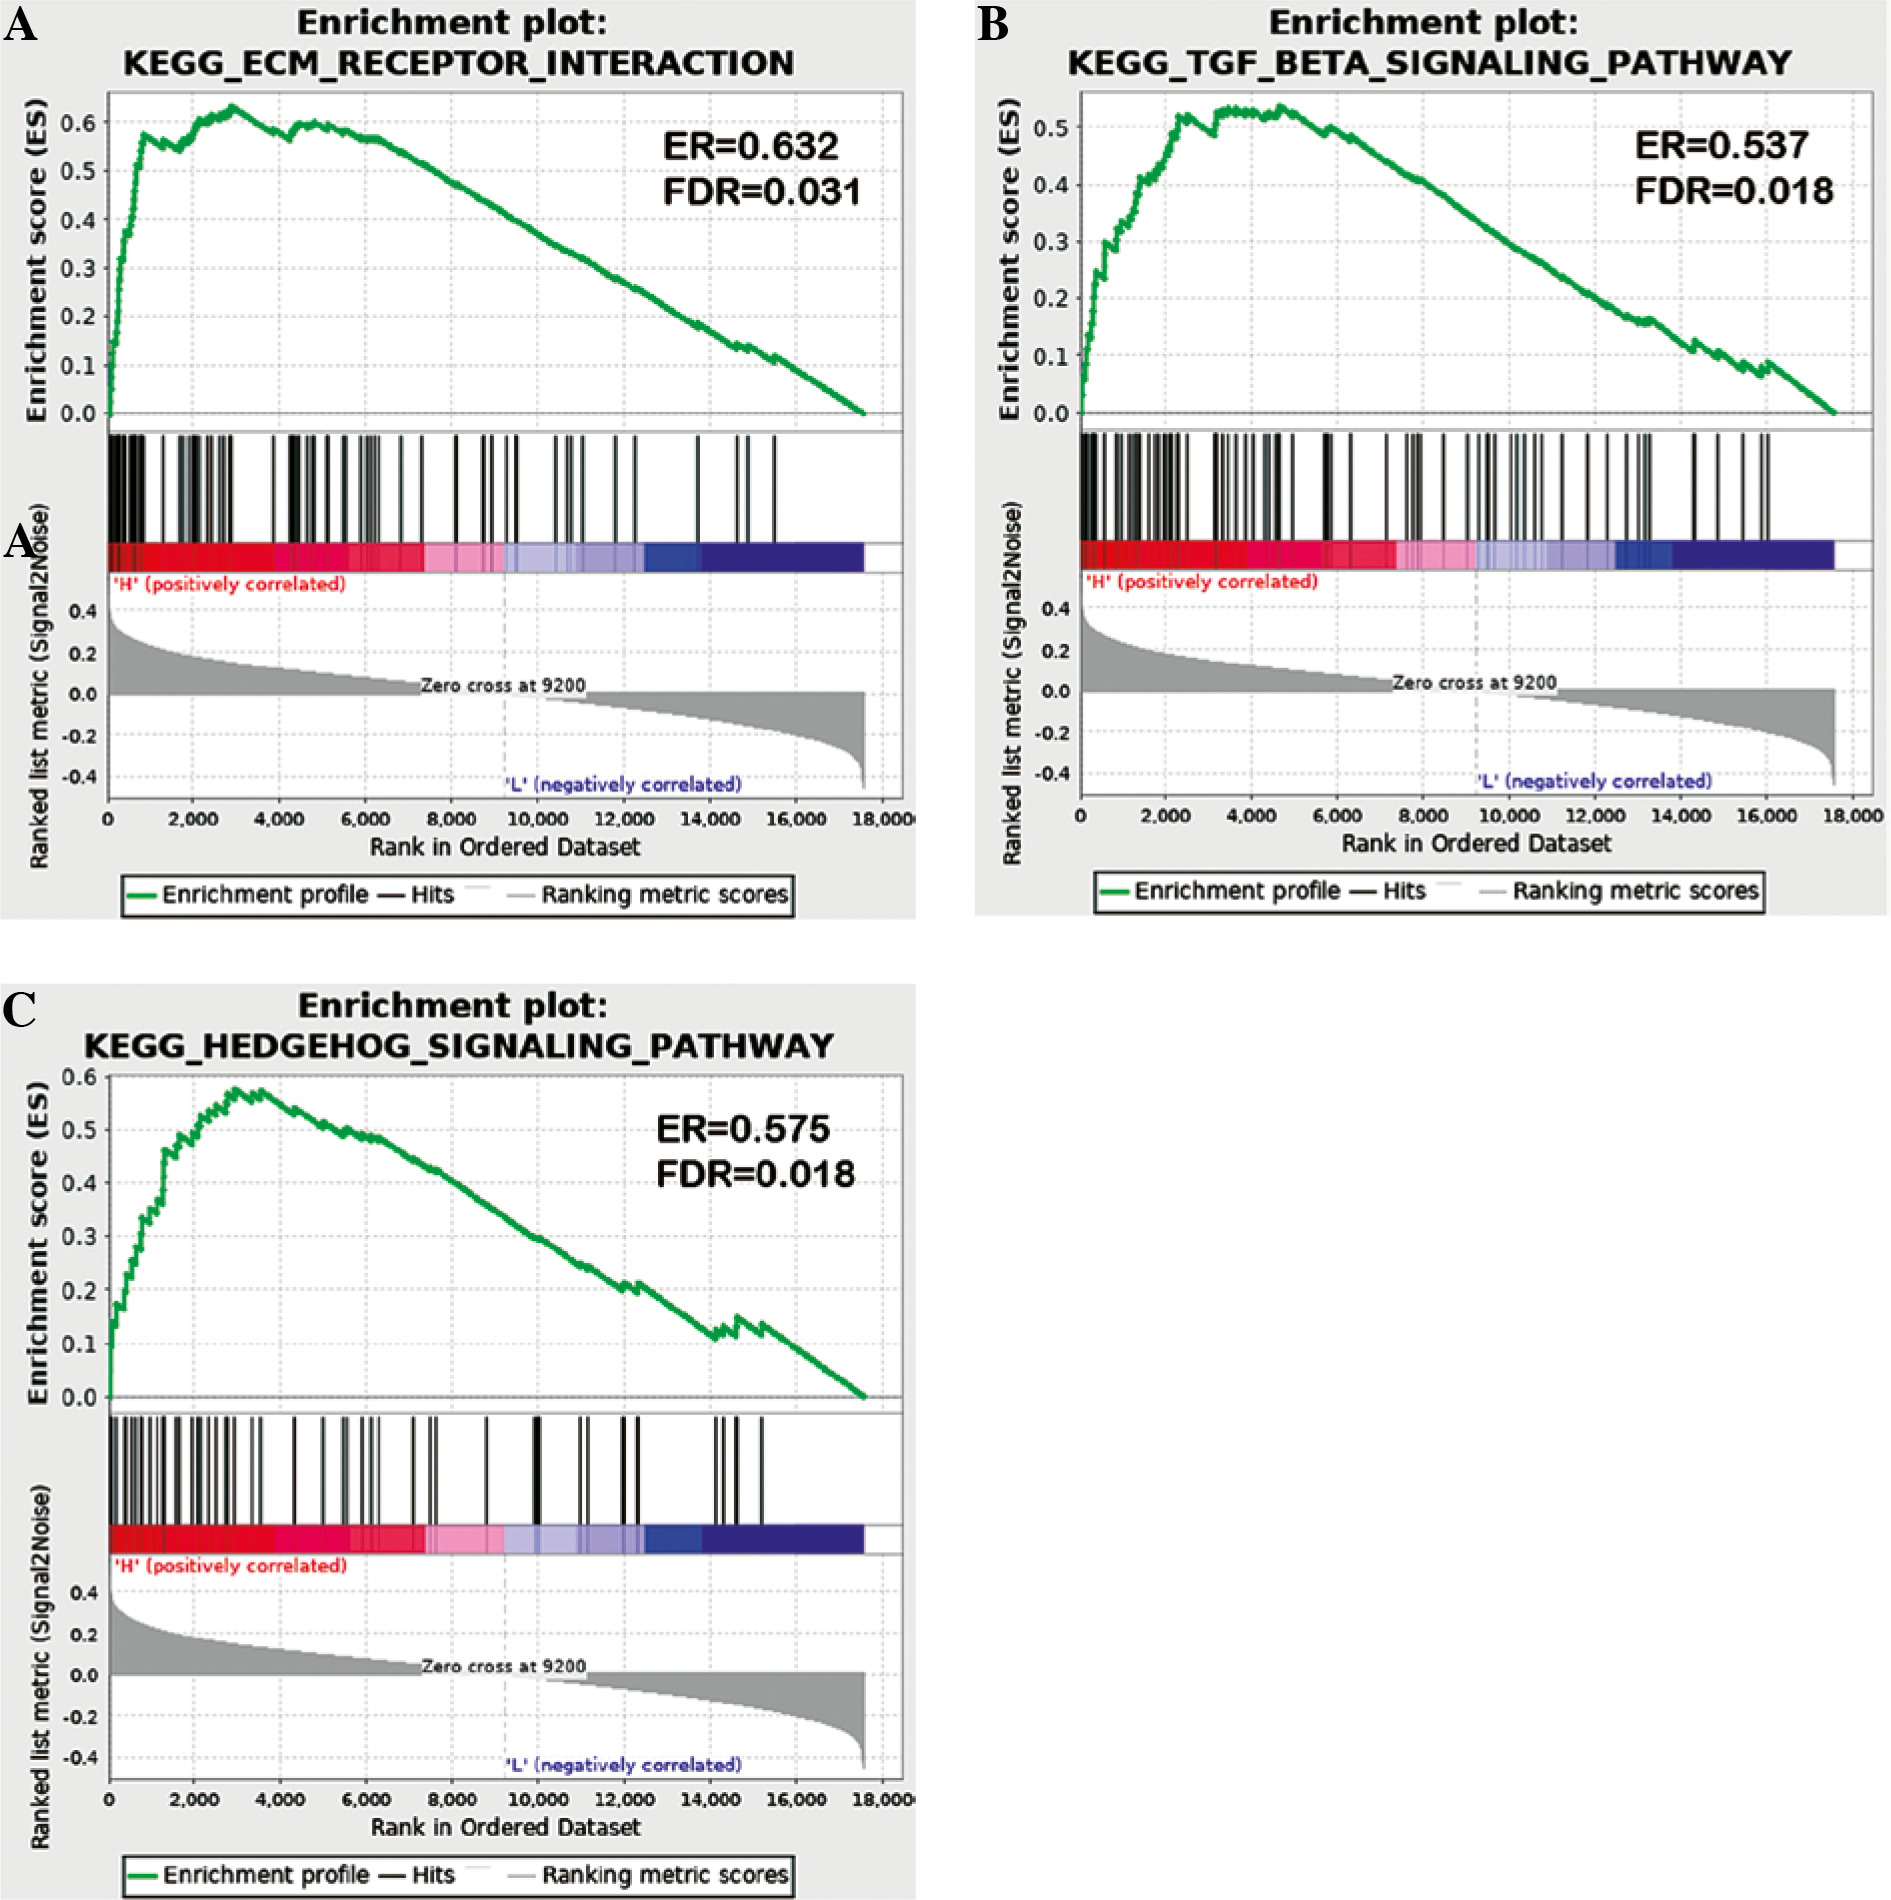
Gene set enrichment analysis results
GESA software was applied to analyze the key signaling pathways that affected OS differences in TC samples. Differences in ECM receptor interaction, the hedgehog signaling pathway and the transforming growth factor β (TGF-β) signaling pathway were compared between the two risk groups (Fig. 7). These pathways were all related to immunity, and differences in immune-related pathways may be the reason for the high and low risk of TC patients.
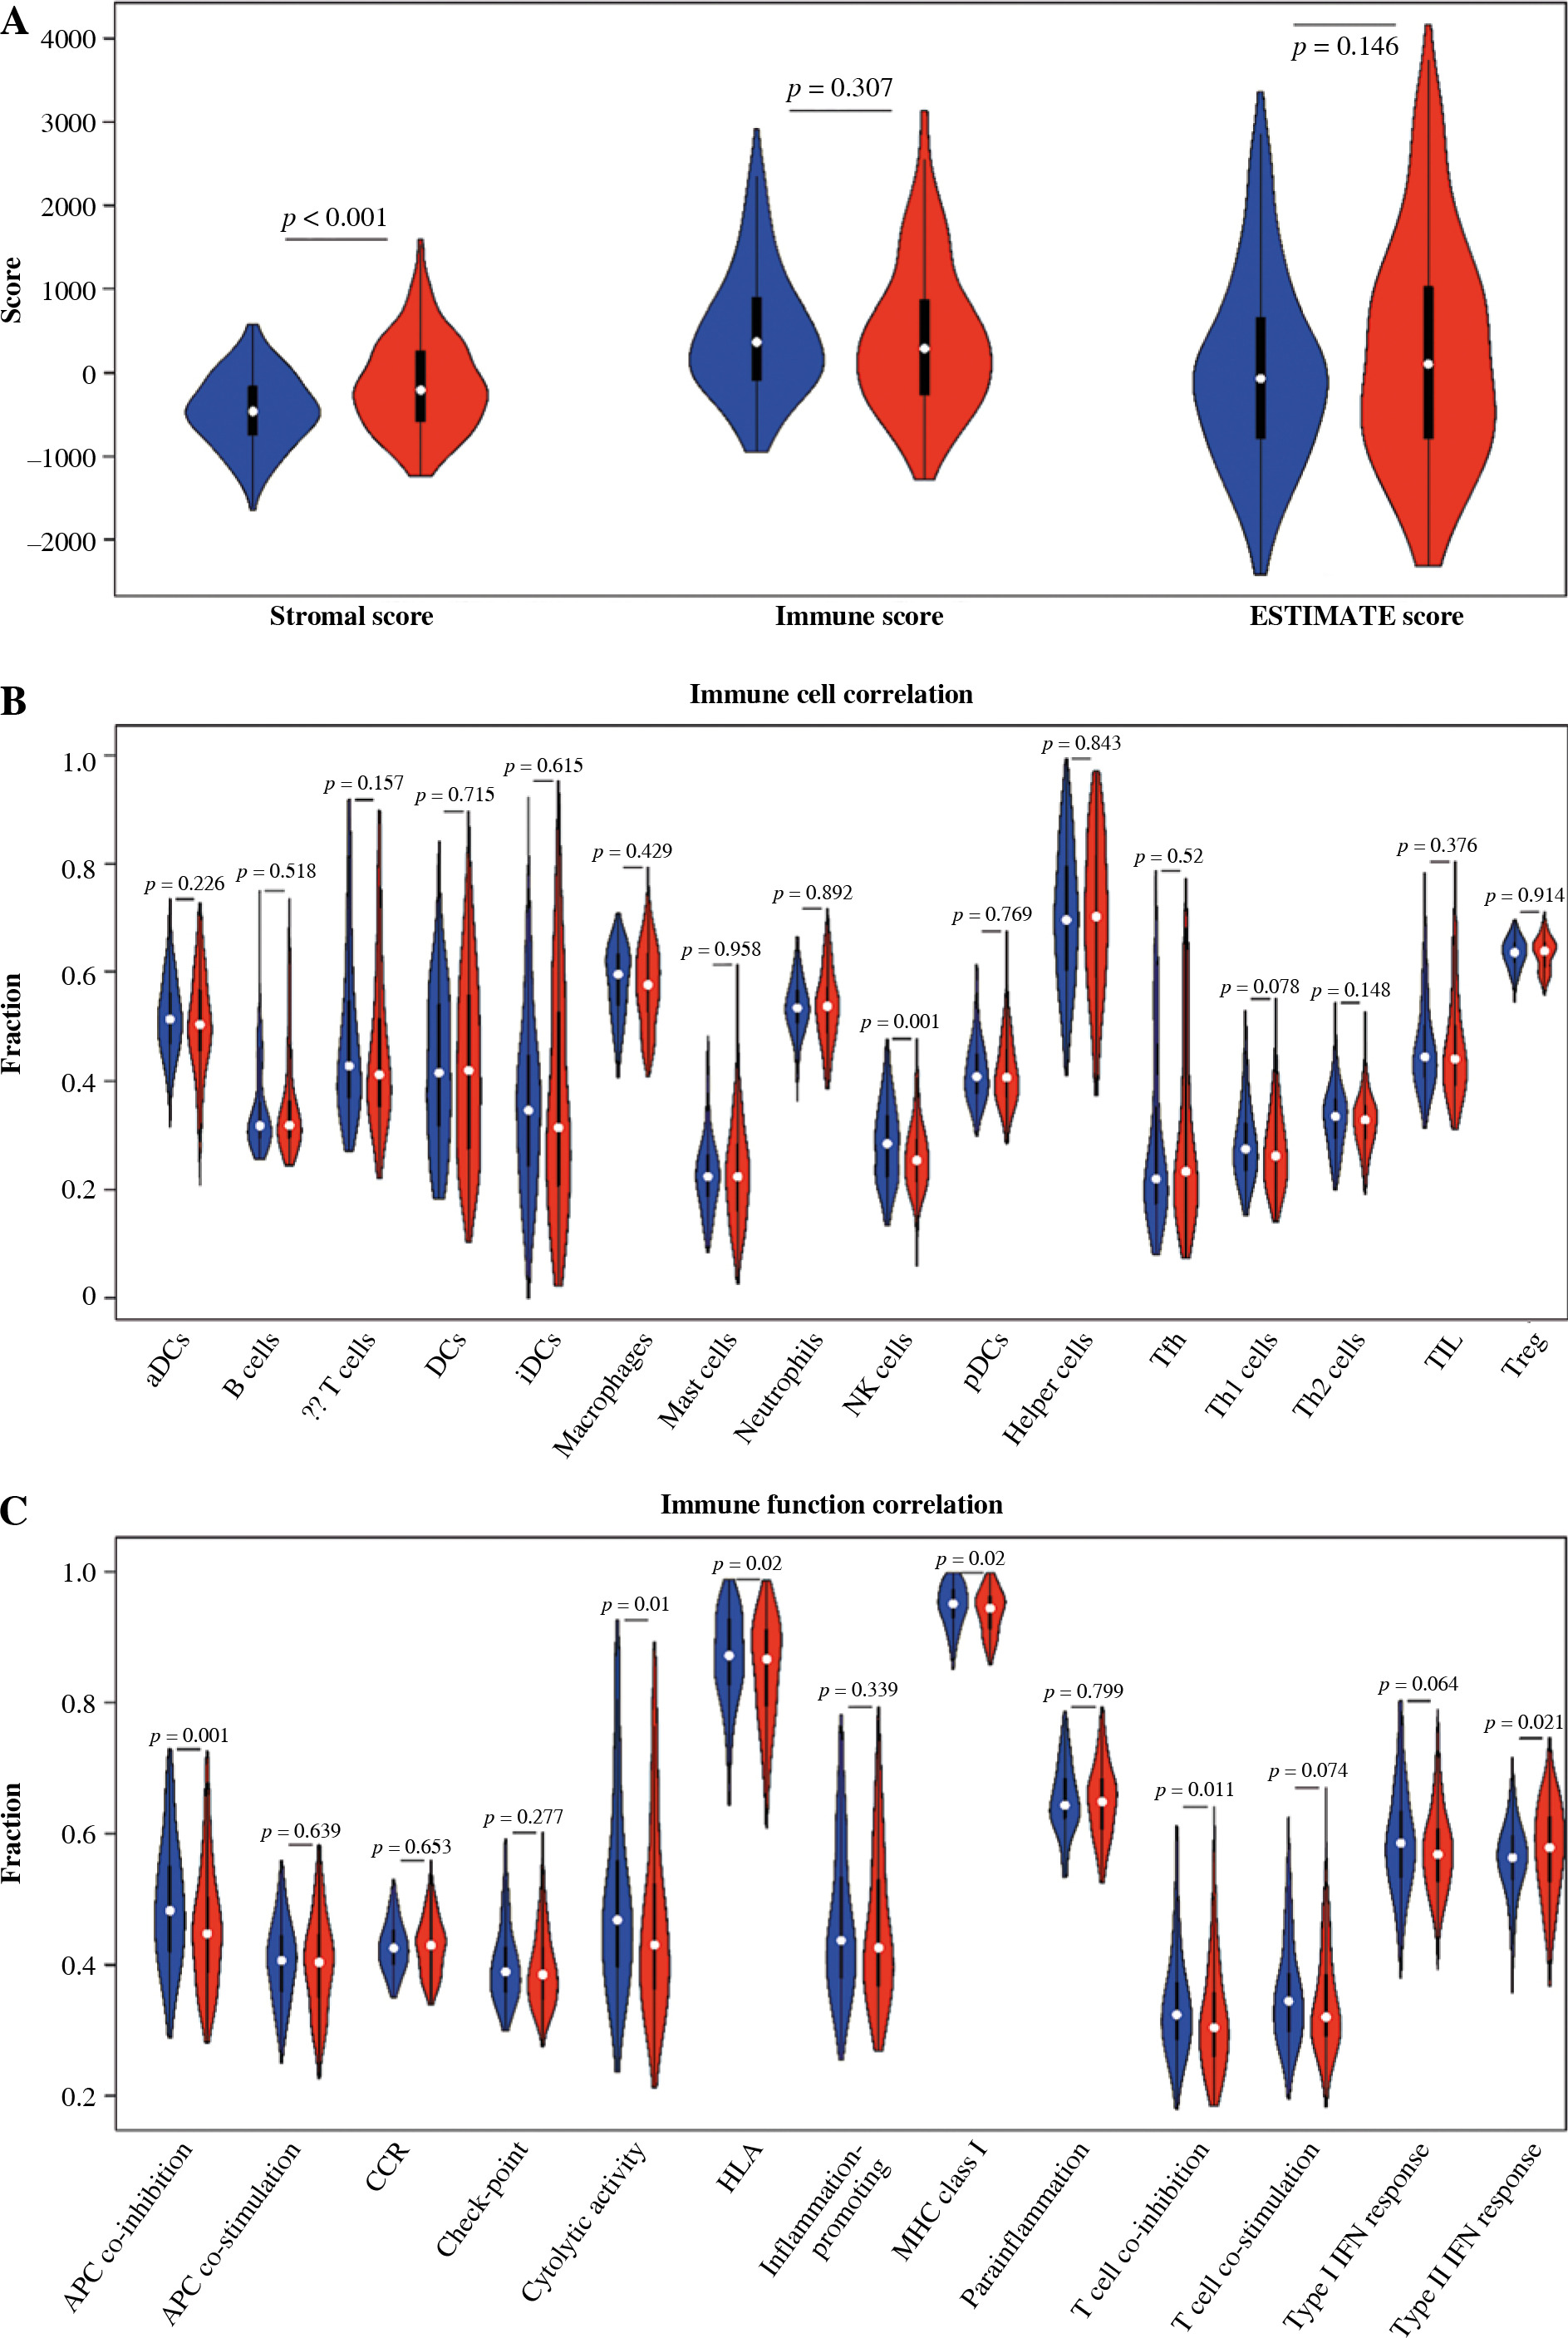
Immune infiltration assessment
The stromal and immune cells of TC samples in the TCGA-THCA dataset were scored using the ESTIMATE package, with stromal scores ranging from –1677.8078 to 1591.0739, immune scores ranging from –1285.1845 to 3204.7238, and ESTIMATE scores ranging from –2418.0121 to 4167.0835. Differences in the stromal score, immune score, and total score in the two groups were analyzed. It was proved that the stromal score in the high-risk group was higher than that in the other group, while the immune and ESTIMATE scores were not considerably different between the two groups (Fig. 8A). The enrichment results of ssGSEA showed that the NK cell infiltration level was lower in the high-risk group. In terms of the function of immune-related genes, APC co-inhibition, cytolytic activity, HLA and T cell co-inhibition were activated in the low-risk group (Fig. 8B, C).
Discussion
Due to the increased recurrence rate of TC, the incurable rate and mortality rate of patients have increased [18]. Therefore, the accuracy of prognosis prediction is particularly important. Cancer immunotherapy utilizes the immune mechanism of the human body through active or passive methods to enhance immune function, thus achieving the purpose of killing tumor cells. It is generally accepted that peripheral lymphocytes at the edge of tumors and lymphocytes in direct contact with tumor cells are of great significance for the prognosis of patients with tumors [4]. The tumor immune microenvironment and infiltrating CD8+ T lymphocytes can improve the therapeutic effect of multiple types of tumors. The advantage of immunotherapy is that memory CD8+ T cells can be generated to provide lasting protection for the body, thus preventing metastasis and recurrence [19].
In this study, the composition of TC immune cells was analyzed to select immune cells that are markedly associated with the prognosis of patients. Six feature genes (MYL3, CILP, PCOLCE2, HMGCS2, PPBP, GCGR) that were remarkedly correlated with the OS of TC patients were screened by analyzing abnormal expression genes in CD8+ T cells, and the 6-gene prognostic risk assessment model was established. The prognostic risk of TC patients was predicted in terms of 6-gene expression. HMGCS2 is a mitochondrial enzyme involved in the ketogenic pathway. Hao et al. [20] explored HMGCS2 as a biomarker closely related to tumor lipid metabolism and immune response through immune microenvironment analysis of pan-cancer. HMGCS2 is involved in the occurrence, progression and survival of many cancers. For example, the expression level of HMGCS2 in colon cancer tissue is negatively correlated with angiogenesis [21]. The protein encoded by PPBP is a platelet-derived growth factor. It was demonstrated that the expression of PPBP can function as a prognostic biomarker of gastric cancer, colorectal cancer and non-functional pituitary adenoma [22-24]. GCGR is a glucagon receptor, which can be used as a prognostic marker of TC [25], and silencing of GCGR with small interfering RNA attenuates the impact of glucagon on colon cancer [26]. PCOLCE2 encodes a kind of collagen protein, which has been confirmed to function as a cancer-promoting factor in ovarian cancer [27]. MYL3 encodes the myosin light chain and is associated with cardiac diseases. Cartilage intermediate layer protein (CILP), which encodes for cartilage meso-protein, is associated with joint diseases. However, the relationship between these two genes and tumors has not been reported. Comprehensive analysis indicated that the immune-related genes in CD8+ T cells screened in this study were not only related to the prognosis of TC, but also could be utilized as an underlying therapeutic target.
Gene set enrichment analysis results confirmed that ECM receptor interaction, the TGF-β signaling pathway and the HEDGEHOG signaling pathway were prominently up-regulated in the high-risk group. ECM is a complex giant network constituted by various cells, including numerous immune cells. Changes in ECM lead to corresponding changes in clinical manifestations of patients. For instance, in tumor cells of non-small cell lung carcinoma patients, high levels of T cells and high expression levels of fibroblast activation protein (FAP) on cancer-associated fibroblasts (CAF) are associated with better prognosis [28]. The TGF-β signaling pathway can regulate the production and effector functions of various kinds of immune cells, which is the core of immunosuppression in the tumor microenvironment [29-31]. Studies also indicate that increased TGF-β level and increased CAF expression level lead to a subtype with adverse prognosis of patients with colorectal cancer, and the use of TGF-β signaling inhibitors can repress tumor progression [32]. The hedgehog signaling pathway modulates several key developmental processes in vertebrates, including cell proliferation, embryogenesis, and cell fate decision [33, 34]. However, abnormal activation of the hedgehog pathway can cause the occurrence, progression and metastasis of various cancers [35, 36]. Hedgehog polarization in TAM suppresses anti-tumor immunity via CD8+ T cell infiltration in the tumor microenvironment [37]. Therefore, these three pathways may be the key signaling pathways affecting the differences in prognosis of TC patients.
As immune cell infiltration is considered important for the tumor microenvironment, we scored the immune cells and stromal cells in TC samples. The differential expression analysis indicated that the stromal cell score was considerably higher in the high-risk group, while the immune score and ESTIMATE score did not differ notably between the two groups. Immune infiltration levels were assessed in each TC sample using ssGSEA and higher NK cell infiltration levels were found in the low-risk group compared to the other group. NK is a cytotoxic effector of the innate immune system, which can identify and eradicate tumor cells without prior sensitization [38]. The higher the level of NK cell immune infiltration, the longer is the survival time of patients [39]. We investigated APC co-inhibition; cytolytic activity, HLA and T cell co-inhibition were activated in the low-risk group. It was found that cytolytic activity in the tumor is closely correlated with CD8+ T cell immune infiltration [40]. Hurkmans et al. [41] demonstrated that the combination of PD-L1 expression, CD8+ T cell infiltration, TML, and class I HLA can be used as a predictive biomarker of the anti-PD-1 immunotherapy response of non-small cell lung cancer (NSCLC) patients. Analysis of T cell co-inhibition in the tumor microenvironment by Baitsch et al. [42] showed that compared to blood, coinhibitory molecules LAG-3, TIM-3 and CTLA-4 are upregulated in total CD8+ T cells in the tumor infiltrated lymph node. Finally, we screened CD8+ T cell associated gene signatures and examined the prognostic performance and the potentially involved pathways of the signatures.
There are still limitations of this study. First, this study is a retrospective experiment based on public database data, and the prediction model is based on the training data set. We did not use clinical samples for external verification. Second, we mined 6 feature genes associated with CD8+ T cells but did not design experiments to investigate the mechanism of these genes participating in the T cell immune response. Finally, the samples used are from diverse thyroid cancer types in which follicular thyroid cancer samples account for the majority; therefore the model is not suitable for one specific type of thyroid cancer. Considering the situation above, we plan to construct our thyroid cancer sample library and construct prognostic models for specific thyroid cancer subtypes.
To sum up, in this study based on screening 6 immune-related feature genes in CD8+ T cells and prognosis of TC a risk assessment model was established and the risk scores generated by the prognostic model can act as an independent prognostic factor. Six feature genes may be the potential targets for treatment of TC, which can provide a reference for clinicians to determine the prognosis of TC patients and design personalized diagnosis and treatment plans.