
INTRODUCTION
Allergic rhinitis (AR) is the most prevalent allergic disease affecting individuals across all age groups [1, 2]. A systematic review and meta-analysis of cohort and cross-sectional studies published from 2012 to 2022 demonstrated a substantial impact of AR on paediatric epidemiology. The overall prevalence of patient-reported lifetime AR in children was 19.93%, with considerable variation observed across countries [1]. In a large-scale epidemiological Polish study, ECAP, the prevalence of declared AR ranged from 23.7% (for children aged 6–7) to 24.6% (for children aged 13–14) [2].
Pollen allergens represent a significant environmental factor influencing the occurrence of AR. During the pollen season, anthers of wind-pollinated plants release substantial quantities of pollen grains, which are male gametophytes involved in fertilizing seed plants. Pollen grains can remain airborne for many days and may be transported long distances from their source [3]. In Poland, AR symptoms in spring are primarily attributed to trees belonging to the order Fagales, the family Betulaceae, the genera Corylus (hazel), Alnus (alder), and Betula (birch) [4]. Exposure to tree pollen allergens begins with the onset of the hazel pollen season, usually in February, and sometimes as early as in January. Alder pollen is also among the earliest tree pollens to emerge each year. The main pollen season for hazel and alder occurs in February and March [5]. In April, birch pollen is the main component of natural bioaerosols. The main birch pollen season is in April and early May [6]. Birch has the highest allergenic potency among trees found in northern, central, and eastern Europe, followed by alder and hazel [7]. Alder and hazel pollen allergens are homologous to those of birch, leading to cross-reactions [8]. As a result of early pollination and cross-allergic reactivity, hazel and alder are not only responsible for allergy symptoms in February and March, but are also attributed with a “priming effect”, which lowers the sensitivity threshold to Betulaceae pollen allergens, making clinical symptoms more pronounced during the birch pollen season [7, 9]. Pollen from pine (Pinus spp.) and spruce (Picea spp.), which are coniferous trees in the Pinaceae family belonging to the gymnosperm group, constitute one of the major components of bioaerosols during May and early June. Although several reports of allergy to pine pollen have been published, pine pollen is generally not regarded as a contributor to allergic diseases [10, 11]. However, due to its abundance in the atmosphere prior to the grass pollen season, pine pollen may serve as a prepriming factor that influences subsequent reactivity to grass pollen allergens [12].
The nasal filtering mechanism causes airborne pollen grains to deposit within the nasal cavity. Upon contact with the moist nasal mucosa, pollen allergens rapidly migrate through micro-channels to the pollen surface, initiating a cascade of IgE-mediated allergic responses in sensitised individuals [13].
The deposition of inhaled particles is influenced by particle size, ventilation parameters, and airway morphology [14]. The parameters describing intranasal spaces depend on age [15]. Compared to adults, 5-year-old children have a different nostril shape, a smaller and narrower nasal cavity and nasopharynx lumen, a smaller nasal airway surface area, shorter nostril-to-valve distance, and nasal valve cross-sectional areas [16]. Variations in airway geometry between children and adults suggest that age could influence particle deposition patterns within the nasal cavity. The impact of age-related anatomical changes in children has been studied by researchers using in vivo methods [17], in vitro methods [16, 18–21], and in silico/numerical methods [16, 22–27]. The development of 3D printing techniques has enabled the production of accurate physical models of anatomical structures used in in vitro research. However, studies on pollen grain deposition in the nasal airways of children are still rare [26].
AIM
The aim of the study was to experimentally analyse the deposition of allergenic tree pollen within a three-dimensional paediatric nasal cavity model under various stable flow rates.
MATERIAL AND METHODS
This study employed the same methodological framework as detailed in our previous paper by Rapiejko et al. [28], with the primary change being the use of a 3D paediatric nasal cavity model (PNCM) instead of an adult one, and the application of age-appropriate airflows.
POLLEN: HANDLING PROTOCOL AND CHARACTERIZATION
This study utilized pollen grains from five distinct species: Corylus avellana, Alnus glutinosa, Betula pendula, Pinus sylvestris, and Picea abies. The acquisition of research material (tree pollen) required data collected in Warsaw by the Allergen Research Center using the continuous volumetric measurement method [29]. Phenological observations of the specimens were conducted to identify the optimal period for inflorescence collection. Approximately 100 catkins from each specimen were collected before the flowers fully opened and stored in a dry condition for several days [30]. After the beginning of pollen shedding, the mature grains released from the microsporangia were sifted. Experiments were conducted within several days, as pollen remains viable at room temperature and low humidity for this period [31].
To characterise pollen grains, three techniques were employed: particle size distribution (PSD) measurement in the aerosol phase using laser diffraction (Spraytec, Malvern Instruments, UK), scanning electron microscopy (TM-1000, Hitachi, Japan) at magnifications ranging from 250× to 4000×, and light microscopy at 400× magnification. The results are detailed in Results
ANATOMICAL 3D MODEL OF THE PAEDIATRIC NASAL CAVITY (PNCM)
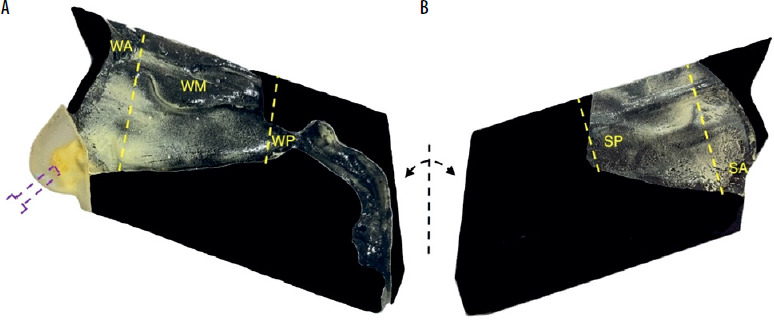
The methodology was initially described and validated by Sosnowski et al. [32]. The study was conducted using a 3D anatomical model of the right half of the nasal cavity of a 7-year-old girl, validated in a previous study on the deposition of intranasal corticosteroids by Sosnowski et al. [21]. The model was reconstructed using rapid prototyping from CT scans (Siemens Emotion VI scanner, layer thickness: 0.63 mm) and assembled from two parts: the nasal cavity, which contained the sidewall, and the plate, which contained the right side of the septum. The model was made of the rigid acrylic polymer RGD720, while the material for the vestibule with the nostrils was the elastic acrylic polymer FLX930, allowing for a realistic fit of the atomizing nozzle in the nostril [21]. The inner surfaces of the 3D PNCM prints were painted black to improve the contrast and visibility of yellow pollen grain deposits. Figure 1 presents the resulting printouts. The segmentation of the nasal cavity was determined according to prior models, which identified significant variability in airflow and particle deposition within anatomical regions [16, 22]. Prior to testing, surfaces were coated with a thin layer of 1% Triton X-100 in glycerol to replicate the properties of nasal mucus and reduce the reflection or re-emission of pollen grains.
Figure 1
Components of the paediatric nasal cavity model (PNCM), printed in 3D technology with pollen deposits (yellow areas): A – lateral wall with nasal concha, nasopharynx, and oropharynx, B – nasal septum. The purple dotted line indicates the location of the air inlet. The yellow dotted lines indicate the division of the nasal cavity into segments: WA – wall anterior, WM – wall middle, WP – wall posterior (with nasopharynx and oropharynx), SA – septum anterior, SP – septum posterior
DEPOSITION ANALYSIS WITH MACROSCOPIC IMAGE ANALYSIS
Figure 2 shows the experimental setup diagram. A customised fluidised bed dispenser (FBD) was filled with approximately 50 mg (±10%) of pollen, the exact amount being measured using an analytical balance (Radwag, Poland). Air from a medical nebuliser compressor (model Nano, Diagnostics, Poland) was directed into the FBD to aerosolise the pollen. The PNCM, mounted between rigid plastic plates with positioning marks, maintained repeatability and even pressure. To measure nasal cavity deposition, the dispenser tip was inserted and aligned with the nostril’s central axis, then airflow was activated through the PNCM.
Figure 2
Schematic representation of the experimental setup: 1 – compressor, 2 – fluidised bed dispenser (FBD), 3 – the paediatric nasal cavity model (PNCM), 4 – filter, 5 – valve with flowmeter, 6 – vacuum pump. The arrows show the airflow direction
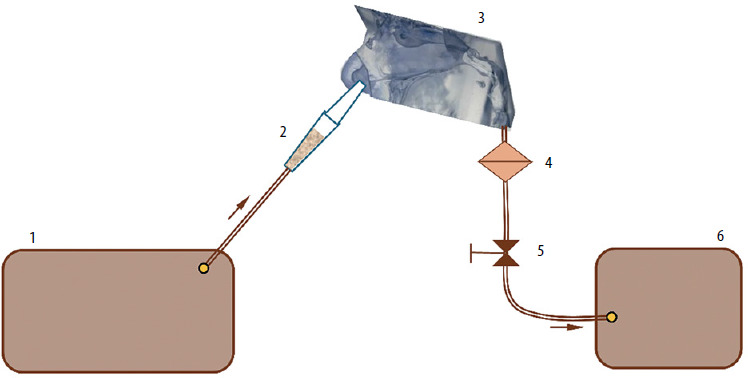
A laboratory vacuum pump, regulated by a valve, generated steady airflow through the PNCM to simulate various body activity levels, measured by a mass flow meter (model 4040, TSI Inc., USA). Constant flows were applied to a single cavity (2.5, 5.0, and 7.5 L/min), corresponding to about 5, 10, and 15 L/min total nasal flow during symmetrical breathing. In reality, the split depends on the nasal cycle and left-right resistance asymmetry. For a 7-year-old, these rates match rest or calm breathing (3–5 L/min), rest-to-light activity (9–10 L/min), and light to moderate activity (9.5–18.9 L/min) [25].
After the pollen had settled, the PNCM was dismantled. Each component, including the lateral wall of the nasal cavity and septum, was photographed using an iPhone X (Apple, Cupertino, USA). Custom software written in the Python programming language was used to analyse the images, identifying and measuring the surface areas covered by deposits in each PNCM segment [32]. The experiments were done in four independent repetitions for each flow x pollen type combination.
STATISTICAL ANALYSIS
Two variables were analysed, both expressed as percentages. The first variable was segmental surface deposition, defined as the percentage of a segment’s surface area covered by pollen. The second variable was a segment share of total lateral wall deposition/segment share of total septal deposition (lateral wall share %/septal share %), the latter being an area-weighted transformation of the former. This was calculated as the area-weighted percentage of the entire lateral wall or septum covered by pollen in each segment. Experiments included five aerosol types and three steady flow rates (2.5, 5, and 7.5 L/min per nostril). Segment measurements were paired for the lateral wall with nasopharynx (WA, WM, WP) and the septum (SA, SP). One-way ANOVA was used to assess the segment effect for each combination of aerosol, flow rate, and wall. Due to small sample sizes and potential violations of the assumptions, the Kruskal-Wallis test was also applied. Paired samples t-tests evaluated planned differences between WA-WM and WA-WP. F-statistics, degrees of freedom, p-values, and effect sizes (η2) were reported. All tests were two-tailed with an α level of 0.05. The Holm–Bonferroni correction was used for multiple comparisons [33]. According to Cohen, η2 values above 0.14 indicated large effect sizes. Results for the first variable were presented in a table (median, IQR [Q1-Q3], ANOVA results). The second variable was shown in box plots.
RESULTS
POLLEN CHARACTERISTICS
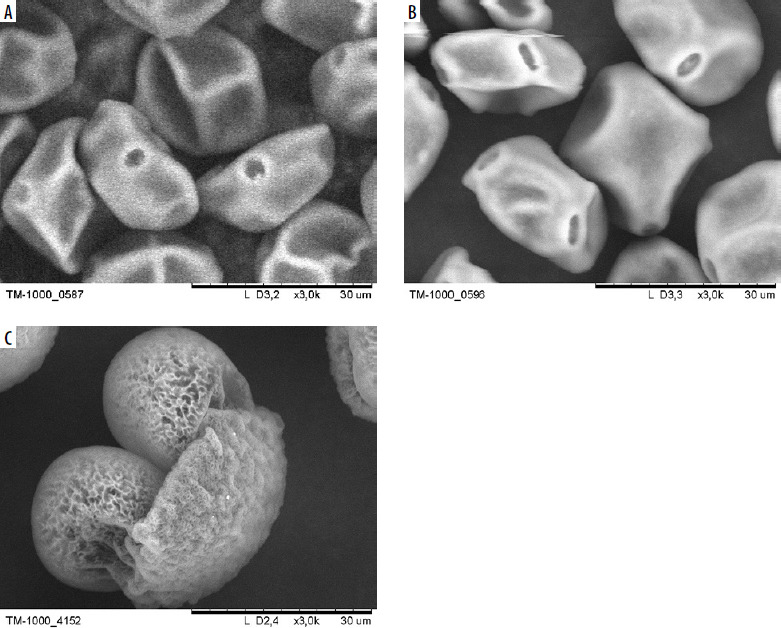
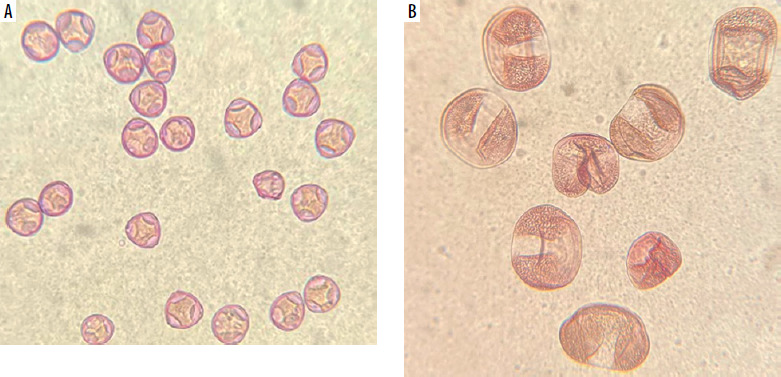
SEM images of pollen grains are presented in Figure 3. Pine pollen grains not only differ in morphology from birch and alder pollen grains but are also larger. The average sizes are: birch pollen, 25 µm; alder pollen, 25–30 µm; pine pollen, 50 µm. However, the original morphology and size may be affected by SEM imaging due to the vacuum environment. To address this, Figure 4 presents pollen grains observed under light microscopy, providing a more accurate representation of their true appearance. Hazel (Corylus) pollen grains are 22–30 µm in size, and are classified as trizonoporate, having three pores situated in the equatorial zone. The exine and intine are thin. Large onci, which are lens-shaped structures situated below the apertures, are present (Figure 4 A). Alder (Alnus) pollen grains are 20–35 µm in size, generally spherical, and exhibit stephanoporate morphology with four or five pores. These pores have annuli around them, with arci (thickenings) stretching between each pore (Figure 3 B). Birch (Betula) pollen grains are approximately 20 µm in size, suboblate to spheroidal, and triporate with a vestibulum (ectexine separated from endexine around the pores), and they have small onci [34] (Figure 3 A). Coniferous trees display distinct pollen morphology. Pine (Pinus) pollen grains are approximately 50-60 µm in size, exhibit bilateral symmetry, and feature a corpus and air sacs, which make them highly buoyant (Figure 3 C). Spruce (Picea) pollen is slightly larger (50–90 µm), and its sacs are small in proportion to the size of the grain. They both have slightly thick exine [34, 35] (Figure 4 B).
The particle size distribution of birch, alder, hazel, pine, and spruce pollen was determined using laser diffraction following aerosolisation with FBD. The results obtained show significant differences in the distribution profiles. The data obtained for birch pollen indicate a bimodal distribution, characterised by a dominant fraction of particles with a diameter of 15–30 µm, typical for single pollen grains, and the presence of larger agglomerates above 100 µm, indicating fragmentation and aggregation of pollen in the environment. Similarly, alder pollen formed a bimodal aerosol, dominated by the 18–35 µm fraction (single grains) and also containing aggregates of 120–150 µm in size. Hazel pollen exhibited a narrow, unimodal distribution, with single grains of 22–34 µm, while larger aggregates were present in only minimal amounts. The size distribution of both pine and spruce pollen was found to be unimodal, moderately narrow, with a maximum frequency of approximately 50–60 µm for pine and 50–90 µm for spruce, with a minimal proportion of larger aggregates.
REGIONAL POLLEN DEPOSITION BASED ON MACROSCOPIC IMAGE ANALYSIS
Deposition of birch, alder and hazel pollen
The spatial deposition pattern was consistent for birch, alder and hazel pollen and all flow rates. On the lateral wall, the segmental deposition (percent of the given segment’s surface area covered by pollen) was highest in the anterior segment (WA), moderate in the middle (WM), and lowest in the posterior (WP) (ANOVA test, p < 0.001). As airflow increased, segmental deposition was significantly higher in WA but decreased in WM and WP, with WP consistently showing the lowest values. This shows how higher air velocity increases inertial deposition. For pollen grains larger than 20 µm, inertial effects dominate deposition in the nasal cavity, causing them to impact surfaces rather than follow airflow. For the septum, segmental deposition differed (ANOVA test, p < 0.001) between the anterior (SA) and posterior (SP) segments, with SA always showing greater coverage. Increasing airflow made SA deposition rise and SP deposition fall.
Table 1 summarizes the medians and interquartile ranges [Q1–Q3] for birch grain fractions as a percentage of each segment’s surface area on the lateral wall and septum. It also presents one-way ANOVA results, confirmed by Kruskal-Wallis tests (p = 0.007 for the lateral wall; p = 0.021 for the septum). ANOVA results were highly significant for all flows and pollen types (p < 0.001), with large effect sizes (η2 typically ≥ 0.95). This indicates that segment identity explains nearly all observed differences.
Table 1
Analysis of birch and pine pollen segmental deposition in the paediatric nasal cavity model
Paired samples t-tests revealed that WA segmental deposition consistently exceeded that of WM and WP across all grains and flow rates. For all three species, group differences increased with flow (p < 0.001) and reached their highest rate at 7.5 L/min. In birch, WA–WM and WA–WP median differences reached 0.25 and 0.36 at 7.5 L/min, indicating a stronger shift toward the anterior parts. For alder, these contrasts peaked at 0.32 and 0.40 at 7.5 L/min. Hazel showed a similar trend, with 0.31 and 0.40 at the highest flow rates. WP segmental deposition remained minimal at all rates. This reflects increased inertial impaction at higher velocities. At the highest flow, small differences between pollen types appeared: alder, and to a lesser extent hazel, showed a slightly larger anterior–posterior contrast.
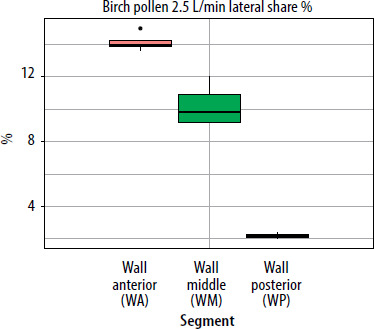
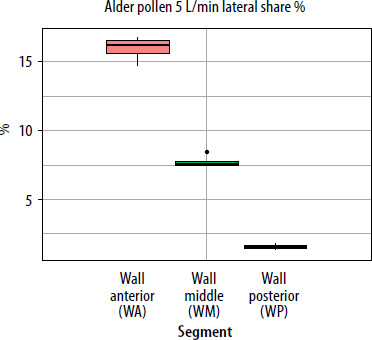
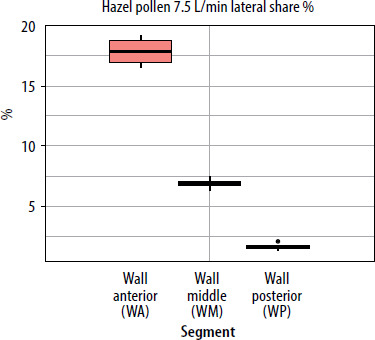
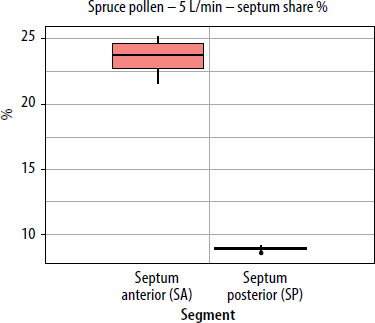
When segmental deposition was compared to the total lateral wall area of the model, the anterior segment (WA) was the largest contributor at all flow rates. WM contributed substantially but less than WA, and WP contributed minimally. As flow increased, the WA share rose, WM share declined, and WP share remained stable or decreased slightly. For the septum, the anterior segment accounted for the largest septal share %. With increased airflow, SA’s lateral share % rose slightly, while SP’s share declined. The results showing lateral wall share %/septal share % (the percentage of the entire lateral wall or septum covered by pollen assigned to a given segment (area-weighted)) for pollen of selected plant species and selected flows are presented in graphs in Figures 5–7.
Figure 5
The segment share of total lateral wall deposition (lateral share %) for birch pollen at a flow rate of 2.5 L/min in the paediatric nasal cavity model
Deposition of pine and spruce pollen
At all tested flow rates (2.5, 5, and 7.5 L/min per nostril), both conifer pollens exhibited a clear anterior-to-posterior deposition gradient. Segmental deposition on the lateral wall of the model was highest in the anterior segment (WA), dropped in the middle (WM), and was nearly absent in the posterior (WP) (ANOVA test, p < 0.001). As flow rates increased, deposition in the WA segment increased for both pollen types. In contrast, deposition in WM and WP decreased, with WM showing the largest relative reduction. On the septum, a similar pattern was observed: the anterior segment (SA) consistently showed the highest segmental load, with a slight increase as flow rose, while posterior septum (SP) deposition declined sharply as flow increased from 2.5 to 7.5 L/min (ANOVA test, p < 0.001).
Table 1 shows the medians and interquartile ranges [Q1–Q3] of the percentage of surface area covered by pine pollen in each segment of the nasal cavity. Significant segment effects were found (ANOVA p < 0.001 at all flow rates, η2 > 0.97). Kruskal-Wallis test results were p = 0.007 for the lateral wall and p = 0.021 for the septum for each pollen type.
Paired sample t-tests show that for pine and spruce pollen, WA–WM and WA–WP median differences increased significantly (p < 0.001) with flow rate, from 0.321/0.530 and 0.287/0.528 at 2.5 L/min to 0.464/0.634 and 0.522/0.681 at 7.5 L/min, respectively. These differences, which grew with flow, indicate greater inertial deposition of 60 µm grains in the anterior nose. The maximum deposition remained anterior, simply amplified by the higher flow.
A similar trend was observed using a second variable; the segment share of total lateral wall (or septum) deposition (lateral/septal share %). As flow increased, the share of the anterior segment (WA) rose, remaining dominant for pine pollen and increasing from 21.7% at 2.5 L/min to 26.8% at 7.5 L/min. The WM segment decreased, while the WP segment remained between 1% and 3% and declined further at higher flow rates. For the septum, the SA segment’s share of the total septum deposition increased slightly with higher flow, indicating that faster inhalation shifts deposition to the front of the nasal cavity. The SP segment’s share decreased as flow rose, and fewer grains (approximately 60 µm in size) reached the posterior segment at higher flow rates (Figures 8, 9).
Figure 8
The segment share of total septum deposition (septum share %) for pine pollen at a flow rate of 2.5 L/min (per nostril) in the paediatric nasal cavity model

Figure 9
The segment share of total septum deposition (septum share %) for pine pollen at a flow rate of 5 L/min (per nostril) in the paediatric nasal cavity model
Pollen grains ~60 µm (pine, spruce) showed a stronger anterior-to-posterior gradient than ~30 µm grains (birch, hazel, alder) due to more dominant inertial impaction at larger aerodynamic diameters. Thus, conifer pollen had higher segmental deposition than alder, birch, and hazel. WA–WP and SA–SP median differences were higher, and the WP or SP contributions were often nearly zero. Particles with greater inertia less readily follow flow bends and more often strike obstacles in front sections. WA-WM and WA-WP median differences increased with flow rates from 2.5 to 7.5 L/min, the effect being stronger for 60 µm grains. For example, at 2.5 L/min, pine WA–WP gap was 0.53 for 60 µm vs. 0.30–0.40 for 30 µm, and rose to 0.63 for 60 µm at 7.5 L/min. At higher flow rates, only minor marginal gains were seen for 60 µm due to saturated front section deposition.
Image analysis revealed higher pollen concentrations, primarily in the anterior parts of the lateral wall (near the nasal valve) and the septum. Significant hotspots were observed in the front part of the inferior and middle turbinates, as well as between them in the middle meatus, rather than along the superior nasal concha. With increased flow, the deposited pollen grains drifted diagonally, moving anteriorly and superiorly.
DISCUSSION
The main result of our experimental analysis was that deposition of tree pollen grains was strongly segment-dependent: the anterior segments (WA, SA) consistently achieved the highest segmental deposition, the middle segment (WM) ranked in the middle, and the posterior segments (WP, SP) contributed marginally, with very large effect sizes (η2 typically > 0.95) and consistent findings across all types of pollen and flow rates.
Several in vitro studies have been conducted using 3D-printed nasal replicas of children of different ages. However, direct comparison between these studies is challenging due to variations in particle size, flow rates, models used, and anatomical definitions of deposition sites. For example, Sawant and Donovan used a 3D paediatric model (12-year-old) and found results similar to ours, that most nasal spray formulations deposit in the anterior regions of the nasal cavity, primarily in the nasal vestibule and nasal valve regions, with minimal transfer of the spray into the turbinate region and no aerosol penetration to the nasopharynx [20]. Sosnowski et al. conducting a study of spray products in a 3D nasal replica of a 7-year-old child, observed that the sprayed droplets of the drugs reached only the anterior parts of the nasal lateral wall and the septum [21]. However, when comparing these findings, it is important to note that the deposition of sprayed droplets occurs under different conditions compared to pollen. This is because sprays enter the nose with high momentum and as a wide plume generated by atomization in a spray pump [21], which is not the case with pollen inhalation. Despite this, the predominant deposition mechanisms remain the same, as both drug droplets and pollen grains are relatively large aerosol particles (larger than 20 μm), which enhances their impact on the surfaces in the nasal cavity in the vicinity of the inlet (i.e., nostrils).
Our analysis showed that higher airflow increases pollen deposition in the anterior nasal segment but reduces penetration into the middle and posterior segments. The most pronounced segmental differences were observed at the highest flow rate. These trends were consistent for all pollen tested, but their strength increased with the size of pollen grains. These findings are similar to the observations of other researchers [23, 26]. Numerical simulations using the CFD technique conducted by Xi et al. at flow rates of 3–30 L/min and particle sizes of 0.5–32 μm showed that nasal deposition in a 5-year-old child depended on the airflow rate. Under conditions of greater physical activity (higher flow rates), particle deposition shifted towards the anterior parts of the nasal cavity (vestibule and valve area) and the middle turbinate [23]. Studies on mugwort (Artemisia) pollen (21.0 μm in size) deposition in the nasal cavity models of children aged 4–6 with adenoidal hypertrophy, conducted with the CFD technique by Hu et al., showed that as inspiratory flow rate increased, approximately 94% of the pollen deposited in the anterior third of the nasal cavity. This included the nasal vestibule and the anterior part of the nasal septum, with almost no deposition of pollen grains in the posterior part of the nasal concha and nasopharynx. However, at lower flow rates, wet Artemisia pollen settled primarily in the nasal septum, then in the nasal vestibule, nasopharynx, and middle turbinate area. The high deposition rate in the nasopharynx, not observed in our study, can, according to the authors of the paper, be attributed to the obstruction of the choana by hypertrophic adenoids [26].
The size and properties of inhaled particles greatly influence the spatial deposition in the nasal cavity [14]. Pollen morphology encompasses a range of diameters and shapes, which in turn may impact aerodynamic properties. Hu et al., in their study of mugwort pollen deposition, determined the shape factor as the ratio of the surface area of a sphere with the same volume as an Artemisia pollen grain to the actual surface area of an ellipsoidal pollen. This value was found to be very close to 1. Consequently, the researchers concluded that grain orientation likely has minimal influence on transport and deposition patterns, and particle orientation was therefore not considered [26]. Inthavong et al. also used spheres with equivalent aerodynamic diameter as a reference when investigating pollen deposition [36]. A similar assumption was adopted in our study. Our results show that 60 µm pollen grains (pine and spruce) have steeper anterior gradients and minimal posterior involvement compared to 30 µm grains (birch, alder, hazel), with surface-weighted shares focused in the WA and SA. The results are consistent with previous studies [16, 25, 27]. Corda et al. used CFD to analyse deposition of particles from 2 to 60 μm in neonate, infant, and adult nasal cavities, finding that as particle size increases, deposition shifts toward the nasal valve and nasal vestibule [27]. Guo et al. reviewed recent literature on micron particle deposition in the nasal cavity and found that deposition rises rapidly as particle size increases [14].
In the case of bioaerosols, such as pollen grains measuring 20-70 μm, inertial impaction is the primary mechanism for deposition in the nasal cavity. This process is quantified by the Stokes number:
where u [m/s] denotes the velocity of the particle (assumed equal to the velocity of inhaled air), ρ [kg/m3] – particle density, d [m] – particle effective diameter, μ – air viscosity [kg/m•s)], and L – the characteristic size of the air channel. Higher values of Stk indicate stronger effects of particle inertia, resulting in deposition. Particles are less able to follow curved streamlines and impact the wall earlier.
Our previous study used an adult nasal cavity model [28]. Below, we compare those results with findings from the paediatric nasal cavity model. The results in the paediatric model qualitatively corresponded to observations in adults (WA/SA was dominant, WP/SP marginal, WA deposition increased with flow). Quantitatively, the paediatric model shows stronger front-loading (greater WA-WP median differences). This anterior-dominant pattern can be explained by inertial impaction. In the paediatric nasal cavity, the shorter streamlines, tighter curvatures and smaller cross-sections amplify the impact of particles on the walls in the front segments. At similar flow rates, paediatric nasal passages have a smaller L (equation 1) and exhibit higher local velocities (u) in the valve region. These factors increase Stk, causing particles to leave streamlines sooner and deposit shortly after the valve. As a result, the smaller geometry favours deposition in anterior regions before flow can reach posterior pathways.
In adults, in the area-weighted metric on the lateral wall, the middle segment (WM) was the largest (due to its larger surface area), although WA had the highest segmental deposition. In the child model, both segmental deposition and segment share of the total lateral wall deposition clearly favour the anterior segments (WA, SA) for all pollen and flow rates, and an increase in flow only exacerbates this advantage.
In adults, increased airflow significantly increased segmental deposition in the anterior (WA) and middle (WM) segments and decreased in WP. In children, increased airflow also led to an increase in segmental deposition in WA, but it resulted in a decrease in WM and WP. This can be described using equation 1, where an increase in flow primarily causes an increase in the value of u, and thus Stk.
In paediatric geometry, where the Stokes number is already high due to the small air channel (L), increasing airflow (u) intensifies early impaction. Consequently, particles reach and settle at the front of the nose sooner, which results in fewer particles reaching the middle and posterior nasal cavity. In an adult geometry (with a wider airway and larger L), the same increase in airflow velocity (u) similarly boosts anterior impaction. However, the larger cavity allows the core jet to form upward paths along the vault, so the middle regions receive more airflow than in smaller nasal cavities, but the posterior regions get less, as overall nasal deposition increases.
The increased airflow caused pollen deposits in the adult model to shift toward the upper parts of the nasal cavity, along the roof. In the child’s nasal cavity model, the deposit drift was anterior-posterior and more oblique. This is due to the sharper curvature and shorter length in children, which limits the development of a long, stable upper flow path [37]. The stronger anterior-posterior gradient for larger pollen grains observed in both children and adults results from the dominance of inertial impaction at larger aerodynamic diameters. Larger grains separate from the swirling flow lines earlier and are captured more proximally.
Previous experimental and computational (CFD) studies have confirmed differences in particle deposition in the nasal cavity of adults and children [17, 19, 20, 23, 24, 27]. For example, Sawant and Donovan demonstrated significant differences, with greater deposition in the anterior nasal segments of a 12-year-old child [20]. Similarly, Zhou et al. reported that children’s nasal replicas had a higher deposition efficiency than those of adults under the same breathing conditions [19].
In addition to inertial impaction, deposition of large aerosol particles, such as pollen, is influenced by gravitational settling, electrostatic interactions, and direct interception [38, 39]. Gravitational settling is minimal, as pollen remains in nasal airflow too briefly to undergo significant vertical movement. Electrostatic effects are also negligible because the nose’s wet, conductive surface, reproduced in our coated anatomical model, prevents charge buildup. Thus, direct interception remains an important mechanism for large, non-spherical particles, such as pollen agglomerates, in narrow nasal passages. Their large size (100 µm or more) and complex shapes make direct wall contact likely, even if impaction is ineffective. If these particles bypass anterior impaction, they may still reach deeper regions through interception.
Based on the data presented and the results published for an adult [28], it is possible to calculate the net pollen deposition at different inhalation flow rates. Although this is beyond the scope of this paper, future work could investigate this further with other breathing scenarios. It can be assumed that all pollen grains that enter the nose are captured (total deposition dtot = 100%), as their large size prevents them from passing beyond the nasopharynx. With the surface area of each nasal segment: Si (i = WA, WM, WP, SA, or SP), and the fraction fi of the surface covered by deposited particles, the net fraction of inhaled pollen deposited in segment i can be expressed as:
where Stot is the total surface area of the nose available for deposition. The total deposition of inhaled grains in the nose satisfies:
Equation (2) can also be used to calculate the distribution of deposition between the lateral wall (by summing di for i = WA, WM, and WP) and the septum (for i = SA and SP) for different pollen and breathing rates.
The results of this study are clinically significant. Particles that do not pass through the nasal valve and settle on the squamous epithelium of the nasal vestibule, which lacks a mucus coating, are subject to mechanical removal by sneezing and blowing the nose. Allergens released from pollen grains that reach the ciliated mucosa through the mucus layer and deposit on the vascular-rich mucosa can initiate a cascade of allergic reactions, leading to symptoms of allergic rhinitis in individuals who are sensitised to these allergens. Significant deposits of pollen responsible for allergic reactions in the anterior areas of the inferior and middle turbinates, and the middle nasal passage can lead to reduced nasal patency and obstruction of the paranasal sinuses. A higher rate of allergenic pollen deposition in the nasal cavities of children compared to adults may be one of the factors contributing to the fact that the proportion of children with moderate to severe allergic rhinitis is reported to be higher than in adults [26, 40]. Regions with increased pollen deposition should receive special attention during the rhinoscopic and endoscopic examination of a patient with allergy. Understanding the specific sites of pollen grain deposition in the nasal cavity enhances the ability to control allergen exposure, including nasal cleansing (rinsing), implementing pollen barrier protection measures and targeting nasal drug delivery [41]. Recognizing the influence of airflow intensity on pollen deposition reinforces preventive recommendations for children with pollen allergy to avoid outdoor physical activity during periods of high pollen release. These data support further investigation into the relationship between regional pollen grain deposition on the nasal surface and allergic responses, such as those observed during nasal provocation in pollen chambers.
Several limitations should be acknowledged. The 3D model of the nasal cavity does not capture individual variability, nor does it account for the effects of the nasal cycle or nose movements on particle deposition. The model is unilateral, has rigid walls, uses a simplified mucus surrogate, and excludes mucociliary clearance. In young children, sparse and short nasal hairs are likely not a major concern. Only constant flow rates and uniform initial grain velocities are considered, although these parameters fluctuate in reality. Flows are reported per nostril, and bilateral totals depend on instantaneous partitioning between the two nostrils. Hygroscopic particles may increase in size upon inhalation, leading to measurement inaccuracies. Study variables are based on surface coverage percentage and may differ from those used in comparisons that employ weight or load. Furthermore, the impact of exacerbated allergic responses on nasal airway geometry is not addressed. Additionally, under natural conditions, patients with respiratory allergies may encounter aerosols containing both pollen grains and their fragments, each of which can potentially act as allergen carriers [42].
CONCLUSIONS
To the best of our knowledge, this study is the first to experimentally evaluate regional tree pollen deposition in a three-dimensional paediatric nasal model at varying flow rates. Pollen deposition from tree species (birch, hazel, alder, pine, and spruce) varied significantly among segments. The anterior segments of lateral wall and nasal septum consistently showed the highest deposition, the middle segment of lateral wall showed moderate levels, and the posterior segments contributed only slightly. Digital image analysis revealed significant pollen deposits also in the anterior regions of the inferior and middle turbinates, as well as in the middle meatus. These results were consistent for all pollen types and flow rates, with large effect sizes. The observed pattern results from inertial impaction.
The magnitude of the effect increased with both pollen grain size and flow velocity, further limiting penetration into posterior regions. Increased airflow resulted in a diagonal, anterior-superior drift of deposited pollen grains. Compared to adults, the dominance of the anterior parts was more pronounced in children, reflecting anatomical differences and flow dynamics.
These findings have important implications for assessing pollen exposure, developing intranasal interventions, and preventing allergic rhinitis symptoms in children sensitised to tree pollen allergens.