
INTRODUCTION
The immune system is the system that protects living beings against diseases, detects foreign structures such as tumor cells and pathogens and eliminates them. The immune system scans all foreign substances that come into contact with and enter the body. Preventing the development of diseases such as cancer by distinguishing foreign substances is also a feature of the immune system [1].
For the immune system to fulfill its function, immune cells must recognize a foreign agent, amplify it, and regulate their response to foreign agents. This response provides protection through many different mechanisms. Protection includes mechanisms such as phagocytic cells and physical barriers. These mechanisms can be divided into two interrelated defense systems: the specific acquired immune system and the non-specific hereditary (innate) immune system [2].
Immunoglobulins are an important element of the adaptive immune system, which are produced against antigens in plasma cells and have a specific association with antigens [3].
For immunoglobulins to show their functions in the immune response, their levels must be sufficient, and for this, their normal values must first be known [4]. Normal values of serum immunoglobulins may vary depending on age, gender, patient population, place of residence, and the method of determining the values [5].
AIM
The aim in our study is to determine the numerical and percentage reference values of serum normal immunoglobulin values in children who are citizens of the Republic of Türkiye and living in Sakarya.
MATERIAL AND METHODS
STUDY POPULATION
Our study was conducted prospectively by evaluating 200 healthy children who came to the Sakarya University Training and Research Hospital, Child Health and Diseases Polyclinic between 1.01.2022 and 1.05.2022. Children included in the research are children between the ages of 1 month and 18 years, who are citizens of the Republic of Türkiye, without a known history of chronic disease, suspicion of infection, medication use, congenital disease, or anomaly. While evaluating the health status of the children, anamnesis was taken and physical examination was performed by the same physician. There are twenty children each in 10 groups created according to the age groups of the children participating in the study. In each group of twenty, there are 10 boys and 10 girls equally distributed. All children live in the Sakarya province.
LABORATORY ANALYSIS
Venous blood samples taken from the patients included in the study following standard safety precautions were centrifuged at 5,000 rpm for 10 min in the Microbiology Laboratory, the serum portion of the blood was separated and stored at –80°C until the day of the study. On the day of the study, N antiserum human IgG, IgA, and IgM kits (Siemens Healthineers, Germany) were used and the S. BNII (S. Diagnostics, Germany) device was used, per the company’s recommendations. To evaluate the validity of the results before the study, an internal quality and external quality control (RIQAS International Quality Assessment Scheme, United Kingdom) study was carried out using control sera at normal, high, and low levels. Serum immunoglobulin values measured in the study were expressed as mg/dl.
STATISTICAL ANALYSIS
The Kolmogorov-Smirnov test was used to evaluate whether the distribution of continuous variables was normal. According to the normality test results, two independent sample t-tests were used to compare IgG, IgA, and IgM values between genders. One-way ANOVA was used to compare IgG, IgA, and IgM values between age groups. According to one-way ANOVA results, the Tukey HSD test was used for pairwise comparisons between age groups. Since the distribution range of immunoglobulin values is normal, they are presented as arithmetic mean ± standard deviation. A p-value of < 0.05 was considered significant. Analyses were performed using off-the-shelf statistical software (IBM SPSS Statistics, Version 23.0. Armonk, NY: IBM Corp.).
The standards specified in the Clinical and Laboratory Standards Institute (CLSI) C28-A3 guide were used to determine reference ranges. Since the number of people was less than 120, the Robust method was used when determining 95% reference intervals. The Reed method was used to remove outliers. MedCalc Statistical Software was used to calculate reference intervals according to the Robust method (MedCalc® Statistical Software version 20.114, MedCalc Software Ltd., Ostend, Belgium; https://www.medcalc.org; 2022) [6]. Data for the 17–18 age group could not be used as data because they were used in confidence interval calculations (Tables 1–4). The reason why the lower and upper limits are given as zero within the 90% confidence interval by taking the 95% reference interval is that very low values approach negative values when determining the lower and upper limits.
Table 1
Distribution of serum immunoglobulin levels in children between 1 month and 18 years of age according to their gender
Table 2
Distribution of serum immunoglobulin levels according to age groups in children between 1 month and 18 years of age
Table 3
Distribution of serum immunoglobulin levels in children between 1 month and 18 years of age according to age groups and gender
Table 4
Comparative distribution and statistics of serum immunoglobulin levels according to age groups in children between 1 month and 18 years of age
RESULTS
Among 200 children, IgG, IgA, and IgM values were divided into 100 children between the ages of 1 month and 18 years, and the IgG result was found to be significantly higher in boys (p < 0.05). The arithmetic mean was found to be 943.58 mg/dl in boys and 828.38 mg/dl in girls. There was no statistically significant difference in IgA and IgM values (Table 1).
According to age groups: 1–3 months, 4–6 months, 7–12 months, 13–24 months, 25–36 months, 4–5 years, 6–8 years, 9–11 years, 12–16 years, IgG and IgA lower and upper limits were determined according to the arithmetic mean of IgM and minimum and maximum IgM values and 90% confidence interval of the 95% reference interval (Table 2). The results that will be used primarily in clinical use, patient evaluation, and comparison with other studies are included in this table. Considering the reference values of our study, serum IgG values gradually increase until the age of 6–8, then reach a plateau and approach adult levels. While higher values were found for 1–3 months due to maternal IgG transmission, a decrease and a gradual increase were observed afterward. Serum IgA level starts at very low levels in the first months, gradually increase after the age of 2, and reach adult levels at the age of 18 (Table 2).
According to age groups, the arithmetic mean and minimum and maximum IgG values in boys and girls were higher in boys at the age of 4–8 (p < 0.001 and p = 0.017). The arithmetic mean of IgG was found to be 1175 (min.–max.: 849–1400) mg/dl in boys and 813 (min.–max.: 524–1020) mg/dl in girls at the age of 4–5 (p < 0.001). The arithmetic mean of IgG was found to be 1279 (min.–max.: 884–1600) mg/dl in boys and 1046 (min.–max.: 858–1350) mg/dl in girls at the age of 6–8 (p = 0.017). The arithmetic mean of IgA was found to be 104 (min.–max.: 79–135) mg/dl in boys and 84 (min.–max.: 55–106) mg/dl in girls at the age of 4–5 (p = 0.033). There was no significant difference in IgM data (Table 3).
The arithmetic means of IgG, IgA, and IgM values were compared with two studies conducted in different locations in the same age groups and healthy children. These studies are two reference studies conducted at the Konya Selçuk University and the United States of America (USA).
In our study, the arithmetic mean of IgG for ages 4–5 was 994.4 mg/dl; for 6–8 years 1162.75 mg/dl. According to the study conducted in Konya, 839.87 mg/dl for 4–5 years; 1014.93 mg/dl was found to be statistically significantly higher in for 6–8 years; it was found (respectively; p1 = 0.009, p1 = 0.042). In our study, the IgG arithmetic mean was 1162.75 mg/dl for ages 6–8, and 1213.95 mg/dl for ages 12–16. Compared to the study conducted in the USA, it was found to be statistically significantly higher for ages 6–8, 923 mg/dl, and ages 12–16, 946 mg/dl (respectively; p2 = 0.002, p2 < 0.001). In our study, the arithmetic mean of IgA was 94.35 mg/dl for ages 4–5; for 9–11 years 160.45 mg/dl; for 12–16 years 163.6 mg/dl. According to the study conducted in Konya, 68.98 mg/dl for 4–5 years; for 9–11 years 115.99 mg/dl and 12–16 years at 120.90 mg/dl. It was found to be statistically significantly higher for these 3 different age ranges (respectively; p1 = 0.005, p1 = 0.010 and p1 = 0.004).
In our study, the IgA arithmetic mean was 54.2 mg/dl for ages 25–36 months; 59.77 mg/dl for 25–36 months was found to be lower than the study conducted in Konya (p1 = 0.001). In our study, the IgA arithmetic mean was found to be 37.35 mg/dl for 13-24 months, 50 mg/dl lower for 13–24 months than in the study conducted in the USA (p2 = 0.035). In our study, the IgM arithmetic mean was 50.15 mg/dl for 4–6 months; for 7–12 months 57.95 mg/dl; for 13–24 months 85.4 mg/dl; for 25–36 months 100.45 mg/dl. According to the study conducted in Konya, it was 75.44 mg/dl for 4–6 months; for 7–12 months 81.05 mg/dl; for 13–24 months 122.57 mg/dl and 111.31 mg/dl for 25–36 months. There was a significance difference between each one of them (p1 = 0.003, p1 = 0.013, p1 = 0.002 and p1 < 0.001).
In our study, the IgM arithmetic mean was 85.4 mg/dl for ages 13–24 months; for 25–36 months 100.45 mg/dl; for 4–5 years 121.1 mg/dl; for 6–8 years 118.15 mg/dl; for 9–11 years 102.2 mg/dl; for 12–16 years 143.6 mg/dl; for 17–18 years 128.5 mg/dl. According to the study conducted in the USA, it was 58 mg/dl for ages 13–24 months; for 25–36 months 61 mg/dl; for 4–5 years 56 mg/dl; for 6–8 years 65 mg/dl; for 9–11 years 79 mg/dl; for 12–16 years 59 mg/dl; 99 mg/dl was found to be higher for ages 17–18 (p2 = 0.004, p2 < 0.001, p2 < 0.001, p2 < 0.001, p2 = 0.031, p2 < 0.001, p2 = 0.016) (Table 4). All these differences are between countries or regions. It is thought that variables such as genetics, lifestyle, nutrition, infection, geographical location and altitude may make a difference in immunoglobulin levels [7, 8].
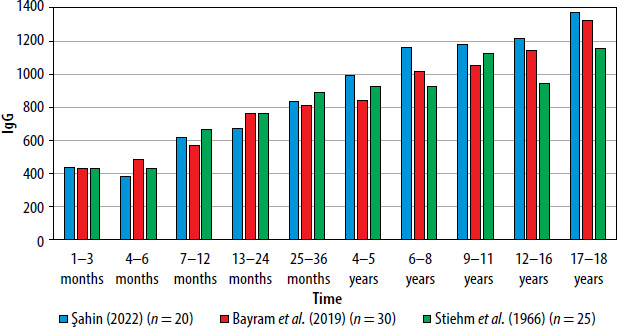
In a study conducted in 3 different centers, IgG values were detected at equal levels in the first months, then gradually increased and remained close to 4–5 years of age, after which our study reached a higher and early adult level (Figure 1).
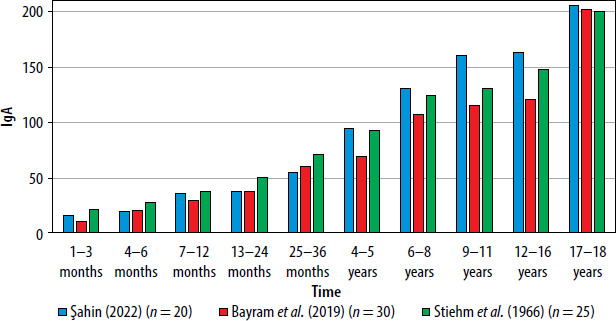
IgA remained at similar levels in the first months, and our study showed higher levels after the age of 4–5, and the results of 3 different centers reached similar/close values in the 17–18 age group (Figure 2).
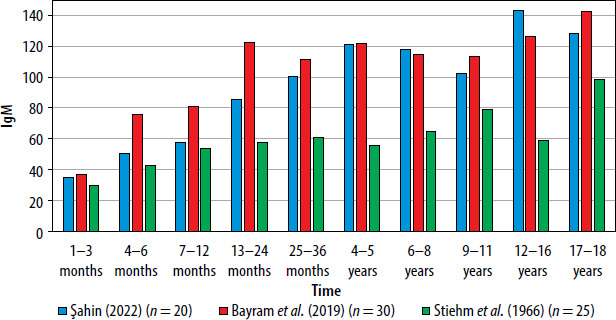
In the study conducted in Konya, IgM values reached higher levels in 4-6 months and then plateaued. In our study, it increased gradually and approached the adult level after 4–5 years of age. In the study conducted in the USA, it remained constant at lower levels. The fact that its level is higher in our country compared to the USA suggests that it may be caused by acute infection, migration, and crowded population (Figure 3).
DISCUSSION
Many different studies have been conducted to determine reference ranges for serum immunoglobulins. As a result of the studies, it was determined that the values may vary depending on the method used for measurement, age, gender, and patient population [5]. Therefore, when selecting the study group, factors that could affect IgG, IgA, and IgM levels were tried to be minimized using the determined criteria.
It is known that medical reference values are close to accurate and reliable to diagnose and monitor a disease and to accurately evaluate laboratory results during the treatment process [9]. In our study, it was aimed to determine reference values specific to our country and partly to our region in IgG, IgA, and IgM levels in healthy children.
The advantage of nephelometric measurements is that they have higher sensitivity at low concentrations. The disadvantages of nephelometric systems are that the potent and optically clear antisera used for antigen detection are expensive, samples containing lipids and hemoglobin change the results, and the sample must be diluted at high antigen concentrations. The method used in our study is also nephelometric, and the results can be said to be more reliable than stated.
It has been thought that the immunoglobulin reference values determined by WHO may be affected by environmental variables in several different studies [10]. Variables were evaluated as age, gender, ethnicity, nutrition, infection, geographical location, and altitude. The effects of ethnicity on immunoglobulin levels have been observed in studies conducted in healthy Caucasian children, the Indian community, and West Africa [11–13]. In some studies, IgG and IgM levels were found to be higher and IgA levels to be lower in girls [14]. There are also studies indicating that gender differences do not have a significant effect on the immunoglobulin level [12]. In our study, factors such as age, gender, and ethnicity were taken into consideration and included as criteria for participation in the study. In this study, according to age groups, the arithmetic mean and minimum and maximum IgG values in boys and girls were higher in boys at the age of 4–8 (p < 0.001 and p = 0.017). At the age of 4–5, the arithmetic mean of IgA in boys was found to be 104 (min.–max.: 79–135) mg/dl, and the arithmetic mean in girls was 84 (min.–max.: 55–106) mg/dl (p = 0.033). No significant difference was found in IgM data (Table 3).
In another study, IgG, IgA, and IgM were studied in 447 healthy children to investigate differences depending on age and gender. The childhood period between the ages of 2 and 16 is divided into 1-year groups. Geometric means and 95% confidence intervals were determined. Significantly higher gender-related values for the IgM class were observed in girls across all age groups examined. IgG approached adult levels after 8 years of age, IgM after 5 years of age, and IgA after 16 years of age. A transiently significant decrease in IgM was observed in males at the age of 11 years. Regression analysis with age was performed separately for boys and girls, and it was observed that the three main immunoglobulin values increased linearly with age [15]. In our study, IgM level was higher in girls in all age groups compared to the 95% reference interval. This suggests that IgM level is higher in girls. In our study, IgG 6–8, IgA 9–11, and IgM approached adult levels after the age of 4–5. Similarly, there was a decrease in IgM levels in the 9–11 age group, which suggests that IgM is low in this age group. It was found that the arithmetic mean of IgG, IgA, and IgM values in boys and girls separately in age groups, IgG values were higher at 4–8 years of age, and IgA was higher in boys at 4–5 years of age.
In a study conducted in our country, serum IgG, IgA and IgM age-related geometric mean, minimum and maximum values, and 95% confidence intervals were studied. IgG levels were found to be high in the neonatal period due to maternal IgG transmission. Afterward, it was observed that it was at a low level for 1–5 months and then all values gradually increased. IgA and IgM levels were found to be very low in the newborn and then started to increase gradually.
IgG levels reach a plateau after the age of 9–10 [4]. In our study, IgG and IgA gradually increased in age groups within the 95% reference range, while IgM remained more stable after 4–5 years of age.
In our country, when we look at the gender-based evaluation of children whose immunoglobulin levels are measured by the Ankara Child Health and Diseases Unit of the University of Health Sciences, the female gender ratio is higher in patients with low IgA levels. It is noteworthy that the frequency of low IgG and IgM levels is higher in the male gender [16]. In our study, IgA and IgM were higher in girls compared to the 95% reference interval.
In a study where IgG, IgA, and IgM serum levels were studied in 270 healthy children between the ages of 4 and 12 by the radial immunodiffusion method, nine different age groups, each consisting of 30 children (15 boys and 15 girls), were created. IgG and IgA concentrations gradually increased with increasing age. The IgM concentration remained constant at a lower level. IgA levels were almost the same in both genders. Significantly higher IgM and IgG levels were found in girls than in boys. A consistent seasonal effect on the three serum immunoglobulin concentrations could not be demonstrated [11]. In our study, IgG and IgA concentrations increased gradually with increasing age, compared to the 95% reference interval. IgM concentration remained constant at a lower level at 4-5 years of age. In girls, IgA and IgM were higher and IgG varied.
In a study conducted in Nigeria of 43 children (20 boys, 23 girls), it was thought that age and gender affected the serum levels of IgG, IgA, and IgM. It was found that girls had significantly lower IgA values than boys (p < 0.05) [17]. In our study, IgA values were found to be higher in girls.
It is thought that the reason why our study and other studies conducted in Turkey found higher levels of IgM compared to the study conducted in the USA is due to more acute infections in our country due to frequent infection, contamination, and migration [8, 18].
Although approximately > 550 genetic diseases that cause primary immune deficiencies (PID) have been identified (inborn errors of immunity), it is thought to be rare because the true frequency of the disease is unknown in the world. While it is assumed that there are 638,000 PID cases in Europe, only 15,052 cases are registered (2.27%). The most common antibody deficiencies in Türkiye (73.5%) are followed by other autoinflammatory diseases (13.3%), identified immune deficiencies (5.5%), phagocyte dysfunctions (3.5%), combined immune deficiencies (2%), and defects in innate immunity (1%), followed by immune system regulation disorders (0.7%). The average age of 94% of the patients is 9.2 ±6 years. The rate of consanguineous marriage is 14.3%. Based on records, the frequency of PID was found to be 30.5/100,000. It would not be a wrong interpretation to assume that this rate will increase considerably if all patients are entered into the patient registration system in Türkiye and clinical immunology centers become widespread [19, 20]. Studies conducted in recent years have shown that hereditary immunodeficiencies are more common, especially in countries with high rates of consanguineous marriages and high fertility rates. Considering that consanguineous marriages in our country are higher than in other countries, the expected immunodeficiency rate is expected to be higher. This should also be taken into consideration in the evaluation of genetic diseases and immunodeficiencies [16]. We hope that the results of this study will be useful in the evaluation of immunodeficiency in our country.
The most common primary immunodeficiency in our country is selective IgA deficiency. When studies on selective IgA deficiency were conducted, no significant differences were found in terms of age, gender, and geographical characteristics. However, when the patients with low IgA in our country were examined in terms of gender, the female gender ratio was seen to be higher. It is noteworthy that the incidence of low IgG and IgM levels is higher for the male gender [16].
Considering the nutritional habits of countries and all these variables, it may be expected that reference ranges will change in different regions. In the results from the same region, it was stated that the family’s lifestyle may affect the results [21, 22].
It is thought that variables such as genetic differences, geography, quality, and type of life between countries may make a difference in immunoglobulin levels [8]. We hope that our study will be a reference for the values of children in this age group and help in the diagnosis and treatment of diseases.