Introduction
Type 1 diabetes mellitus (DM1) is an autoimmune disease leading to insulin deficiency that requires optimal treatment to achieve normal somatic development and to avoid acute and chronic complications of the disease. Patients with DM1 require lifelong insulin administration that should mimic endogenous insulin secretion, known as intensive insulin therapy. According to the most recent guidelines of the International Society for Pediatric and Adolescent Diabetes (ISPAD), intensive insulin therapy regimens include continuous subcutaneous insulin infusion (CSII) or flexible multiple daily injections (MDI) to cover basal requirements and prandial insulin demand [1]. New, advanced technologies of insulin delivery that help to optimize glycemic control are still being developed [2]. Nutritional management is one of the key components of DM1 therapy, which includes appropriate macro- and micronutrients delivery, and maintenance of healthy body weight [3]. Administration of constant insulin doses for meals with constant carbohydrate content may be an option for children with DM1 only among patients in whom introducing intensive insulin therapy is impossible.
Monitoring of diabetes management includes assessment of glycemic control and achieving optimal glycemic targets. In addition to continuous glucose monitoring (CGM) or self-monitoring of blood glucose (SMBG), glycated hemoglobin (HbA1c) has been the basic parameter of glycemic control in patients with DM1 for many years; however, it gives no insight into glycemic variability. CGM has allowed the development of more accurate indices of glycemic control [4, 5]. Even though international recommendations of ISPAD concerning DM1 management are regularly updated, standards of care for children with DM1 may differ between countries.
Another important problem in children with DM1 is an increased risk of autoimmune comorbidities, including celiac disease (CD) and autoimmune thyroiditis (AITD), namely Hashimoto or Graves’ disease. Such conditions may affect carbohydrate metabolism and nutritional status. Vitamin D deficiency not only plays an important role in calcium-phosphate balance and bone mineralization but also has pleiotropic effects, including regulation of metabolism and autoimmune processes. In Poland, the guidelines for vitamin D supplementation are regularly updated in 5-year intervals [6–8] and shared among health care professionals.
Ukraine is one of the countries with increasing incidence of DM1 in children [9]. Treatment of DM1 in Ukraine is not as strictly unified as in Poland, and it is carried out in various endocrinology clinics, not necessarily in the diabetology reference centers. Ukrainian National Healthcare provides insulin preparations, insulin pens, glucose meters, and a limited number of strips for glucose meters for free for the general population of children with DM1. Prior to the Russian invasion of Ukraine, reimbursement policies for CSII varied across different regions of Ukraine, while other diabetes-related products (e.g. glucagon, ketone strips, CGM sensors, and transmitters) were purchased at parents’ expense. In 2022, the Parliament of Ukraine for the first time regulated the issue of reimbursement of medical products in the document “On Introducing Amendments to Certain Legislative Acts of Ukraine on Improving the Provision of Medical Care” (Law of Ukraine 2347-IX); however, this program was to be in force from July 2023. Therefore, at the beginning of 2022, the availability of CSII and CGM systems in Ukraine was lower than in Poland. The Russian invasion in February 2022 forced many Ukrainian (UA) families with children with DM1 to emigrate. Many of them moved to central Poland and found assistance in our pediatric diabetes center. We hypothesized that the clinical characteristics of UA and Polish (PL) children with DM1 might be different and that nutritional status and glycemic/metabolic control in UA patients could change during one year of treatment, carried out in accordance with the Polish guidelines [10].
The aims of the study were: (1) to compare PL and UA school-aged children with DM1 with respect to methods of insulin administration, glucose monitoring and selected auxological indices, (2) to identify variables associated with HbA1c levels, (3) to compare the coexistence of autoimmune comorbidities and vitamin D deficiency, (4) to assess changes in therapy regimen, glycemic control and nutritional status of UA refugees during the first year of DM1 therapy continuation in Poland.
Material and methods
Retrospective, noninterventional study included 35 UA war refugees (19 boys, 16 girls), aged 7–18 years, with DM1, who were admitted to the pediatric diabetology department shortly after arriving in Poland, in order to perform tests that PL children with DM1 routinely undergo every 1–2 years in accordance with Polish standards. The comparative group consisted of 70 out of 450 PL school-aged children with DM1, hospitalized in 2022, after 24 February, with a time window comparable to that of the first UA children hospitalizations. Patients were assessed during routine follow-up visits and matched for age, sex, and DM1 duration using a k-nearest neighbors algorithm. The following parameters were assessed in all children and compared between the national subgroups: methods of insulin administration (MDI or CSII) and of glucose monitoring (SMBG or CGM), height and body mass index (BMI) standard deviation score (SDS), HbA1c, concentrations of vitamin D, thyrotropin (TSH), free thyroxine (FT4), markers of Hashimoto’s thyroiditis (concentrations of anti-thyroid antibodies), and markers of CD, defined as a previous diagnosis or elevated anti-tissue transglutaminase antibodies (anti-tTg-IgA, or anti-tTg-IgG in children with IgA deficiency).
Auxological parameters
Height SDS and BMI SDS were calculated according to the World Health Organization (WHO) Child Growth Standards [11], Polish reference charts [12], and, for UA children, additionally with respect to Ukrainian centile charts [13]. Overweight and obesity were defined as BMI SDS exceeding 1.0 and 2.0 for age and sex (85th and 97th centile, respectively). The incidence of overweight and obesity in PL and UA groups was calculated with respect to both WHO and appropriate national reference charts [11–13].
Laboratory methods
Concentrations of TSH, FT4, antibodies against thyroperoxidase (anti-TPO) and against thyroglobulin (anti-Tg), and vitamin D (25-OH D3) were measured with the Alinity-Abbott analyzer, anti-tTg-IgA and anti-tTg-IgG with the EUROIMMUN analyzer, while HbA1c was measured using a chromatographic method with Bio-Rad analyzer D10 (the method certified by the National Glycohemoglobin Standardization Program). Vitamin D deficiency was defined as 25-OH D3 concentration below 20.0 ng/ml.
Statistical analysis
Distribution of quantitative variables within the PL and UA groups was assessed using the Shapiro-Wilk test. Normal distribution was observed only for height SDS and BMI SDS but not for patients’ age, DM1 duration, HbA1c, or vitamin D concentrations. Thus, for comparisons between PL and UA children, Student’s t-test was used for variables with a normal distribution, while the Mann-Whitney U test was used for the remaining quantitative variables; for qualitative variables (insulin delivery mode, method of glucose monitoring), the χ2-square test was used.
Distribution of HbA1c in the whole study group, as well as in the subgroups divided with respect to sex, insulin delivery, glucose monitoring, presence of Hashimoto’s thyroiditis, and of CD, was also assessed with the Shapiro-Wilk test. Due to deviations from a normal distribution, Spearman correlations were calculated between HbA1c and quantitative variables (age, DM1 duration, height SDS, BMI SDS, vitamin D concentration). The Mann-Whitney U test was used for comparisons between subgroups of patients. A linear regression model of HbA1c concentration was constructed including all qualitative and quantitative variables that were significant in univariate analyses. The forward stepwise method was used to select the final set of predictors.
The final part of the analysis was a comparison of the frequency of using particular methods of insulin administration and glucose monitoring, concentrations of HbA1c, BMI SDS values and the incidence of overweight and obesity in UA refugees at their first hospitalization in Poland and one year later. For comparisons of the same continuous variable (height SDS, BMI SDS, HbA1c) at different time points in the UA group, the Wilcoxon matched pairs test for dependent groups was used. Statistical analysis was performed using Statistica 13.0.
Ethical issues
According to the statement of the Bioethics Committee at the Medical University of Lodz, Poland, noninterventional studies and retrospective studies of medical records do not constitute a medical experiment and thus do not require the opinion of the bioethics committee and informed consent of participants (available at: https://bioetyczna.umed.pl; Procedura składania wniosku; accessed 31 Dec 2025, in Polish). The data of children have been anonymized. The study was conducted in compliance with international ethical standards included in the Declaration of Helsinki.
Results
Initially, we compared 35 UA refugees with DM1 established in Ukraine with all 450 PL children hospitalized in 2022 after the Russian invasion of Ukraine. Among UA children, there were 54.3% boys and 45.7% girls, while among PL children there were 48.4% and 51.6%, respectively. PL children were slightly younger than UA children (12.5 ±4.2 vs. 12.7 ±3.9 years), and DM1 duration was shorter in PL than UA patients (4.4 ±3.7 vs. 4.9 ±3.8 years). Using the k-nearest neighbors algorithm enabled selection of a cohort of 70 PL patients (twice as large as UA cohort) and optimally matched with respect to the proportions of boys and girls, age, and DM1 duration. Characteristics of PL and UA groups are presented in Table I.
Table I
Descriptive statistics of the whole studied group and subgroups of Polish (PL) and Ukrainian (UA) patients
| Group | All | PL | UA | p-value |
|---|---|---|---|---|
| Number of patients [n (%)] | ||||
| Total | 105 | 70 | 35 | 0.89 |
| Boys | 58 (55.2) | 39 (55.7) | 19 (54.3) | |
| Girls | 47 (44.8) | 31 (44.3) | 16 (45.7) | |
| Age [years] | 12.9 ±3.2 | 12.9 ±3.4 | 12.7 ±2.9 | 0.78 |
| DM1 duration [years] | 4.8 ±3.9 | 4.7 ±3.9 | 4.9 ±3.8 | 0.79 |
| Insulin therapy [n (%)] | ||||
| CSII | 65 (61.9) | 59 (84.3) | 6 (17.1) | < 0.001 |
| MDI | 40 (38.1) | 11 (15.7) | 29 (82.9) | |
| CGM use [n (%)] | ||||
| Yes | 77 (73.3) | 56 (80.0) | 21 (60.0) | 0.03 |
| No | 28 (26.7) | 14 (20.0) | 14 (40.0) | |
| Height SDS [12] | –0.03 ±1.16 | 0.17 ±1.12 | –0.43 ±1.15 | 0.01 |
| BMI SDS [12] | 0.21 ±0.94 | 0.30 ±0.83 | 0.10 ±1.13 | 0.14 |
| HbA1c [%] | 7.7 ±1.9 | 7.4 ±1.6 | 8.3 ±2.2 | 0.02 |
| Vitamin D (25-OH D3) [ng/ml] | 25.9 ±11.1 | 28.5 ±11.8 | 20.8 ±7.3 | < 0.001 |
[i] All values, except for number of patients (with respect to sex, CGM use, and method of insulin delivery) are presented as mean ± standarddeviation; p-value refers to the differences between UA and PL groups in the χ2 test for numbers of patients and in appropriate tests for independent groups for the remaining variables.
BMI – body mass index; CGM – continuous glucose monitoring; CSII – continuous subcutaneous insulin infusion; DM1 – type 1 diabetes mellitus;
HbA1c – glycated hemoglobin; MDI – multiple daily injections; SDS – standard deviation score
Treatment mode and glycemic control
Personal insulin pumps were significantly more frequently used by PL children than by UA children upon arrival in Poland (84.3% vs. 17.1%, p < 0.001); CGM sensor usage was also more frequent in PL than in UA patients (80.0% vs. 60.0%, p = 0.03); see Table I.
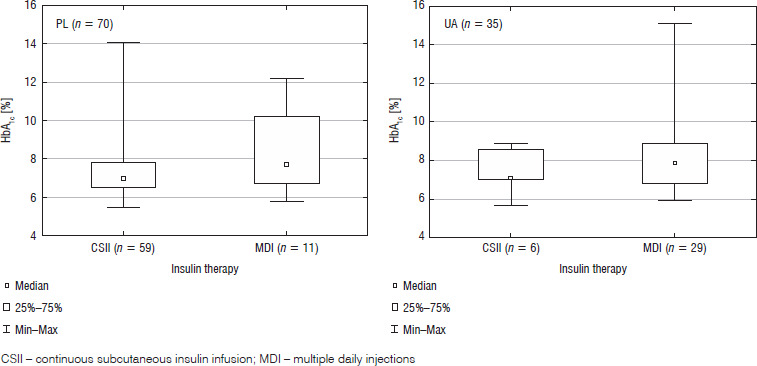
There was a significant difference between HbA1c levels in PL and UA children (7.4 ±1.6% vs. 8.3 ±2.2%, p = 0.02). We also observed a significant difference in HbA1c with respect to model of therapy in the whole studied group (CSII: 7.3 ±1.4% vs. MDI: 8.4 ±2.2%, p = 0.003). However, the differences in HbA1c within national subgroups were nonsignificant both for UA children (7.4 ±1.2% in pumps users vs. 8.5 ±2.3% in pen users, p = 0.38) and for PL children (7.3 ±1.5% vs. 8.2 ±2.0%, respectively, p = 0.19), possibly due to the relatively small number of patients on MDI in PL and on CSII in the UA subgroup; see Figure 1.
Figure 1
Concentrations of glycated hemoglobin (HbA1c) in Polish (PL) and Ukrainian (UA) children with respect to the method of insulin therapy
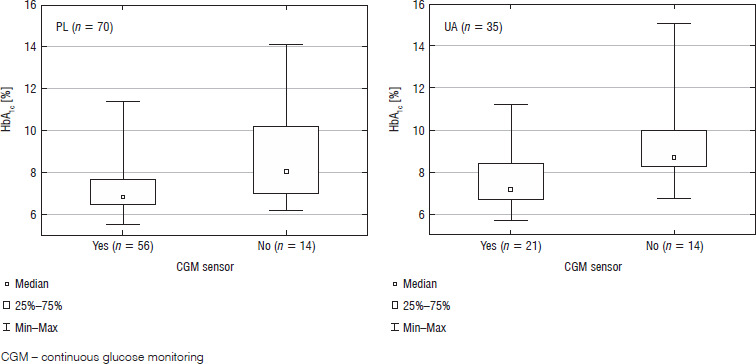
In the whole group, there was also a significant difference in HbA1c between users of CGM and SMBG only (7.2 ±1.2% vs. 9.2 ±2.5%, p < 0.001). This difference was also significant in both the UA group (7.5 ±1.3% in CGM group vs. 9.7 ±2.8% in SMBG group, p = 0.004) and the PL group (7.1 ±1.1% vs. 8.8 ±2.2%, respectively, p = 0.004); see Figure 2.
Figure 2
Concentrations of glycated hemoglobin (HbA1c) in Polish (PL) and Ukrainian (UA) children with respect to the method of glucose monitoring
Patients’ height SDS was significantly lower in the UA group than the PL group (–0.43 ±1.15 vs. –0.17 ±1.12, p = 0.01), with no significant difference in BMI SDS, calculated according to Polish standards [14] (0.01 ±1.13 vs. 0.30 ±0.83, respectively, p = 0.14). In UA children treated with MDI, BMI SDS was insignificantly lower than in those treated with CSII (–0.07 ±1.08 vs. 0.43 ±1.34, respectively, p = 0.33), while in PL it was similar (0.31 ±0.76 vs. 0.28 ±1.16, respectively, p = 0.91). Among MDI users in the UA group, 4 children had constant doses of insulin. Despite the small number of cases, this group had significantly lower BMI SDS than UA patients on intensive insulin therapy – all CSII and the remaining MDI users (–0.71 ±1.35 vs. 0.23 ±0.96, respectively, p = 0.038). There was no significant difference in HbA1c between these groups (9.0 ±2.2% in patients on constant insulin doses vs. 8.1 ±2.4% in those on intensive insulin therapy, p = 0.32).
Assessment of nutritional status
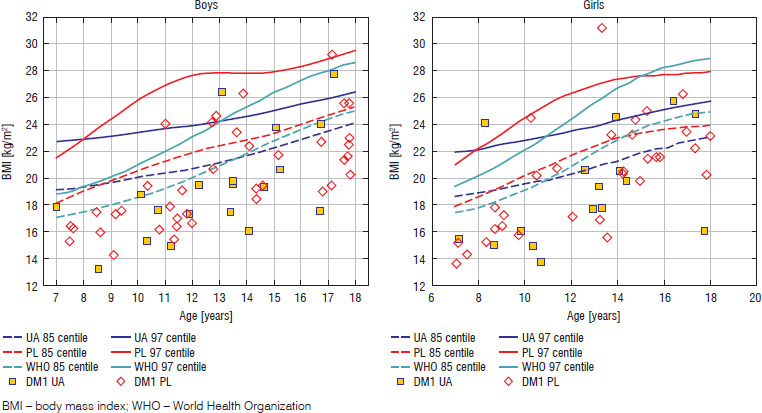
The incidence of overweight and obesity in the studied group was different depending on the used centile charts: WHO, Polish, or Ukrainian [11–13]; see Figure 3.
Figure 3
Incidence of overweight and obesity among Polish (PL) and Ukrainian (UA) children with respect to different centile charts of body mass index
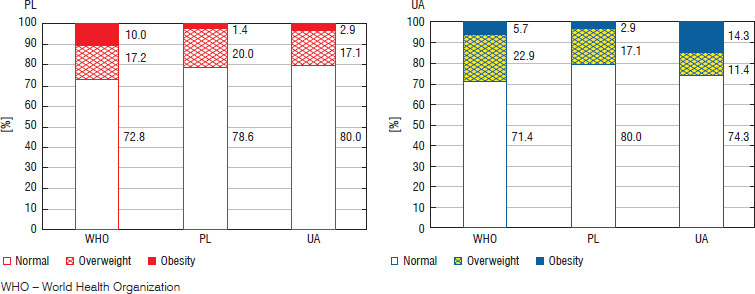
According to WHO charts, 7 PL (10.0%) and 2 UA (5.7%) children presented with obesity, while 11 PL (17.2%) and 8 UA (22.9%) were overweight; the overall incidence of overnutrition (overweight and obesity) was similar in PL and UA children (27.2% vs. 28.6%). With respect to the appropriate national charts for each group, overnutrition among PL children was observed in 15 cases (21.4%), while among UA children in 9 cases (25.7%). Some patients had differently assessed nutritional status depending on the reference centile chart used; see Figure 4.
Vitamin D deficiency and autoimmune comorbidities
Vitamin D concentrations were significantly lower in UA than in PL children (20.8 ±7.3 vs. 28.5 ±11.8 ng/ml, p < 0.001) with no difference with respect to method of the insulin administration within national groups, but with a significant difference in UA children with respect to using CGM sensors or not (22.9 ±6.1 vs. 17.1 ±8.0 ng/ml, p = 0.048). The incidence of vitamin D deficiency was higher in UA than in PL, although insignificantly (42.9% vs. 17.1%, p = 0.09). AITD was diagnosed at the same frequency (22.9%) among PL children (16 cases) and UA children (8 cases). During the study, all patients were in euthyroid state; however, 2 of UA and 8 of PL patients diagnosed with AITD required L-thyroxine substitution. In our study, CD was diagnosed in 7.1% of PL patients (5 cases) but in none of the UA children.
Effects of other variables on HbA1c – univariate analysis and regression model
Weak correlations were observed between HbA1c and patient’s age (r = 0.24, p < 0.05), DM1 duration (r = 0.20, p < 0.05), and vitamin D concentration (r = –0.24, p < 0.05), while there was no correlation between HbA1c and any of the auxological indices (height SDS, BMI SDS).
Significant differences in HbA1c levels were observed between the subgroups of patients, divided according to nationality, sex, insulin delivery mode, and method of glucose monitoring, while there was no difference with respect to presence of AITD or CD (see Table II).
Table II
Glycated hemoglobin (HbA1c) levels in subgroups of patients divided according to different parameters
[i] All values are presented as median (interquartile range) of HbA1c [%]; p-value refers to the differences between the groups in the Mann-Whitney U test.
CSII – continuous subcutaneous insulin infusion; CGM – continuous glucose monitoring; MDI – multiple daily injections; PL – Polish;
SMBG – self-monitoring of blood glucose; UA – Ukrainian.
Finally, all variables significant in univariate analysis, both quantitative (patient’s age, DM1 duration, vitamin D concentration) and qualitative (nationality, insulin delivery mode, glucose monitoring method) were used for constructing a multivariate regression model of HbA1c [%]. In this model, only two variables were significant, i.e. insulin delivery mode and method of glucose monitoring, with an independent, beneficial effect of using both technologies on HbA1c level (see Table III).
Follow-up of UA children
After one year, 22 UA patients (13 boys, 9 girls) continued therapy in our center, while the remaining patients returned to Ukraine or decided to migrate further. Some patients decided to change the mode of insulin delivery (from MDI to CSII) and glucose monitoring (from SMBG only to CGM); consequently, the frequency of using insulin pumps in this group increased from 18.2 to 40.9%, while that of using CGM increased from 72.7 to 86.4%. The frequency of using insulin pumps remained lower among UA patients than among PL ones. There was no difference in mean HbA1c before and after a year of treatment in Poland; nevertheless, both height SDS and BMI SDS in the UA group increased and reached values similar to those observed in PL children with DM1. Irrespectively of the therapy mode and CGM use, in some patients HbA1c levels decreased, while in others they increased. At the first hospitalization in Poland, 4 out of these 22 children (3 boy and 1 girl) were overweight, while none of them was obese. One year later, 5 boys were overweight, and none of the children had developed obesity. Detailed data at two analyzed time points – at first admission to hospital in Poland and after one year – are presented in Table IV.
Table IV
Descriptive statistics of Ukrainian patients who continued therapy in our center for 1 year
| Timepoint | 1st admission in Poland | After 1 year | p-value |
|---|---|---|---|
| Number of patients (boys/girls) | 22 (13/9) | ||
| Age [years] | 13.0 ±2.5 | 14.0 ±2.4 | N/A |
| DM1 duration [years] | 5.4 ±4.1 | 6.4 ±4.1 | N/A |
| Insulin therapy (CSII/MDI) | 4/18 | 9/13 | 0.063 |
| CGM use (yes/no) | 16/6 | 19/3 | 0.250 |
| Height SDS [12] | –0.18 ±0.89 | –0.04 ±0.93 | 0.016 |
| BMI SDS [12] | 0.16 ±0.99 | 0.40 ±0.84 | 0.046 |
| HbA1c [%] | 7.9 ±1.4 | 7.9 ±1.4 | 0.910 |
[i] All values, except for number of patients (with respect to sex, CGM use, and method of insulin delivery) are presented as mean ± standard deviation;
p-value refers to the differences between Ukrainian and Polish groups in the exact binomial test for numbers of patients and in appropriate tests for dependent samples for the remaining variables.
CGM – continuous glucose monitoring; CSII – continuous subcutaneous insulin infusion; DM1 – type 1 diabetes mellitus; HbA1c – glycated hemoglobin;
MDI – multiple daily injections; N/A – not applicable; SDS – standard deviation score
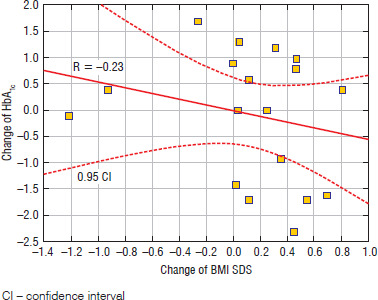
In one boy with undernutrition upon arrival in Poland, an increase of BMI SDS by 3.24 was observed, together with an increase of HbA1c from 7.8 to 11.8%. Nevertheless, among the remaining UA patients, there was a negative relationship between the change of BMI SDS and of HbA1c level during one year of stay in Poland (there was a correlation but weak and insignificant: r = –0.23, p = 0.36) (see Figure 5).
Discussion
War migration of patients, especially children, with chronic diseases creates many medical and logistic problems. The main issues concerning patients with diabetes have been described in a recent paper by Boulton et al. [15]. Upon arrival in Poland, most UA children with DM1 had insulin supplies and the necessary equipment for administering it, as well as for measuring glucose levels. However, all of them had a difficult journey and had recently been functioning under severe stress. Some UA children did not undergo functional intensive insulin therapy and received constant doses of insulin with constant meals. All these factors could have contributed to poorer glycemic control (as reflected by higher HbA1c levels) in UA children than in PL ones. The war in Ukraine has undoubtedly reduced access to modern diabetes treatment compared to other countries. This situation poses a particular challenge to health care systems in countries receiving refugees from Ukraine. Specific health needs of UA children have been described by Ludvigsson and Loboda [16]. The need for coordinated efforts for dealing with UA refugee children has been highlighted by the European Society for Emergency Paediatrics and the European Academy of Paediatrics, who published their recommendations concerning this issue in 2022 [17]. Other issues related to access to health technology and medical devices in Eastern Europe have been discussed by international panels of experts, including representatives of the Ukrainian Ministry of Health [18, 19].
In our study, CSII users had lower HbA1c levels than pen users, although this difference lost significance in separate national subgroups. Due to the small size of the subgroups, the statistical power of these results is limited, as the risk of type II error (i.e. failure to detect a real difference) should be taken into account. In turn, significantly lower HbA1c levels were observed in CGM users than in patients not using sensors, both in the whole group and in national subgroups.
Insulin delivery with CSII and using CGM were also the only significant variables in the regression model in which HbA1c was a dependent variable, while other input variables (nationality, patient’s age, DM1 duration, vitamin D concentration) were insignificant. Weak correlations between HbA1c and: patients’ age, DM1 duration, and vitamin D concentration observed in univariate analysis are of limited clinical importance. There are many other potentially important confounders, such as socioeconomic status, parental education, or prior access to diabetes education that could bias these associations. One such factor was undoubtedly the psychological stress associated with migration in UA patients. It would also be interesting to stratify UA patients according to their place of residence in Ukraine; however, in our study such groups were small, especially as for some patients we were not able to clearly identify their address. This issue could be better addressed in a multicenter study.
In a recent report by Czech authors [20] concerning UA children with DM1, most refugees were not using CSII at the time of migration, and approximately half were using CGM. The authors reported a decrease of HbA1c levels in patients who received CGM in Czechia, supporting the beneficial role of sensor-based monitoring in glycemic control. These findings are in line with our observations. Both the cited study [20] and our data concerning UA refugees with DM1 highlight the problem of limited availability of new technologies used in diabetes treatment and glucose monitoring in Ukraine.
In UA patients who migrated to Poland, mean HbA1c remained stable after one year, but most of them were using CGM systems at the beginning of our observational study, as their diabetologists in our outpatient clinic or even their primary care physicians in Poland had implemented CGM systems for them before hospitalization. It was possible because UA refugees obtained the same rights to medical care as Polish citizens, including reimbursement of CGM systems and other equipment necessary for modern DM1 therapy. Some patients were already using FreeStyle Libre at the time of arrival (they started using it in UA). However, for most of them, access to sensor glucose measurement was possible only with programs or smartphone apps not certified by the product manufacturer.
Moreover, the implementation of the same principles of therapy as in Polish children was challenging due to the established habits of patients and their families, as well as the perception that their stay in Poland was temporary. Many parents were afraid that after returning to their home country they would not be able to use insulin pumps due to the limited availability of equipment and worse access to the medical staff trained in such therapy. However, most of the patients who stayed in Poland for about one year decided to use CGM sensors. Unfortunately, metabolic control of the disease remained poorer in UA children than in matched PL ones.
An additional problem was the language barrier, which could be overcome thanks to the help of medical staff and even medical students who knew Ukrainian or Russian and, to a lesser extent, the use of translators. Thanks to the help of volunteers, educational materials were translated and thus became available for UA patients with DM1 and their families in their native language. The patients and their parents also had some psychological and psychosocial problems that required attention at the beginning of their stay in Poland. This may represent an additional source of stress for children who lost their peer relationship and had to adapt to a new environment and language. Increased incidence of depression, anxiety, and even acute stress disorder among Ukrainian war refugees has been documented in other studies [21, 22].
The data concerning growth and nutritional status of UA children with DM1 compared to matched PL children with the same disease are noteworthy. Patients from Ukraine had significantly lower height SDS and insignificantly lower BMI SDS than PL patients. During the first year of stay in Poland, children from Ukraine as a group showed improvement in nutritional status and probably their growth rate; although no data on their previous height velocities are available, a significant increase of their mean height SDS was observed during the study period.
Improvement of nutritional status and of height SDS of UA patients was not associated with better metabolic control of DM1. This might be related to changes of dietary habits, especially increased caloric intake, catch-up growth, and pubertal development. Unfortunately, the availability of data from the treatment period in Ukraine was limited, and such data had not been collected prospectively in all the patients, so it was impossible to include them in a retrospective analysis.
According to the report of Dereń et al. [23], overweight and obesity have been less frequent in Ukraine than in most European countries. Auzanneau et al. [24] reported that among migrants with DM1, children from Ukraine had lower adjusted BMI SDS than those from Syria or Afghanistan. Nevertheless, in our study, the real incidence of overweight and obesity in children with DM1 exceeded theoretical values according to the definitions based on the age- and sex-related distributions of BMI in children. The selection of appropriate reference ranges for assessing the nutritional status of UA children turned out to be a significant problem due to discrepancies between the available national and WHO centile charts [11–13]. This was particularly important in the case of UA patients who were obese or overweight only according to the UA centile charts, as both children and their parents were convinced of the need for dietary restrictions due to overnutrition. In some cases, this led to worse adherence to treatment and even to the lack of acceptance of intensive insulin therapy with the possibility of modifying meals. The issue of discrepancies between different centile charts has been reported in previous studies, including those describing the initial growth references for UA children [12, 13].
In general, WHO charts have been recommended for international use, as these standards were developed and updated based on data collected in the WHO Multicentre Growth Reference Study. The advantage of these standards follows from the fact that they were developed using the data of healthy children living under conditions likely to favor achievement of their full genetic growth potential, whose mothers followed health-promoting recommendations, such as breastfeeding and non-smoking.
In 2022, Burlaka and Mityuryayeva [25] from Kyiv reported the mean concentration of vitamin D in children with DM1 at the level of 32.0 ±0.8 ng/ml, which was higher than that observed in UA patients in the present study. This difference may be related to the fact that UA refugees in our study came from different regions of the country, where medical care may vary. The authors Biliaieva and Vlasenko [26] from Vinnytsia reported a high incidence of vitamin D deficiency or insufficiency among adolescents with DM1. Nevertheless, the impact of a war situation, when vitamin supplementation may not be a priority, should not be neglected.
We observed similar incidence of AITD in UA and PL groups, while CD was diagnosed only in PL patients but in no UA patients. However, due to the small number of patients, it is not appropriate to draw definitive conclusions from these observations.
The limitations of the study include the small size of the total UA group and the inability to assess full data concerning the diagnosis and previous treatment of UA patients, as well as more reliable indicators of metabolic control of diabetes (time in range, glycemic variability) available only for CGM users. Another limitation is that follow-up data were available for only 22 of the 35 UA patients included in the primary study group. In these 22 children, HbA1c at arrival was 7.9% (and for them the mean HbA1c remained stable after one year), while for the total 35 the average HbA1c at arrival was 8.3%. This may suggest that children who subsequently migrated to other countries had higher baseline HbA1c values. Consequently, attrition of this subgroup may have limited our ability to detect an improvement in mean HbA1c in UA children. As mentioned, the statistical power of insignificant results in small groups of patients is limited. Small number of patients is also a reason for limited power of results showing no significant differences in HbA1c between CSII and MDI users within national groups. Therefore, these findings do not contradict established associations between therapy mode and metabolic control of disease. Finally, due to the retrospective, non-interventional design of the study, the possibility of causal interpretation of the results is limited.
Conclusions
The use of more advanced methods of insulin administration (CSII) and especially of CGM sensors is associated with better DM1 control and better auxological development.
Assessment of UA refugees at arrival in Poland and during continuation of DM1 therapy in Poland provided an opportunity to compare this group with PL children with DM1 in a case-control study, as well as to observe changes in glycemic control and in nutritional status after migration to Poland and adjustment of DM1 management to Polish standards. The migration of children creates problems in the proper assessment of their auxological development. Discrepancies in the incidence of overweight and obesity with respect to the used reference charts can complicate correct assessment of the nutritional status of patients in the case of cross-border migration.