

Introduction
Systemic lupus erythematosus (SLE) is a chronic autoimmune inflammatory disease that can affect the majority of organs and tissues [1]. Lupus nephritis (LN) occurs in 20-40% of SLE patients [2, 3]. LN is a severe consequence of SLE and an important driver of morbidity and mortality in SLE [4, 5]. The pathogenesis of LN is highly complex. Genetic variants and environmental risk factors (such as ultraviolet light, infections, hormones, and toxins) increase the apoptotic cell load. Defective clearance of nucleic acids released from apoptotic cell debris or netting results in high levels of nucleic acids in extracellular compartments. These nucleic acids are exposed to the immune system and activate innate and adaptive immunity via viral nucleic acid- specific Toll-like receptors. Dendritic cells, T helper cells, B cells, and plasma cells all contribute to the aberrant polyclonal autoimmunity and sustained autoantibody production. The intrarenal etiology of lupus nephritis involves antibody binding to multiple intrarenal autoantigens and the deposition of circulating immune complexes. Tertiary lymphoid tissue formation and local antibody production add to intrarenal complement activation as renal immunopathology progresses. Genetic predispositions, proinflammatory and anti-inflammatory cytokines, autoantibodies, lymphocyte subset abnormalities as well as defects in the complement systems all have putative roles in the development of LN. Among these factors, the contribution of lymphocyte subset aberrations, especially the T-helper subsets, in the pathogenesis of renal disease in LN cannot be over-emphasized. In this context, important T helper subsets include Th1, Th2, Th9, Th17, Treg, DN T cells, and follicular T-helper cells [6-9].
CD4+CD25+Foxp3+ regulatory T cells (Tregs) can suppress a variety of immune cells including B cells, CD4+, CD8+ T cells, monocytes, and dendritic cells (DCs), as well as NK cells, NKT, and DN T cells, and thus have a pivotal role in the maintenance of immune tolerance [10]. Quantitative and/or qualitative deficiencies in Tregs have been suggested to contribute to the development of SLE [11]. In human LN patients, substantial shrinkage of Treg cells was observed in the peripheral blood, and there is an inverse correlation between the number of Tregs and clinical disease activity [12-14]. In murine LN, depletion of Tregs in NZB/W F1 accelerated the onset of diffuse proliferative LN, whereas their transfer into CD4/CD25 knock-out mice retarded the development of nephritis [15]. In parallel with defects in Tregs in SLE, adoptive transfer of Tregs delays disease progression and reduces mortality in lupus-prone mice [16].
T cell immunoglobulin and mucin containing protein-3 (TIM-3), an important immune checkpoint protein, first discovered in 2002, is a member of the TIM family of immunoregulatory proteins. TIM-3 has been proved to be expressed in various immune cells (CD4+, CD8+, Tregs, Th17 cells, natural killer cells, and mast cells) and tissue cells (renal tubules and interstitial, liver, brain tissue) and influences their function [17, 18]. Evidence has shown that the levels of expression of TIM-3 in peripheral blood CD4+ T cells [19], CD8+ T cells [20], monocytes [21] and NK cells [20, 22], serum [23, 24], and kidney tissue [25] in patients with SLE were significantly higher than those of healthy controls. The up-regulation of TIM-3 expression in patients with SLE was associated with disease activity in SLE patients. These results suggest that TIM-3 might play an important role in the pathogenesis of SLE and LN and serve as a potential biomarker for the disease activity of SLE [26].
Rapamycin is an antifungal antibiotic isolated from soil samples from Easter Island in the Pacific Ocean by Canadian scholars in 1975 [27, 28]. It is a macrocyclic lactone antibiotic. It is the allosteric inhibitor of the mechanistic target of rapamycin (mTOR) and can form an FRB domain with the FKBP12 protein to inhibit the activity of mTOR [29, 30]. The beneficial effect of rapamycin on LN has been confirmed in both mouse models and patients [31-33]. However, the specific mechanisms underlying rapamycin’s alleviation of LN injury and the effect of rapamycin on Treg cells and TIM-3 are not yet completely understood. In the present study, we aimed to determine whether rapamycin could protect against LN injury by restoring the disrupted Treg cells and TIM-3 pathway.
Material and methods
Animals
Female MRL/lpr mice, aged 12 weeks, were obtained from the Laboratory Animal Center of Shanxi Provincial People’s Hospital. All mice were reared under specific pathogen-free conditions (22-26°C, 40-70% humidity, and 12-h light/dark cycles) with sufficient food and water. The experiments were performed based on protocols from the Fifth Clinical Medical College of Shanxi Medical University Institutional Animal Care and Use Committee.
Treatment protocols
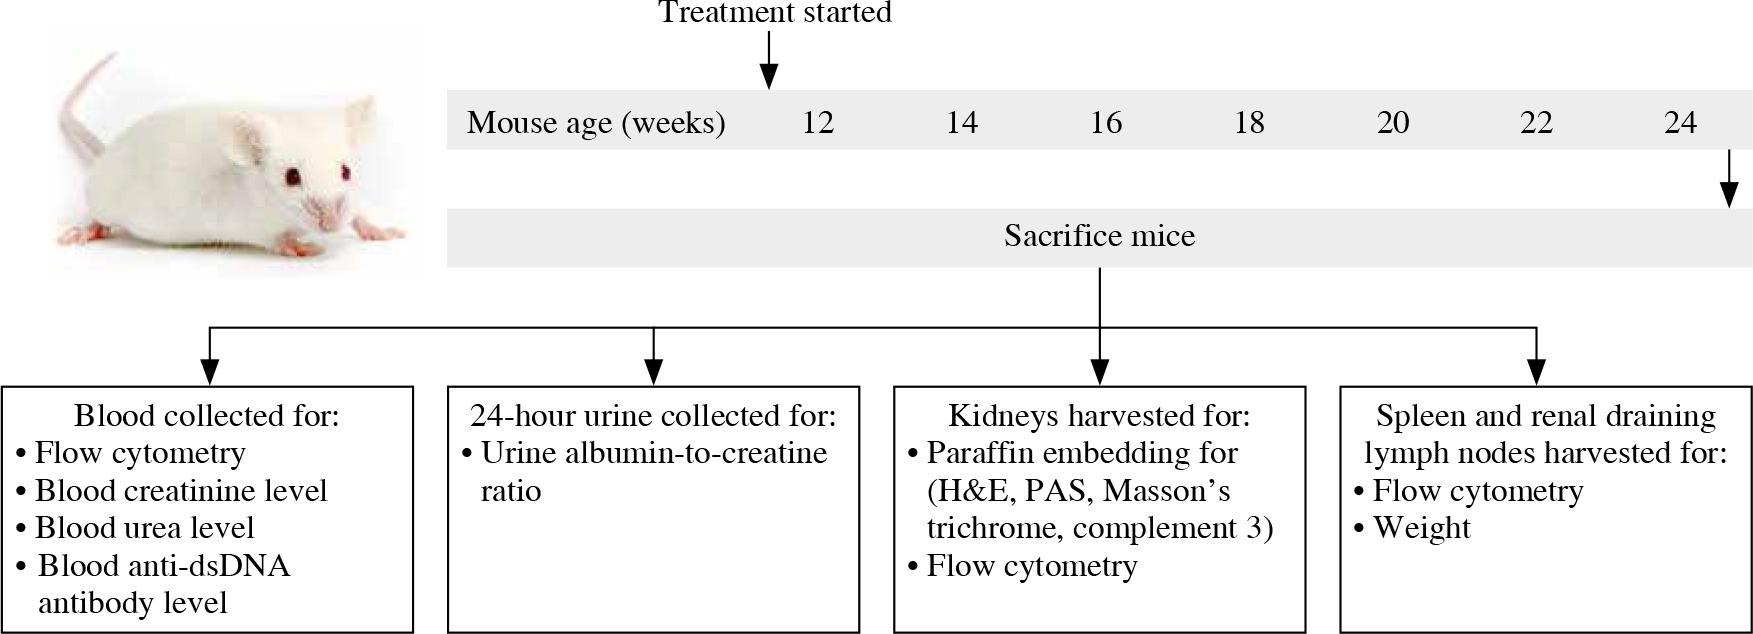
12-week-old MRL/lpr mice were randomly divided into two groups. In one group of MRL/lpr mice (n = 6), individuals were intraperitoneally injected with 1 mg/kg rapamycin (Beijing Solarbio Science & Technology Co., Ltd., China) every other day for 12 weeks. Another group (n = 6) of control MRL/lpr mice received an equal volume of phosphate-buffered saline (PBS) using the same schedule. At the age of 24 weeks, the mice were anesthetized by an intraperitoneal injection of 2% pentobarbital sodium at a dose of 45 mg/kg body weight. Peripheral blood was collected into a heparinized blood collection tube via heart puncture. Following saline lavage, the spleen, renal draining lymph nodes, and kidneys were obtained for further experiments (Fig. 1).
Fig. 1
Schematic diagram showing treatment, sample collection, and studies conducted in MRL/lpr mice. 12-week-old female MRL/lpr mice were randomized to receive phosphate-buffered saline (PBS) or rapamycin for up to 12 weeks. Mice were killed and peripheral blood, urine, kidneys, spleens, and renal draining lymph nodes were collected for assessment of clinical, serological, histological, and immunological parameters of disease, with particular focus on Treg cells and TIM-3 expression
Cell isolation
Peripheral blood was drawn into heparin-coated tubes. Peripheral blood mononuclear cells (PBMCs) were isolated using a mouse PBMC separation fluid kit (Tianjin Haoyang biological products Technology Co., Ltd, China). Mouse spleens, renal draining lymph nodes, and kidneys were removed with scissors and ground to a single-cell suspension, followed by passing through a 70 mm cell strainer [34]. Erythrocytes in spleen and kidney cell suspensions were lysed with red blood cell lysis buffer. Cells were then washed, counted, and resuspended in PBS for culture or FACS analysis.
Flow cytometry
For phenotypic analysis, single-cell suspensions were stained with specific antibodies against CD4 (GK1.5), CD25 (PC61), TIM-3 (5D12), and CTLA-4 (UC10-4F10-11) for 30 min at 4°C in the dark. Then cells were fixed and permeabilized using a Transcription Factor Buffer Set (BD Biosciences, San Diego, CA) and stained with specific antibodies against Foxp3 (FJK-16s) according to the manufacturer’s instructions. To determine cytokine interleukin 10 (IL-10) and transforming growth factor β1 (TGF-β1) expression, isolated cells were stimulated with PMA, ionomycin, and Brefeldin A (BioLegend, San Diego, CA) at 37°C for 6 hours. Then cells were washed and labeled with CD4 (GK1.5) and CD25 (PC61) for 30 min at 4°C in the dark. Intracellular staining for Foxp3 (FJK-16s), IL-10 (JES5-16E3), and TGF-β1 (TW7-16B4) was performed using a Transcription Factor Buffer Set. All antibodies were purchased from BD Biosciences, eBioscience, and BioLegend. After staining, cells were washed twice and resuspended in PBS. specimens were detected by the BD FACS Canto II system (BD Biosciences, USA) and data were analyzed with FlowJo 10.5 software (TreeStar, San Carlos, CA).
Renal function detection
24-hour urine was collected every other week using the metabolic cage. Throughout the collection, the mice fasted without water deprivation. Urinary albumin was determined using an Albumin Assay Kit. Blood samples anticoagulated with heparin were centrifuged to obtain plasma. Urea nitrogen (BUN) was quantified with a Urea Assay Kit. The concentrations of creatinine in urine and blood were measured using the Creatinine Assay kit (sarcosine oxidase). The protocols for all the kits were followed according to the manufacturer’s instructions. All these detection kits were purchased from Nanjing Jiancheng Bioengineering Institute, Nanjing, China.
Enzyme-linked immunosorbent assay
Blood samples anticoagulated with heparin were centrifuged to obtain plasma. The concentration of anti-double-stranded DNA (dsDNA) antibody in plasma was detected using an anti-dsDNA antibody (IgG) ELISA kit (Shanghai enzyme-linked Biotechnology Co., Ltd, Shanghai, China). The protocols for the kits were followed according to the manufacturer’s instructions.
Kidney pathology
Kidneys were fixed in 10% neutral buffered formalin for 24 hours, then embedded in paraffin, and cut into 4 µm sections. Sections were stained with hematoxylin and eosin (H&E) reagent. The slides were scanned using the digital slide scanner Pannoramic DESK (3DHISTECH, Hungary). Kidney pathology was evaluated as previously described [35, 36]. Glomerular pathology was assessed by examining at least 20 glomerular cross-sections (gcs) per kidney. Each glomerulus was determined semiquantitatively by scoring the number of cells accordingly: 0 – normal (35-40 cells/gcs), 1 – mild (41-50 cells/gcs), 2 – moderate (50-60 cells/gcs), 3 – severe (> 60 cells/gcs, and/or glomeruli with segmental/global sclerosis, crescent formation). Interstitial/tubular pathology was assessed semi-quantitatively on a scale of 0-3 in at least 20 randomly selected high-power fields (200×). We determined the largest and average number of infiltrates and damaged tubules and subsequently adjusted the grading system accordingly: 0 – normal, 1 – mild, 2 – moderate, 3 – severe. Perivascular cellular accumulation was determined semiquantitatively by scoring the number of cell layers surrounding the majority of vessel walls (0 – none, 1 – 1-5, 2 – 5-10, 3 – ≥ 10 cell layers). The kidney sections were examined by two independent observers who were blinded to the treat- ment groups.
Immunohistochemical staining
The expression of complement 3 (C3) in kidney tissues was analyzed by immunohistochemistry. All sections (4 µm) were dewaxed in xylene and rehydrated by ethanol gradient elution. Then the antigen was retrieved in citric antigen retrieval buffer before blocking with 3% BSA solution. After the slides were incubated with 3% methanolic hydrogen peroxide, they were subsequently incubated with primary antibodies against complement 3 (C3) (1 : 200, Boster Biological Technology Co., Ltd, Wuhan, China) at 4°C overnight. After washing 3 times with PBS, the slides were incubated with secondary antibodies (goat anti-rabbit, 1 : 2000, Boster Biological Technology Co., Ltd, Wuhan, China) for 30 min at 37°C before being stained by DAB and counterstained with hematoxylin. Immunohistochemical analysis was performed in a blinded manner by two independent investigators and staining was graded on a scale of 0-4 as follows: 0 – 0-5% staining, 1 – 5-25% staining, 2 – 25-50% staining, 3 – 50-75% staining, 4 – > 75% staining.
Statistical analysis
Statistical data analysis was performed using the GraphPad Prism 8.0 software (La Jolla, CA) and was shown as the mean values ± standard error. Differences were analyzed using Student’s t-test or the Mann-Whitney U-test between two groups as applicable. One-way ANOVA followed by Tukey’s test was used to detect differences between three or more groups. For all tests, p-values of less than 0.05 were considered significant.
Results
Effect of rapamycin treatment on clinical and serological parameters in MRL/lpr mice
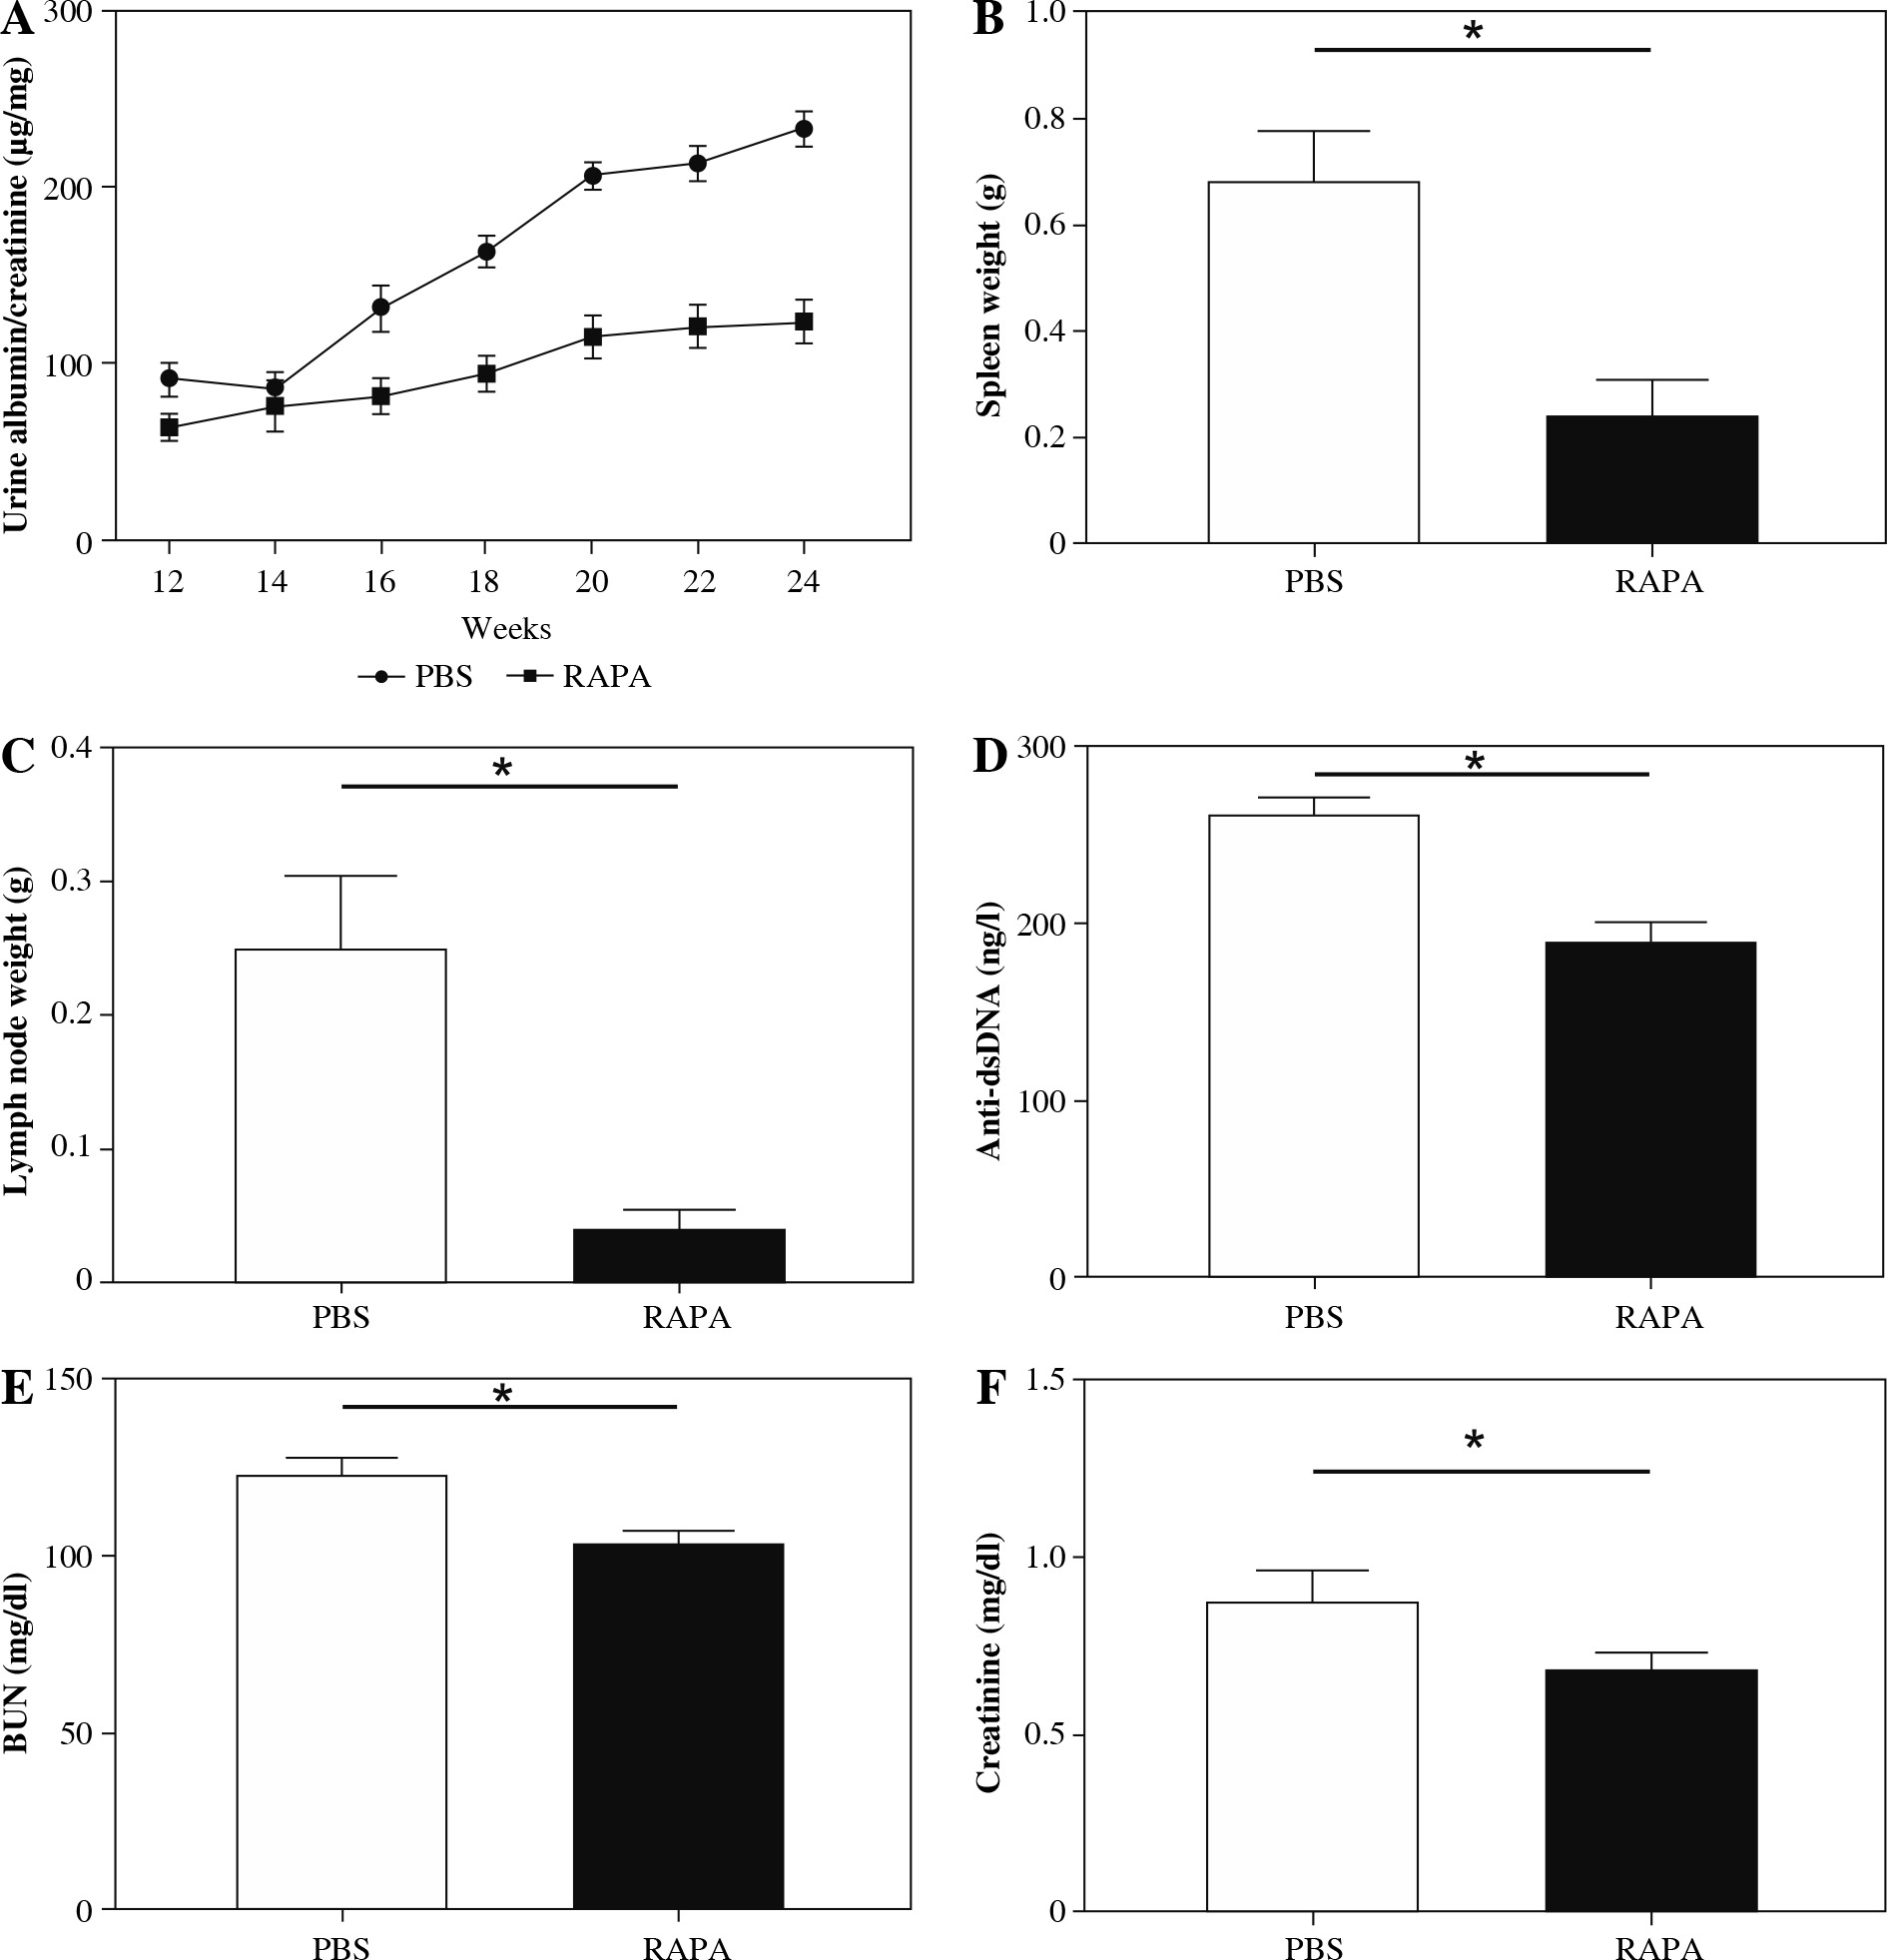
To examine the effect of rapamycin in the progression of LN, we injected 12-week-old female MRL/lpr mice intraperitoneally (i.p.) with rapamycin (1 mg/kg) or PBS, every other day for 12 weeks (up to 24 weeks of age). The dose and timing of rapamycin injection were based on previous studies by Stylianou et al., who demonstrated that rapamycin (i.p. 1 mg/kg, every other day for 12 weeks) can relieve LN in an NZBW/F1 murine model [37]. In our research, rapamycin-treated mice had significantly lower albuminuria during the study period (represented as urinary albumin to creatinine ratio) compared to PBS (Fig. 2A). Rapamycin treatment also significantly reduced spleen and renal draining lymph node weight (Fig. 2B, C). Anti-ds- DNA antibody level was also lower in the rapamycin-treated groups (Fig. 2D). Blood creatinine and BUN levels were significantly reduced compared with PBS treated mice (Fig. 2E, F).
Fig. 2
The effect of rapamycin on clinical and serological parameters in MRL/lpr mice. The effect of phosphate-buffered saline (PBS) or rapamycin treatment on: A) urine albumin-to-creatinine ratio, B) spleen weight, C) renal draining lymph node weight, D) circulating anti-dsDNA antibody titer, E) BUN level, F) blood creatinine level in MRL/lpr mice. Data expressed as mean ± SEM (n = 6 mice per group); *p < 0.05, dsDNA – double-stranded DNA, BUN – urea nitrogen
Rapamycin treatment relieved renal histopathological damage and C3 deposition in MRL/lpr mice
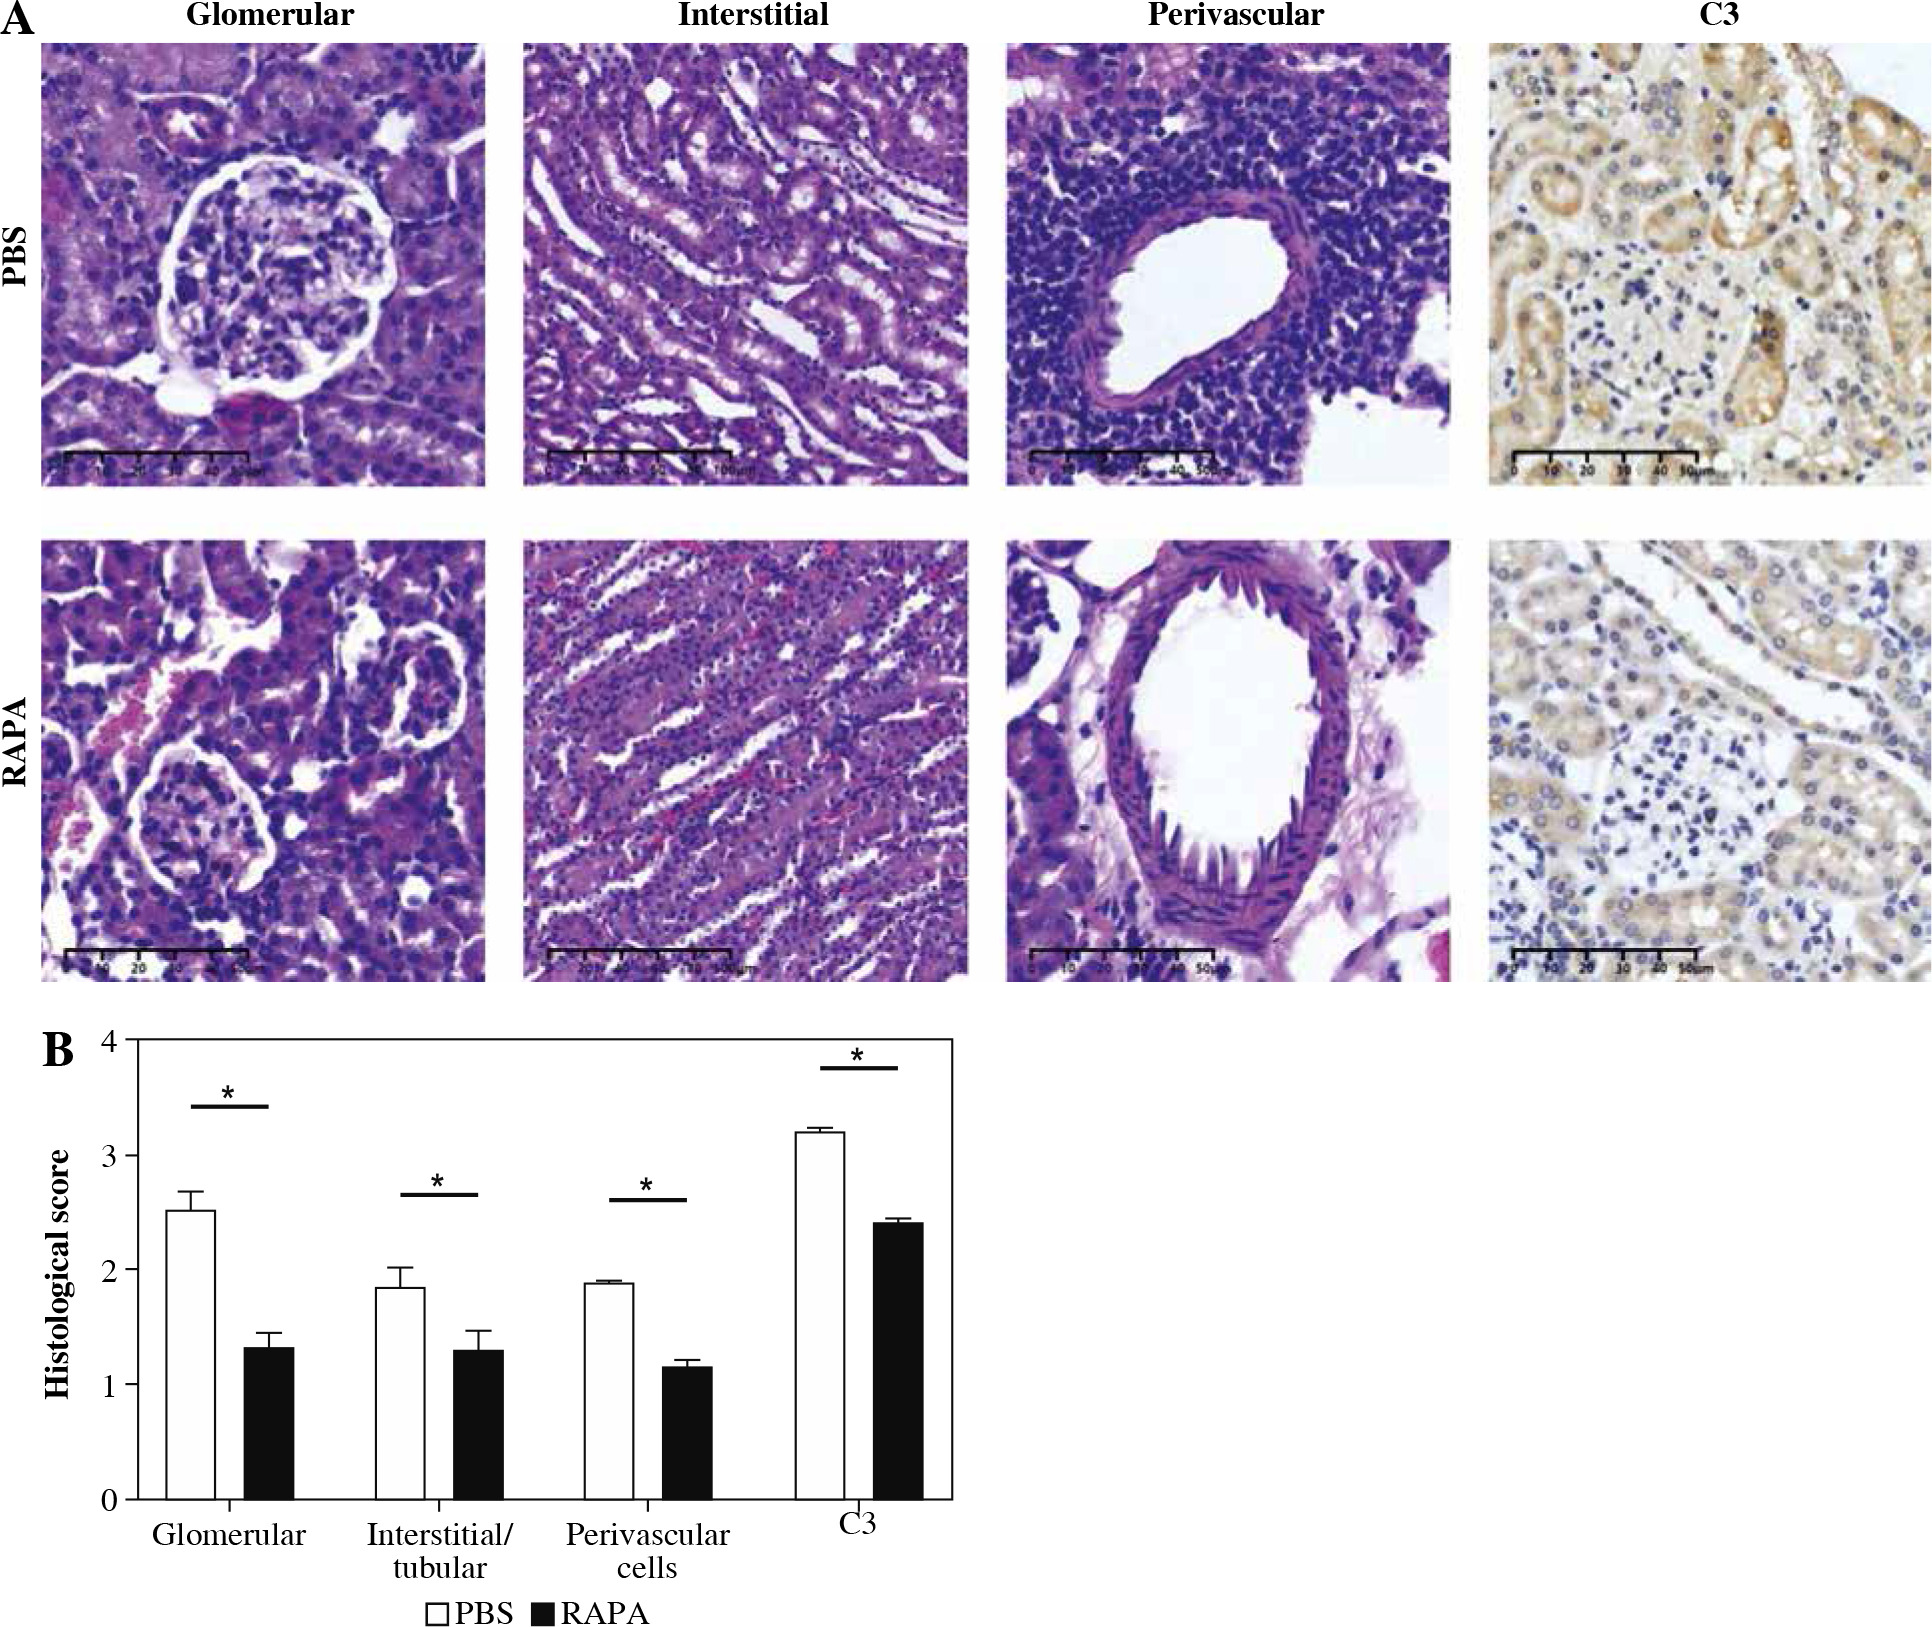
Renal injury in MRL/lpr mice is complex and consists of glomerular, interstitial, and perivascular infiltration of monocytes and lymphocytes with concomitant immune complex deposition and complement activation. The PBS treatment MRL/lpr mice exhibited typical lesions of diffuse proliferative lupus nephritis. The glomeruli showed progressive hypertrophy, with increased cellularity, crescent formation, increased matrix protein deposition, basement membrane thickening, and glomerulosclerosis. There was tubular atrophy, tubular cell necrosis, cast formation, and mononuclear cell infiltration in the periglomerular, tubulointerstitial, and perivascular areas. Treatment with rapamycin attenuated these abnormalities. Kidney specimens from rapamycin-treated mice had lower depositions of C3 than those of mice treated with PBS. Collectively, these results demonstrated rapamycin treatment significantly attenuated renal injury in MRL/lpr mice (Fig. 3).
Fig. 3
The effect of rapamycin on kidney histology and C3 deposition in MRL/lpr mice. A) Representative images stained with HE, PAS, Masson’s trichrome staining, and C3 immunohistochemistry in the kidneys of PBS or rapamycin-treated mice (original magnification 200×). B) Statistical results of glomerular lesion score, tubulointerstitial lesion score, PAS staining score, Masson’s trichrome staining score, and glomerular C3 deposition. Graphs show the mean ± SEM (n = 6 mice per group) and *p < 0.05
Rapamycin treatment expanded the percentage of CD4+CD25+Foxp3+ Tregs in MRL/lpr mice
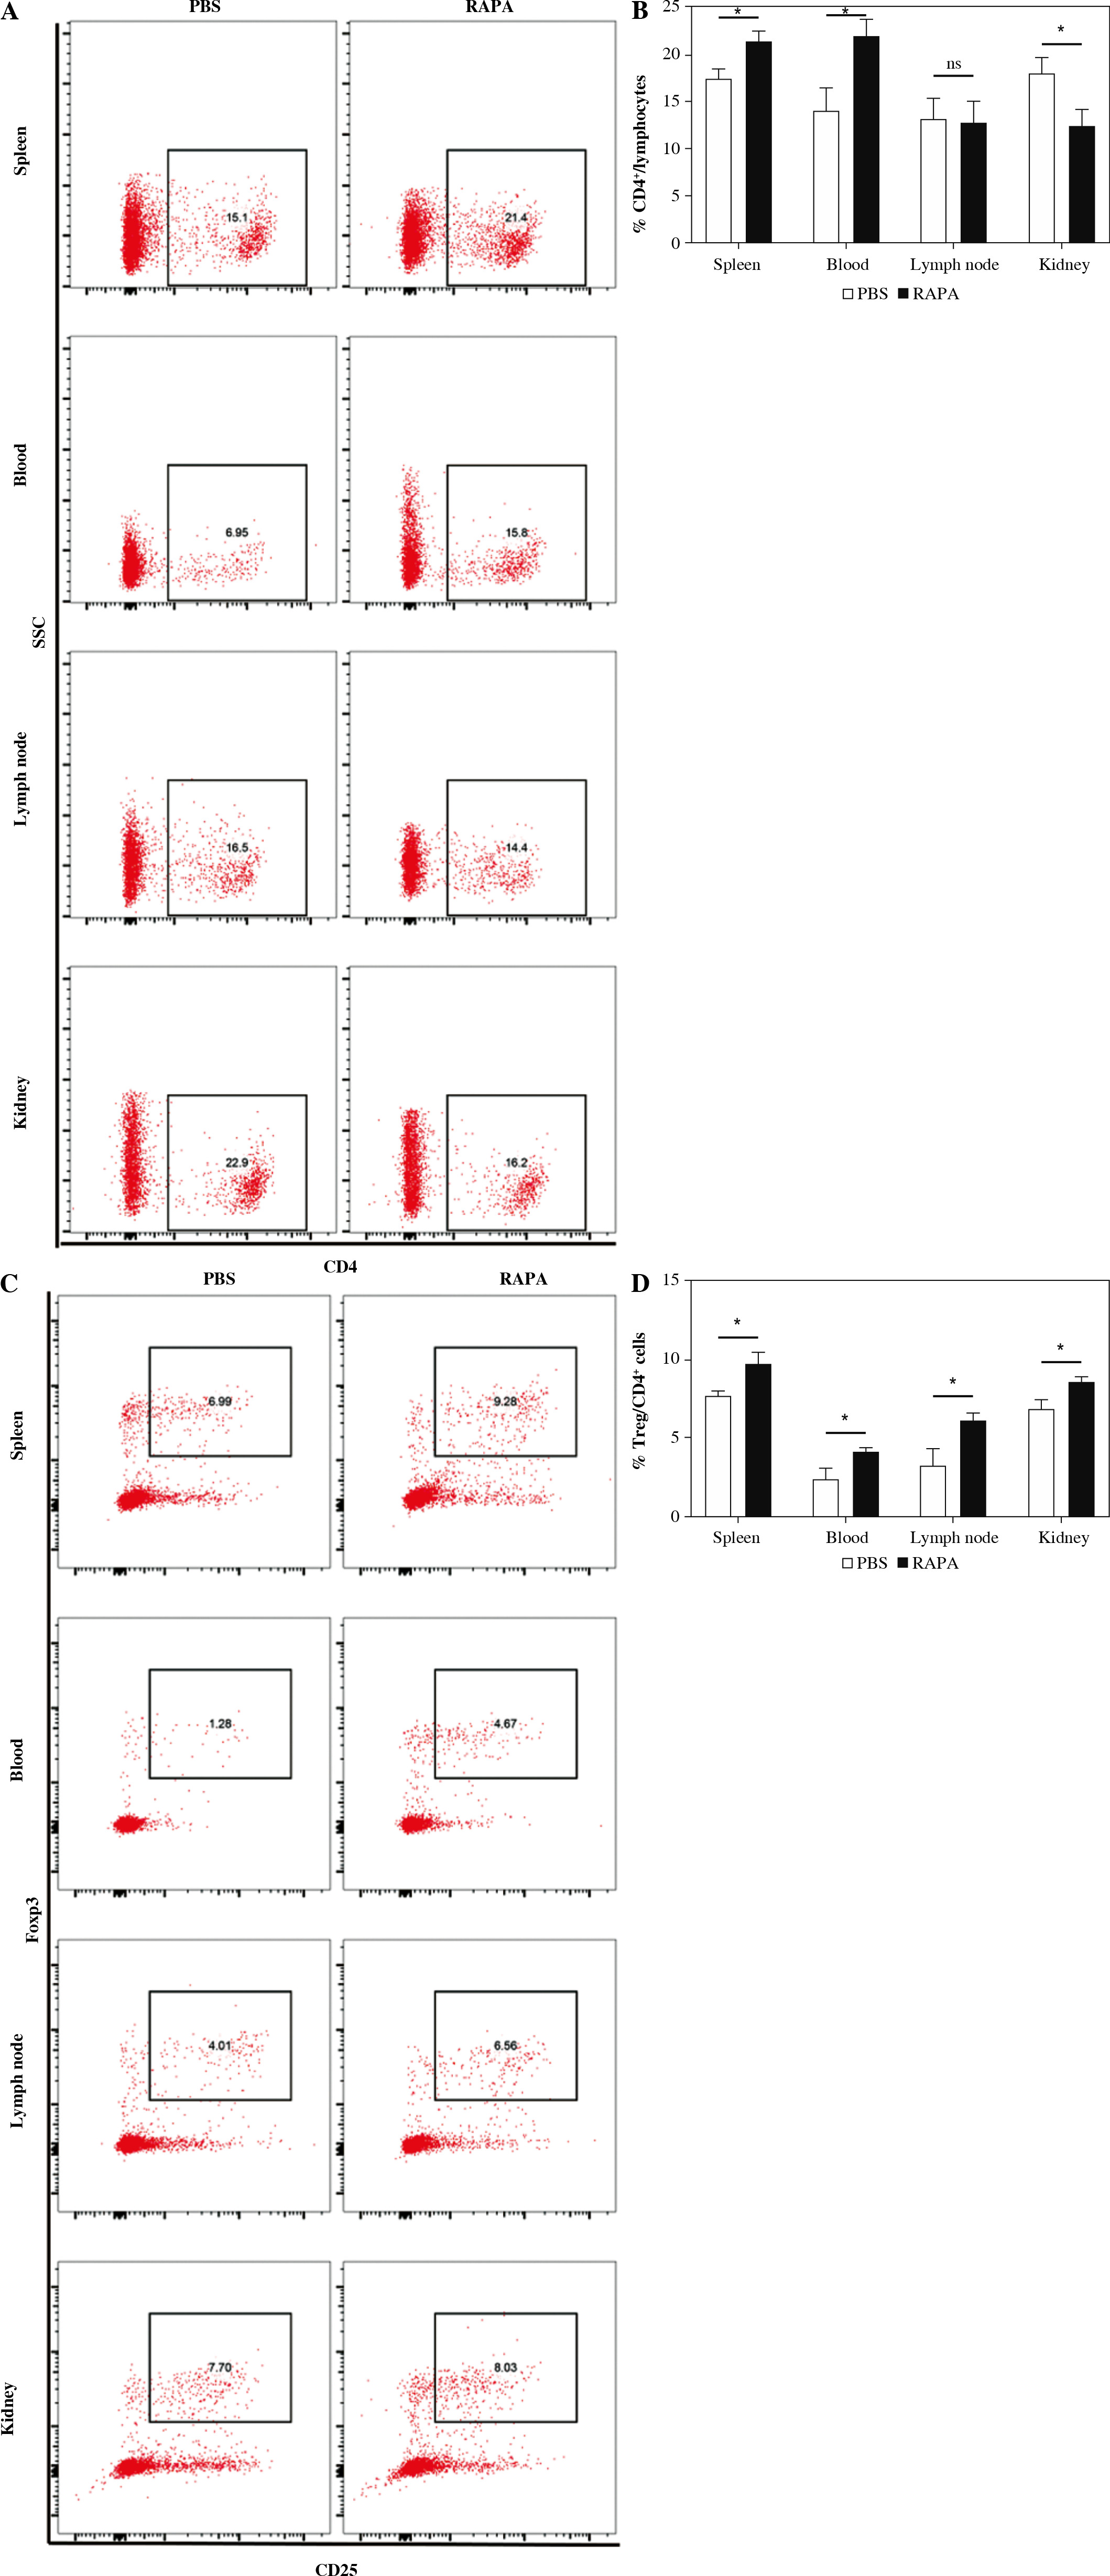
The percentages of CD4+ T cells and CD4+CD25+Foxp3+Tregs in the spleen, peripheral blood, renal draining lymph node, and kidney of MRL/lpr mice after rapamycin treatment were evaluated by flow cytometry (Fig. 4A, C). In the spleen and peripheral blood, the CD4+ T cells were increased, whereas the CD4+ T cells were decreased in the kidney by rapamycin treatment (Fig. 4B). Rapamycin treatment increased the percentages of CD4+CD25+Foxp3+ Tregs in the spleen, peripheral blood, renal draining lymph node, and kidney (Fig. 4D). Therefore, rapamycin preferentially expanded CD4+CD25+Foxp3+ Tregs in MRL/lpr mice.
Fig. 4
The effect of rapamycin on CD4+ T cells and CD4+CD25+Foxp3+ Treg cells. A, C) Representative flow cytometric dot plots of CD4+ T cells and CD4+CD25+Foxp3+ Treg cells in the phosphate-buffered saline (PBS) or rapamycin-treated mice. B, D) Percentage of CD4+ T cells and Treg cells in the spleen, peripheral blood, renal draining lymph node, and kidney in the PBS therapy group and rapamycin therapy group (n = 6 mice per group). Graphs show the mean ± SEM and *p < 0.05 A, C) Representative flow cytometric dot plots of CD4+ T cells and CD4+CD25+Foxp3+ Treg cells in the phosphate-buffered saline (PBS) or rapamycin-treated mice. B, D) Percentage of CD4+ T cells and Treg cells in the spleen, peripheral blood, renal draining lymph node, and kidney in the PBS therapy group and rapamycin therapy group (n = 6 mice per group). Graphs show the mean ± SEM and *p < 0.05
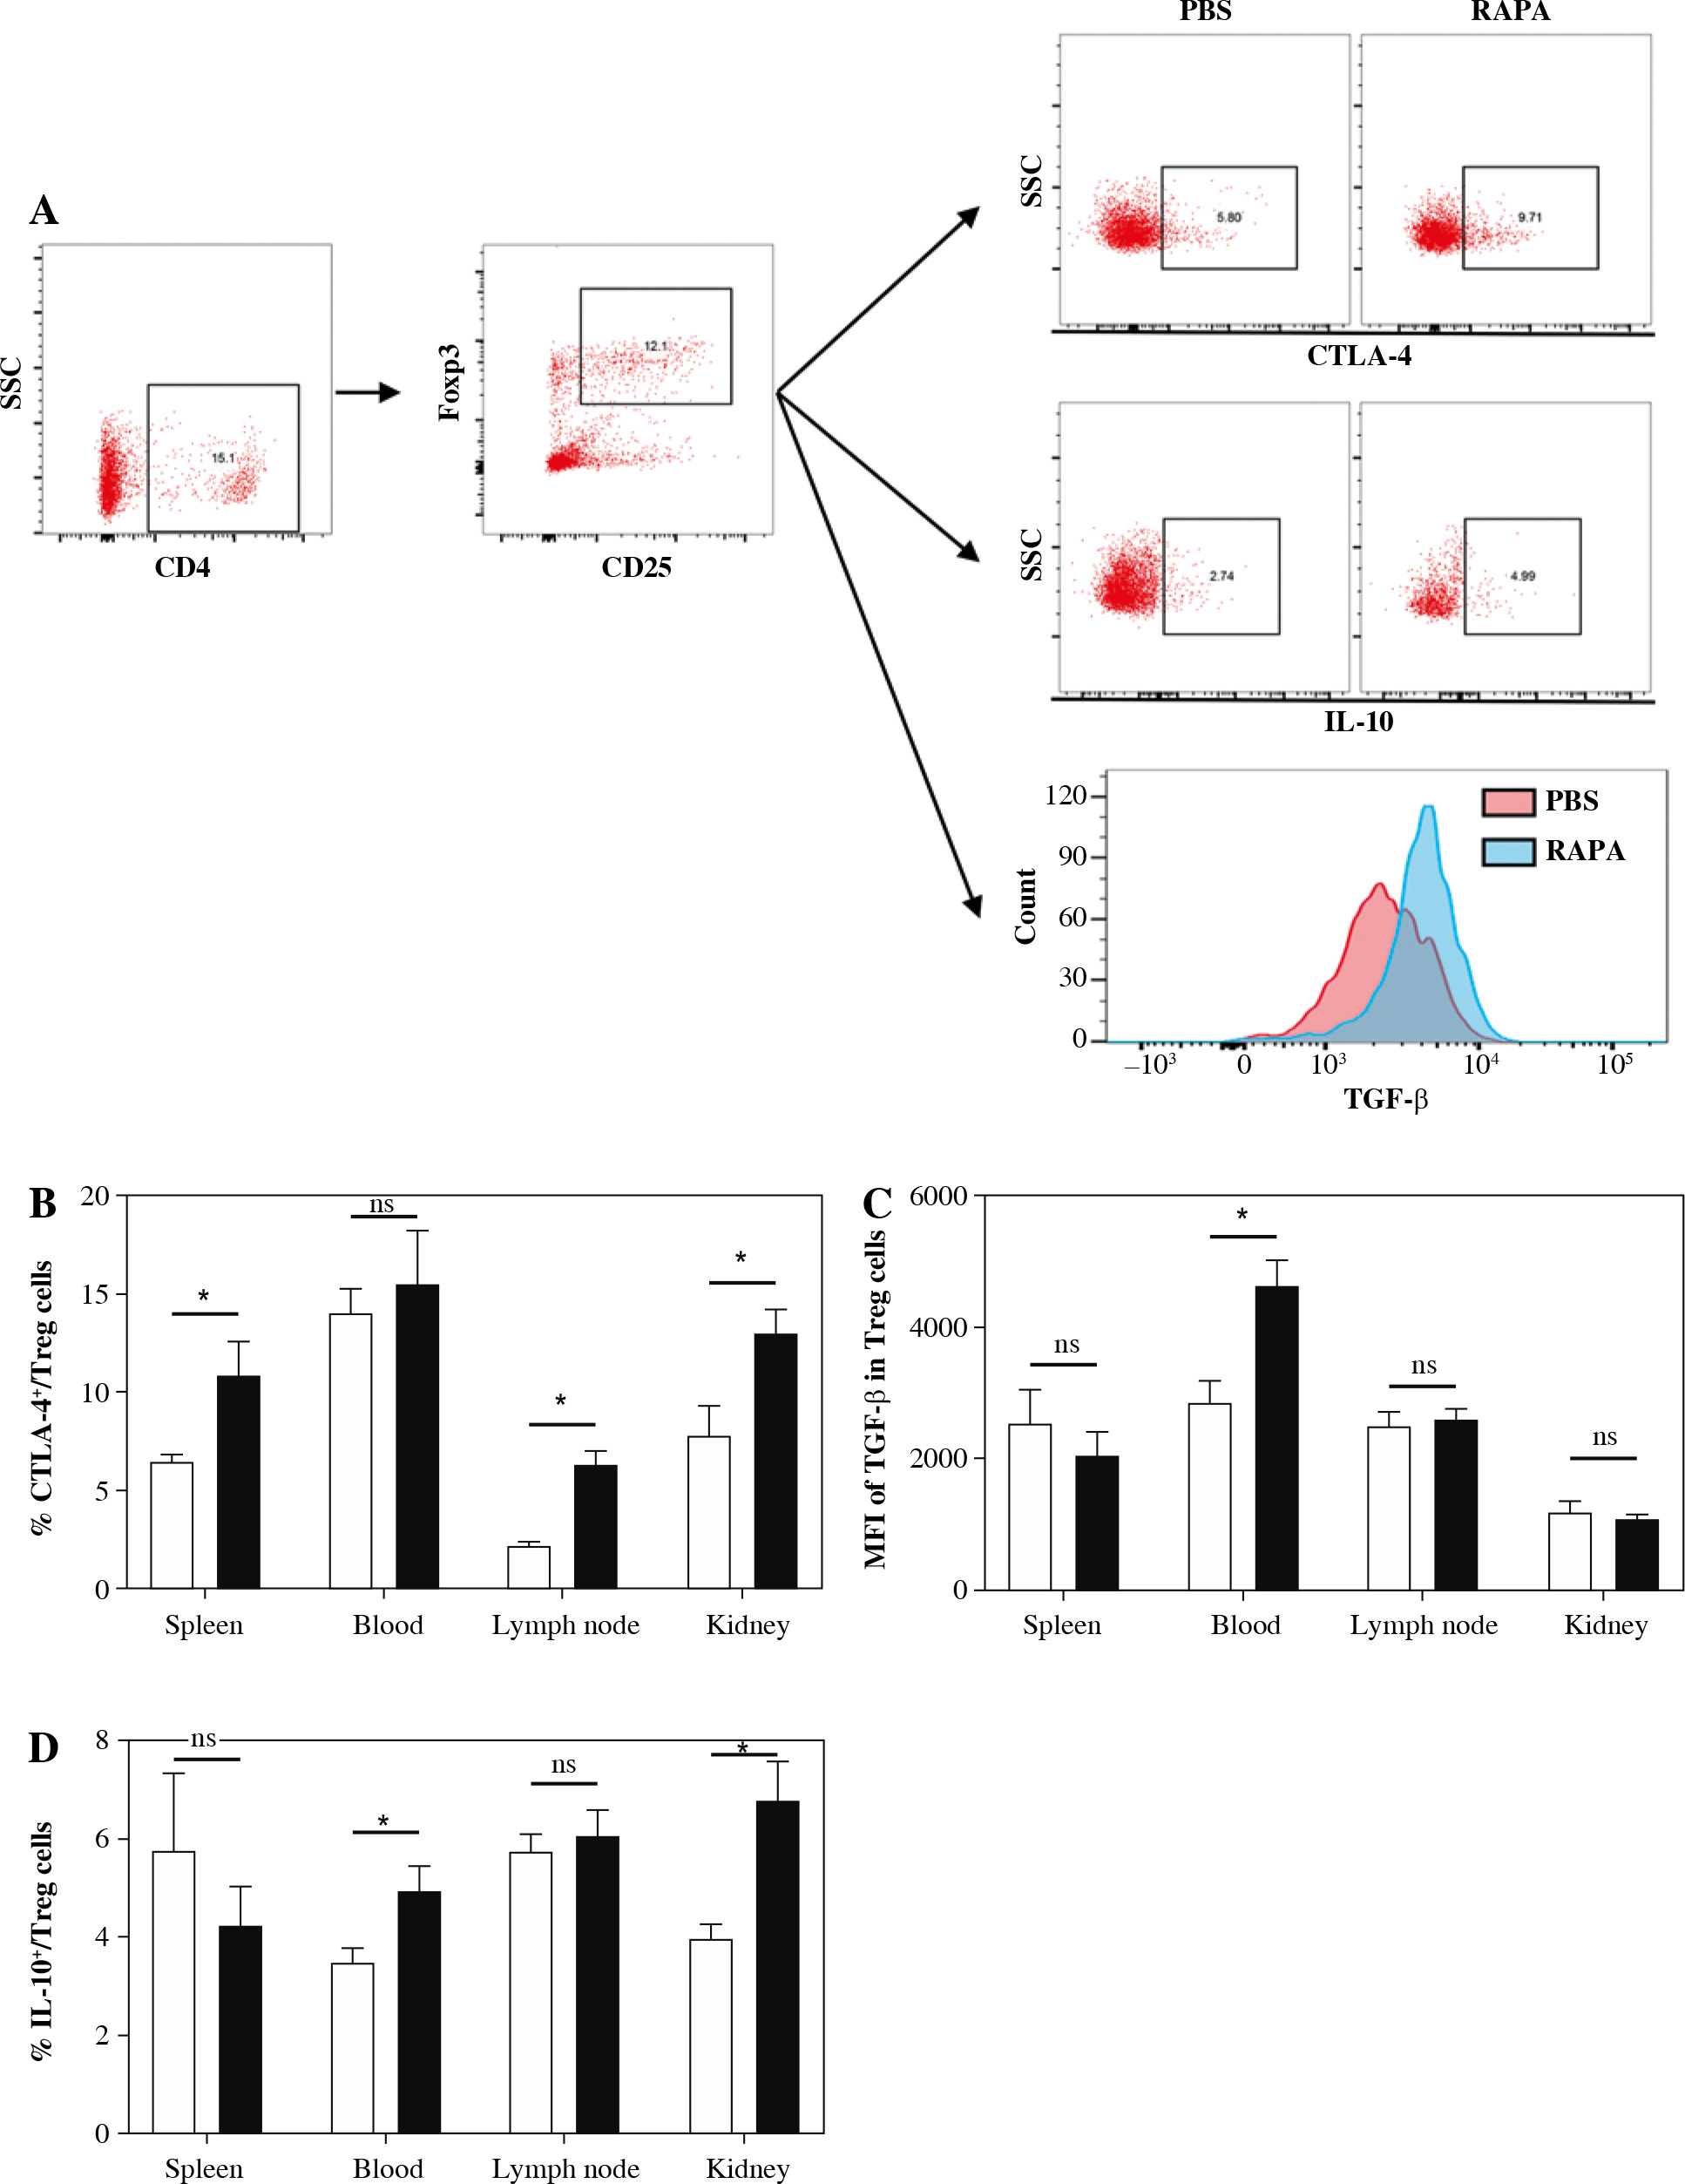
Rapamycin treatment increased expression of CTLA-4, IL-10, and TGF-β1 in CD4+CD25+Foxp3+ Treg cells of MRL/lpr mice
We next assessed the effects of rapamycin treatment on Treg suppressive markers, such as CTLA-4, IL-10, and TGF-β1 in Treg cells. Representative flow cytometric dot plots for CTLA-4+ cells, IL-10+ cells and the histogram for TGF-β1+ cells gated from the CD4+CD25+Foxp3+ Treg cell population are shown in Figure 5A. The results showed that rapamycin treatment increased expression of CTLA-4 in the spleen, renal draining lymph nodes, and kidney (Fig. 5B). The expression of TGF-β1 in Tregs was enhanced in peripheral blood (Fig. 5C). The percentage of IL-10+ cells in the Treg population in peripheral blood and kidney in rapamycin treated mice was also higher (Fig. 5D). These results indicate that rapamycin therapy can enhance the inhibitory function of Tregs.
Fig. 5
The impact of rapamycin on CTLA-4, TGF-β1, and IL-10 production in CD4+CD25+Foxp3+ Treg cells. A) Representative flow cytometric dot plots for CTLA-4+ cells, IL-10+ cells and histogram for TGF-β1+ cells gated from CD4+CD25+Foxp3+ Treg cell population. B) Percentage of CTLA-4+ cells expressed in spleen, peripheral blood, renal draining lymph node and kidney in the PBS or rapamycin-treated mice. C) MFI of TGF-β1 in Treg population in each group. D) Percentage of IL-10+ cells in Treg population in each group. Graphs show the mean ± SEM (n = 6 mice per group) and *p < 0.05
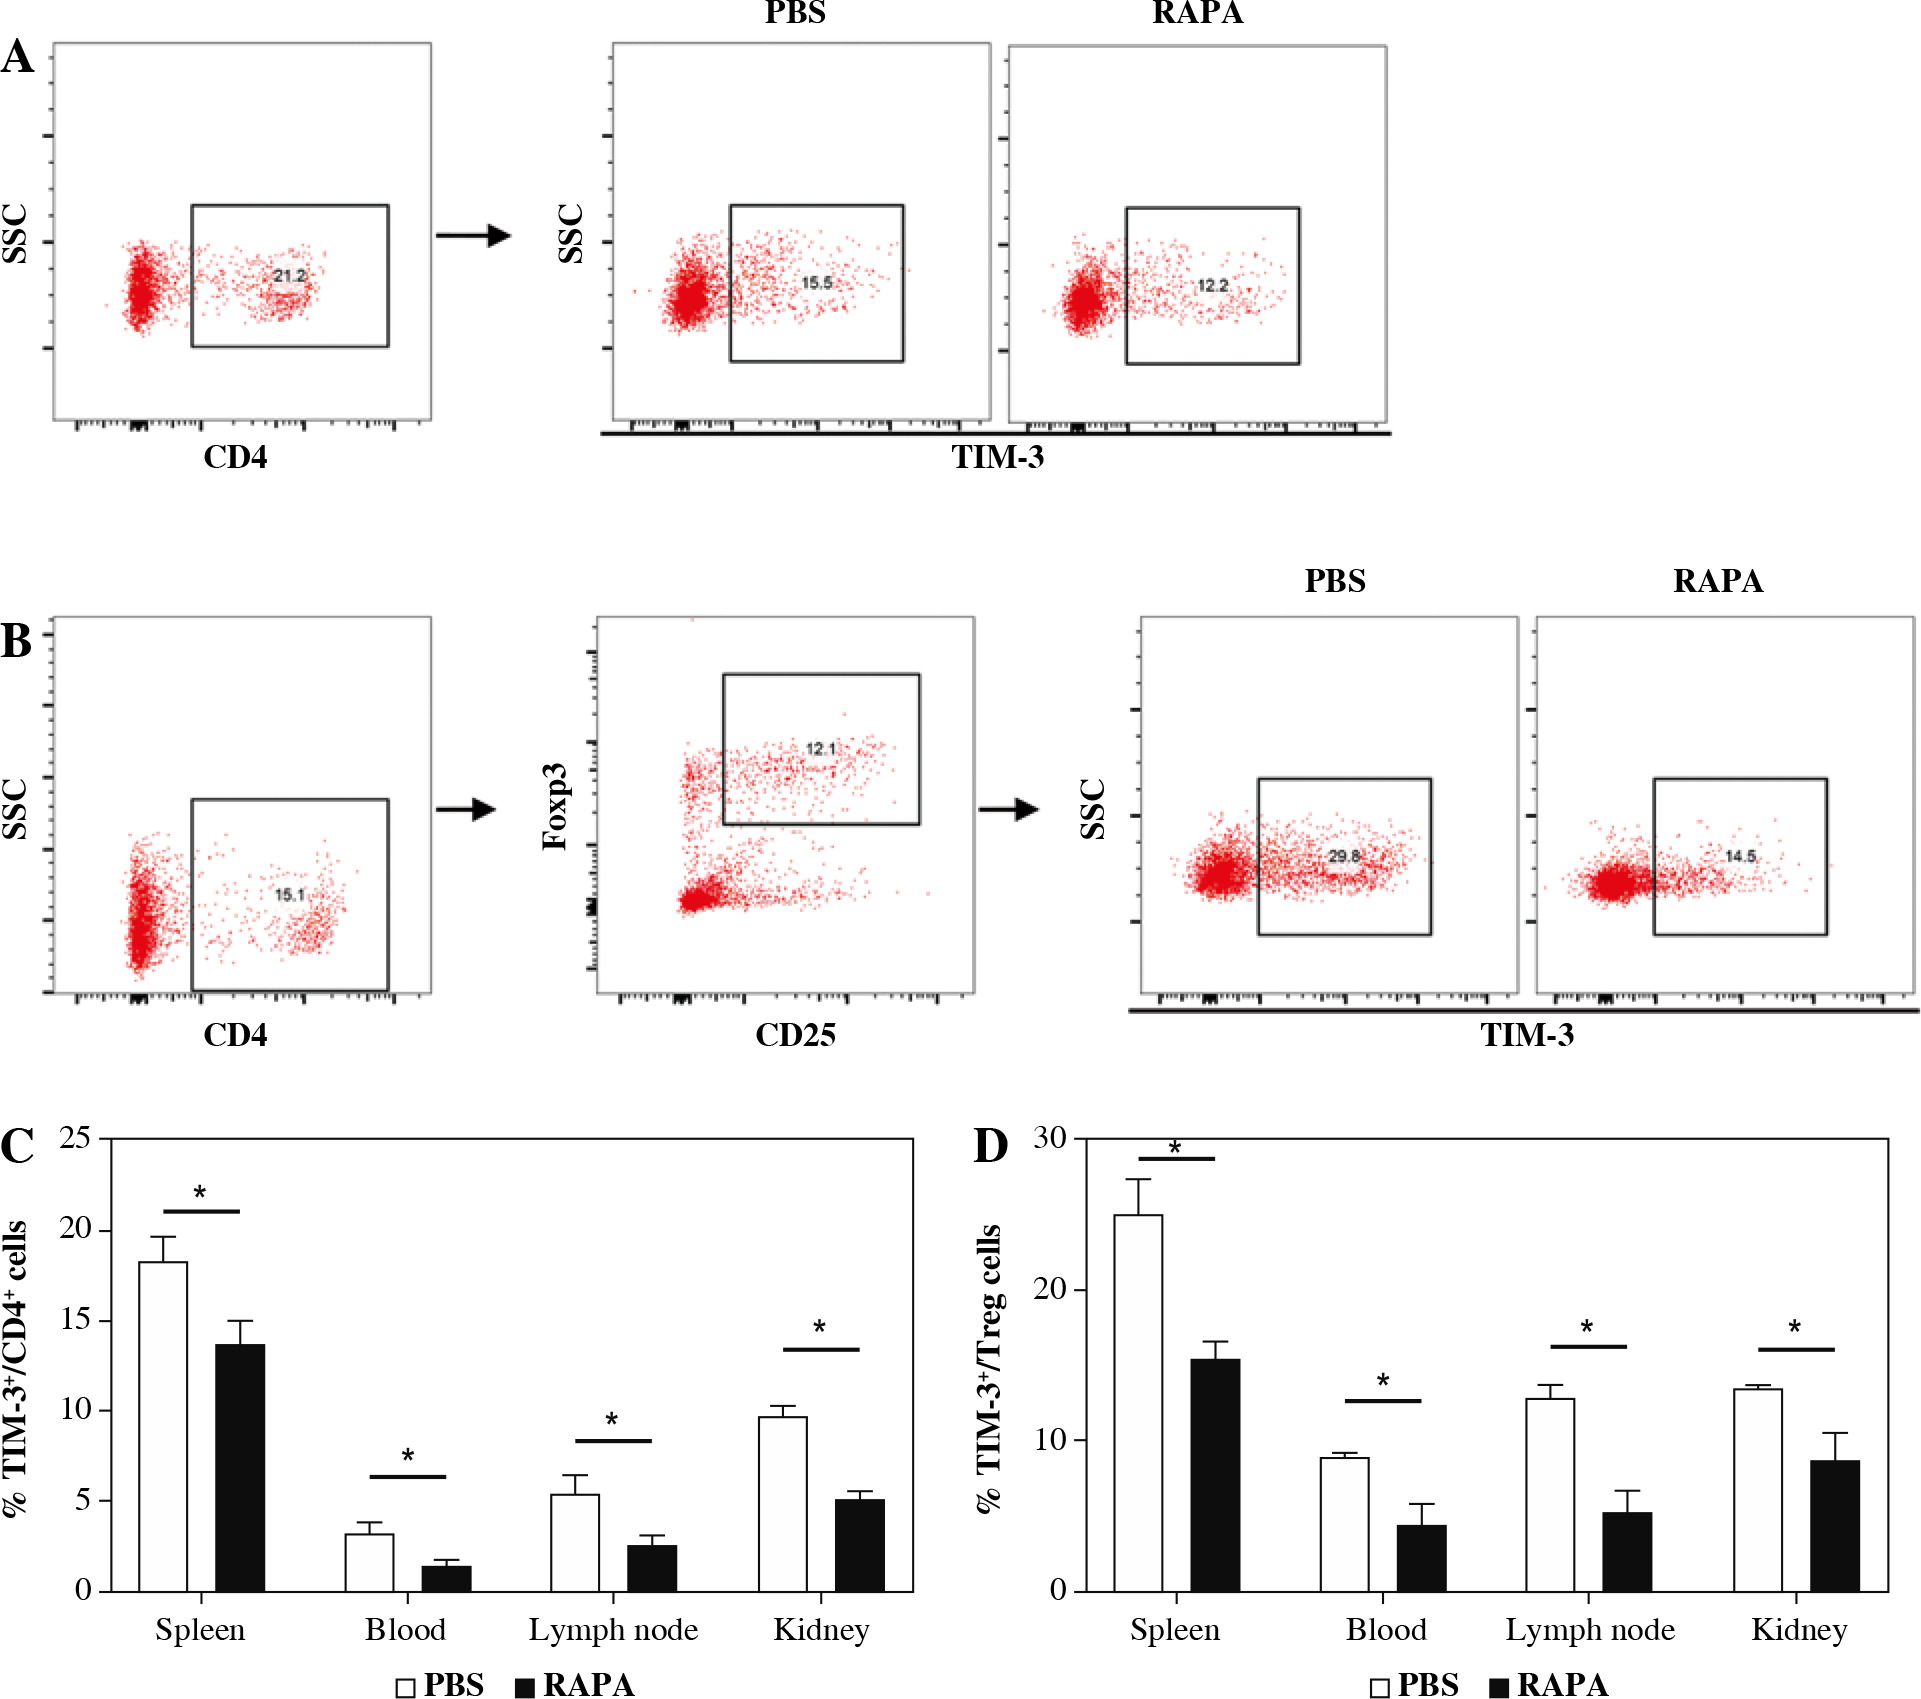
The effect of rapamycin on TIM-3 expression on CD4+ T cells and CD4+CD25+Foxp3+ Treg cells
To examine the effect of rapamycin on TIM-3 signaling, the expression of TIM-3 in CD4+ T cells and CD4+ CD25+Foxp3+ Treg cells was detected. As shown in Figure 6, TIM-3 was significantly reduced in the rapamycin treatment group compared with the control in the spleen, peripheral blood, renal draining lymph node, and kidney. Moreover, the expression of TIM-3 was significantly decreased in CD4+CD25+Foxp3+ Treg cells in the spleen, peripheral blood, renal draining lymph node, and kidney of mice treated with rapamycin. The results indicated that rapamycin-mediated protective actions involve TIM-3.
Fig. 6
The effect of rapamycin on TIM-3 expression on CD4+ T cells and CD4+CD25+Foxp3+ Treg cells. A) Representative flow cytometry analysis photographs of TIM-3+ cells gated from CD4+ T cells. B) Flow cytometric dot plots of CD25+Foxp3+ cells gated from CD4+ T cells, then TIM-3+ cells in CD4+CD25+Foxp3+ Treg population were assessed. C) The percentage of TIM-3+ cells in CD4+ T cell population in the PBS or rapamycin-treated mice. D) The percentage of TIM-3+ cells in the Treg cell population in each group. Graphs show the mean ± SEM (n = 6 mice per group) and *p < 0.05
Discussion
The present study demonstrated that rapamycin treatment attenuated proteinuria and histological damage including renal deposition of C3, and improved renal function. Spleen and renal draining lymph node weight and serum levels of anti-dsDNA antibodies were also improved by rapamycin. These results are consistent with previous studies. It has been confirmed that rapamycin is effective in the treatment of LN. Sirolimus was developed from rapamycin as a medication to prevent organ transplant rejection. The clinical efficacy of sirolimus has been confirmed in SLE patients as well. A recent open-label, phase 1/2, prospective clinical trial confirmed the efficacy of sirolimus in SLE patients who are unresponsive or intolerant to conventional medications [38]. A 21-year follow-up study of 73 patients suggests that sirolimus is well tolerated and exhibits long-term therapeutic efficacy in controlling renal and non-renal manifestations of SLE [39].
mTOR is a protein kinase regulating cell growth, survival, metabolism, and immunity. mTOR is usually assembled into several complexes such as the mTOR complex 1/2 (mTORC1/2) [40]. Specifically, the mTOR signaling pathway is involved in the regulation of the differentiation of Treg cells. mTORC1 plays a key role in regulating Foxp3 expression, and it is a robust antagonist of Treg cell differentiation [41, 42]. In addition to its critical role in Treg cell differentiation, mTORC2 blockade is likely to be essential for lineage stabilization and functional maturation of Treg cells [43, 44]. Previous research has shown that the activities of mTORC1 and mTORC2 are increased in SLE Treg cells, which drives the depletion and dysfunction of Treg cells via suppression of autophagy, and mTOR blockade with rapamycin could induce SLE patient Treg cell expansion, restore the expression of GATA-3 and CTLA-4, and recover the Treg cell suppressor function ex vivo [44]. Another study found that rapamycin increased the expression of Foxp3 in CD4+CD25+ T cells in SLE patients [45]. In our study, the Treg cells in MRL/lpr mice increased significantly after treatment with rapamycin, which was consistent with the previous study. In addition, we found that the functional molecules, such as CTLA-4, IL-10, and TGF-β1, were also increased in Tregs.
TIM-3 is generally thought of as an inhibitory protein, whereas, under some circumstances, TIM-3 exerts paradoxical costimulatory activity in T cells (and other cells) and promotes the inflammatory response [46]. Ectopic expression of TIM-3 in Jurkat cells in vitro in the context of short-term T cell receptor (TCR) stimulation was shown to promote TCR signaling [47]. Upregulated expression of TIM-3 on circulating monocytes accelerates the inflammatory response by promoting the production of inflammatory cytokines and Th17 responses in chronic hepa- titis B [48]. In NOD mice, the anti-TIM-3 antibody inhibited the production of TNF-α in DC and exhibited prominent therapeutic efficacy [49]. The PPARδ agonist GW0742 restores neuroimmune function by decreasing TIM-3 and restoring Th17/Treg-related signaling in the BTBR autistic mouse model [50]. In our study, mTOR was activated and TIM-3 expression was increased in T cells in LN mice, while after blocking mTOR with rapamycin, TIM-3 was decreased. This is consistent with the previous research, in which TIM-3 expression has been reported to be induced by activation of the PI3K/Akt pathway in response to PD-1 blockade [51].
In addition to the above mechanisms, the beneficial effects of rapamycin in LN might also be mediated through the following mechanisms: 1) Rapamycin treatment reduces the expression of HRES-1/Rab4 and Rab5A, and reverses the loss of CD4, Lck, and TCRζ, thus reducing calcium influx and improving the abnormal activation and cytokine production by SLE T cells [52]; 2) Suppression of lymphoproliferation. This hypothesis is consistent with the known mechanism of the action of rapamycin, which is the suppression of the proliferation of interleukin-2-stimulated-T lymphocytes via inhibition of mTOR [53]; 3) mTOR activation and aberrant autophagy is responsible for skewing of T cell lineage specification in SLE [54]. Treatment with rapamycin improved the immune response and function, and reduced the proportion of Th1, Th2, Th17, and DN T cells in the spleen, kidney, and peripheral blood [33, 45, 55]; 4) Treatment with rapamycin blocked the IL-4 production and necrosis of DN T cells, which can release immunogenic nuclear materials [56]; 5) Rapamycin reduced intrarenal CCL5 expression and decreased CD4+, CD8+ T cell, B cell, and macrophage infiltration in the kid- neys [32]; 6) Rapamycin reverses the senescent phenotype and improves immune regulation of mesenchymal stem cells from LN [57]; 7) mTORC1 and mTORC2 are markedly activated, which may underlie the diminished autophagy in podocytes, mesangial cells, endothelial cells and tubular epithelial cells of LN patients. Autophagy is protective within podocytes and required for recovery from autoantibody-induced podocyte injury [54, 58]. Maybe rapamycin treatment is renoprotective through promoting autophagy in podocytes, mesangial cells, endothelial cells and tubular epithelial cells; 8) Rapamycin decreased mesangial cell proliferation, and their binding with anti- dsDNA antibodies. Rapamycin treatment also inhibited fibrotic responses in mesangial cells and reduced fibrosis in LN [59]; 9) Treatment with rapamycin restored Rab4A and Drp1 levels, diminished the expression of NDUFS3, reduced the oxidative stress of mitochondria, and improved mitochondrial dysfunction in the liver, thus abrogating the production of anti-cardiolipin antibodies (ACLA), anti- β2GPI, and anti-phospholipid antibodies [60].
In summary, in the present study, rapamycin treatment induced preferential expansion of CD4+CD25+Foxp3+ Tregs with increased expression of CTLA-4, IL-10, and TGF-β1, and decreased TIM-3 expression, thereby ameliorating lupus nephritis in an MRL/lpr mouse model.