
INTRODUCTION
Major depression is a widespread mood disorder with a high rate of relapse and chronicity [1]. It causes physical and psychosocial impairments, as well as cognitive, motor, and somatic symptoms, leading to considerable distress [2].
The prevalence of depression varies between different parts of the world, with rates of 1.6% in China, 5.0% in the United Kingdom, and 9.0% in the United States [2]. Over the past 30 years, the global incidence of depression has increased by almost 50% [3], and currently more than 260 million people of all ages are affected by the condition [4]. Depression remains one of the most significant psychiatric disorders, not only due to its widespread prevalence but also because of its adverse impact on individuals’ ability to function in daily life, its economic consequences, and increased risk of suicide. Suicide due to major depressive disorder (MDD) is the second most frequent cause of death among 5-29 year-olds.
In a study investigating whether women are more prone to depression than men, it was reported that they are twice as likely to experience depression in their lifetime [4]. However, men are three-to-four times more likely to be prone to suicide than women [5]. The reasons behind this heightened risk have long been a topic of discussion, encompassing cultural factors, hormonal imbalances, and gender-based determinants [4, 6].
Women are more susceptible to depression throughout certain stages of their lives, such as during adolescence, pregnancy, childbirth, and the postpartum period [7]. Studies show that the lifetime prevalence of depressive disorders is over 1.7 between women and men [8]. Pregnancy is a significant time of biological, psychological, and social transformation and necessitates adaptation. A psychologically resilient woman perceives this period as an opportunity for self-discovery and self-expression as a woman. Negative attitudes and expectations related to pregnancy are often attributed to apprehension surrounding childbirth or concerns about maternal identity. Consequently, increased anxiety, emotional instability, and depression may arise during pregnancy. Furthermore, postnatal depression is a crucial health concern in the postpartum period [9]. Meta-analyses conducted in high-income countries estimate that the incidence of maternal depression during pregnancy is 11%, and 13% in the postnatal period [10]. Maternal postnatal depression surpasses paternal depression, although depressed mothers can trigger depression in fathers [11]. The triggering of depression can be attributed to different causes, ranging from hormonal changes in women to traditional gender norms for men, such as suppression of emotions [5].
It is crucial to accurately identify and treat depression, and many efforts are made to investigate the transcriptome alterations in blood samples associated with it. However, the question arises as to whether there is a correlation between gene expression in the blood and brain tissues of depressed individuals. The study aimed to examine both gender-specific and tissue-specific variations in gene expression in the context of depression, based on transcriptomic analysis using the RNA-Seq data. The objective was to ascertain whether depression triggers differential gene expression as an environmental or hormonal process in both genders.
METHODS
RNA-Seq data
The depression datasets GSE190518 and GSE214921 were downloaded from the NCBI Gene Expression Omnibus (GEO; https://www.ncbi.nlm.nih.gov/geo/). These datasets were obtained from the platforms GPL20301 (Illumina HiSeq 4000) and GPL24676 (Illumina NovaSeq 6000) respectively. The transcriptome data in GSE190518 comprises peripheral blood samples from 4 patients with MDD and 4 matched healthy controls (HCs), while the transcriptome data from GSE214921 includes human postmortem orbitofrontal cortex bulk tissue (brain tissue) from 39 individuals, of whom 20 suffered from MDD, and 19 other healthy individuals (Table 1). This manuscript does not draw on any experimental data on humans or animals, and all data utilized in this study are freely available from the Gene Expression Omnibus database.
Determination of differently expressed genes
Identifying differentially expressed genes (DEGs), the GSE190518 and GSE214921 transcript counts were downloaded and analyzed with the R software (version 4.0.2, https://www.r-project.org/). When analyzing this data, the first step is to determine DEGs by using the DESeq2 analysis tool in R [12]. Intra- and inter-group correlations were assessed using the DESeq2 package. Initially, a general transcriptomic analysis of brain tissue was conducted without considering gender differences. Subsequently, the dataset was analyzed separately for female and male samples within their respective groups. For blood samples, comparisons were made between healthy controls and patients with depression within the same group. All analyses were independently executed, with normalization applied automatically for each group. The DESeq2’s dispersion estimation algorithms were utilized to account for biological variability within groups, ensuring accurate intra-group correlation. Inter-group comparisons were performed manually based on the results of independent analysis , and the findings were interpreted by comparing the outcomes across the different groups. The selection thresholds for DEGs were p-values ≤ 0.05, and Log2FC ≤ –1, and Log2FC ≥ 1. These threshold values were accepted as significant. Following this, all data were compared as tissue-specific DEGs (blood vs. brain tissue) and sex-specific DEGs (female vs. male).
Functional analysis of DEGs
Differentially expressed genes in both blood samples and postmortem orbitofrontal cortex bulk tissue were studied with the clusterProfiler package in R software. The Benjamini and Hochberg (BH) method was used to adjust p-values for false discovery rate (FDR) [13]. The DEGs clustered according to molecular function, biological process, and cellular component. In addition, the analysis of KEGG (Kyoto Encyclopedia of Genes and Genomes) pathways was carried out with the use of the org.Hs.eg.db library in R [14]. The results obtained were visualized with the ggplot2 package and constructed as volcano plots of differentially expressed genes (DEGs) [15]. Additionally, the ggVennDiagram package was used to create Venn diagrams for the visualizations of common genes according to gene ontology results [16].
RESULTS
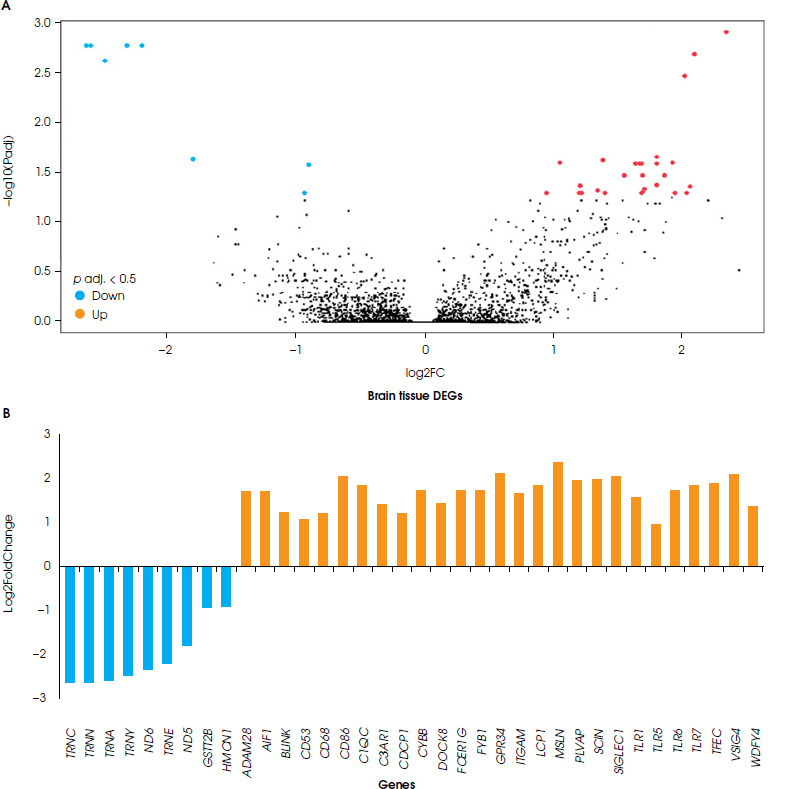
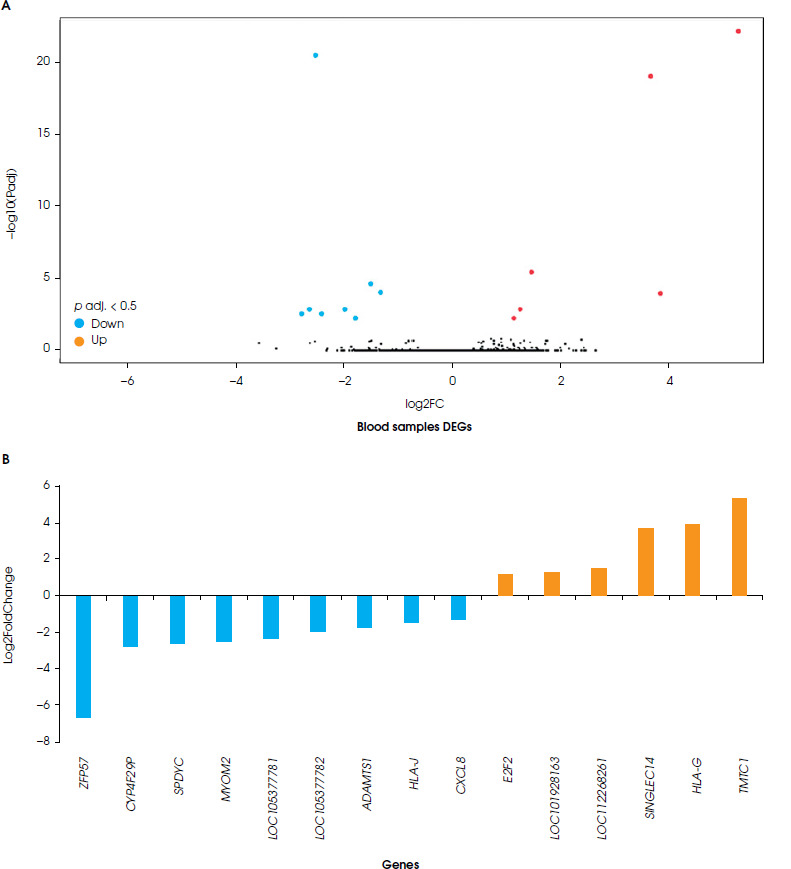
A comparison was made between blood and brain tissue from individuals with depression. A total of 51 DEGs were found in these studies. Of these, 33 genes were upregulated (27 genes in the brain tissue, and 6 genes in the blood samples), and 18 genes were downregulated (9 genes in the brain tissue, and 9 genes in the blood samples). However, the blood and brain tissue samples did not show any common differentially expressed genes. When comparing brain tissue and blood samples according to DEGs, it was observed that brain tissue contains 36 DEGs, and that these genes consisted of 9 downregulated genes and 27 upregulated ones (Figure I), while the blood samples included 15 DEGs, and of these genes 9 were down-regulated and 6 upregulated (Figure II).
According to KEGG pathway analyses of the brain tissue of a person with depression, genes in the aminoacyl-tRNA biosynthesis pathway were downregulated. In contrast, genes related to the immune system were upregulated, including the Toll-like receptor signaling pathway and the bacterial/viral infection-related pathway. Furthermore, CD86, TLR7, TLR1, TLR6, TLR5 (the Toll-like receptor signaling pathway), and C3AR1, ITGAM, C1QC, VSIG4, TLR1, TLR6, FCER1G and CYBB (the immune-mediated pathway) genes were upregulated in depressed brain tissue. The comparison of KEGG pathways between brain and blood tissue resulted in different findings. The KEGG pathway analysis of blood samples from patients with depression showed changes in cellular senescence and response to viral infection, as well as bladder cancer pathways. Yet neither of the genes nor the pathways were common to different tissues (Table 2).
Table 2
KEGG pathway analysis of differentially expressed genes in brain tissue and blood samples
Functional analyses of differentially expressed genes in both the brain and blood samples were performed using the clusterProfiler package in R software, and the FDR value < 0.05 was accepted as significant. All the results obtained are given in a supplementary file (S-1). Based on the gene ontology analysis of DEGs in brain tissue, five pathways that are thought to be highly associated with depression were selected on the basis of molecular function, biological process, and cellular component (Figure III).
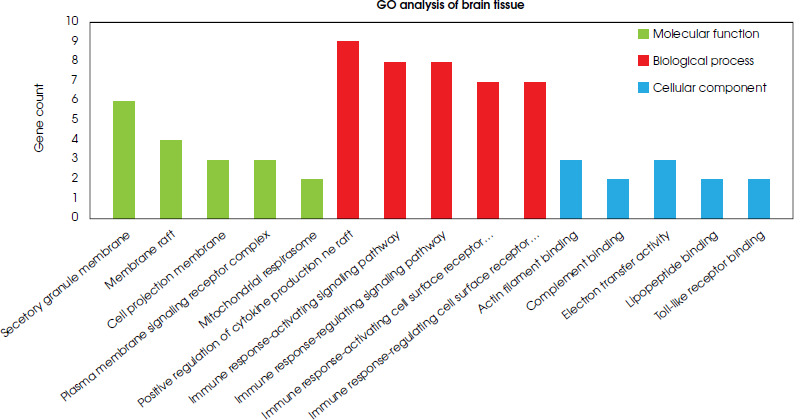
Upon analyzing the cellular components of brain tissue, six genes (CD53, C3AR1, ITGAM, CYBB, CD68, and FCER1G) were identified as responsible for forming the secretory granule membrane structure and were found to be upregulated in depression. Of these, CYBB, TLR1, and TLR6 were also commonly upregulated in phagocytosis and endocytosis, both of which require changes in cell membrane structure. This, in turn, necessitates the assembly of actin filaments to form membrane vesicles. Therefore, genes such as LCP1 and AIF1 were upregulated to induce ruffle membrane and actin filament assembly, along with CYBB, TLR1, and TLR6 genes involved in phago/endocytosis (S-1). In the biological processes visible in depressed brain samples, various pathways are affected such as the positive regulation of cytokine production, interleukin-6 production, interleukin-8 production, the toll-like receptor signaling pathway, T cell migration, cell-matrix adhesion, and leukocyte chemotaxis (S-1). In the analysis of biological process pathways in brain tissue, the most abundant genes were linked to the positive regulation of cytokine production and immune response pathways, and related genes in these pathways were upregulated. It was found that the C3AR1, TLR1, TLR5, TLR6 and FCER1G genes were associated with the positive regulation of cytokine production and four immune response pathways. In addition, TLR7 was related to the positive regulation of the cytokine production pathway, the immune response- activating signaling pathway, and the immune response- regulating signaling pathway. The FYB1 and BLNK genes were linked to of the immune response pathways. Additionally, the CD86, AIF1, and TLR6 genes that were upregulated were responsible for leukocyte activation, toll-like receptor signaling, interleukin production and cytokine production (S-2). Molecular function analyses clearly showed that brain samples from people with depression have a different gene expression pattern in pathways such as actin filament binding, opsonin binding, electron transfer activity, lipopeptide binding, and Toll-like receptor binding (S-1). According to the molecular function pathways in the brain tissue, three upregulated genes (AIF1, LCP1, and SCIN) were responsible for actin filament binding. Two upregulated genes, ITGAM and VSIG4, were responsible for binding processes such as complement binding and opsonin binding. The TLR1 and TLR6 genes are related to lipopeptide binding and Toll-like receptor binding processes. These genes are also associated with NAD+ and NAD(P)+ nucleosidase activity. It was observed that the ND5, ND6 and CYBB genes were linked to electron transfer activity, and that the ND5 and ND6 genes were downregulated, while the CYBB gene was upregulated (S-2).
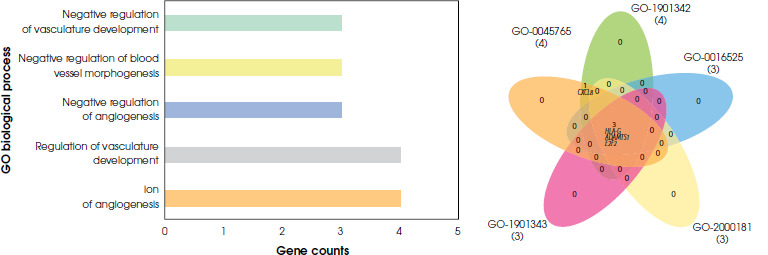
According to the gene ontology analysis of differentially expressed genes from the blood samples, significant results were found only for pathways associated with biological processes (p < 0.05). No significant pathways were found to be related both molecular function and cellular components (p > 0.05). In the biological process pathway analyses of blood samples from depressed individuals, two pathways were identified with a common gene expression profile. These pathways are the regulation of angiogenesis and the regulation of vasculature development. The gene expressions of CXCL8 and ADAMTS1 were downregulated, while HLA-G and E2F2 were upregulated (S-1). There is no statistically significant difference in gene expression linked to cellular and molecular pathways for the blood samples (Figure IV).
Figure IV
Gene ontology analysis of differentially expressed genes of blood tissue. Barplot and Venn diagrams represent gene ontology pathways and GO ID’s GO:0051015: actin filament binding, GO:0001848: complement binding, GO:0009055: electron transfer activity, GO:0071723: lipopeptide binding, GO:0035325: Toll-like receptor binding
Various genes are responsible for major depression, and these genes show differences between female and male individuals. The aim of this study was also to investigate the variety of differentially expressed genes based on gender among those who suffer from depression. When comparing differentially expressed genes across female and male brain samples, there was an identification of upregulation in only one gene in females and downregulation in 24 genes, whereas differentially expressed genes were not found in males. After the Log2FC value was filtered as Log2FC ≤ –1 and Log2FC ≥ 1, only 20 genes were significant, and all of these were downregulated. The gene expression levels of HSPA6, HSPA7, HSPA1A, HSPA1B, HSPA1L, G0S2, DNAJB1, and REM1 were found to be diminished, with fold differences of –58.41, –21.36, –10.44, –9.70, –7.01, –6.44, –6.40, and –5.87, respectively. The fold differences of the other genes change from –4.48 to –2.07 (Table 3).
Table 3
Differentially expressed genes in depressed females
The genes found to be downregulated in females were specifically linked to cell stress proteins that engage in protein refolding, such as HSPA6, HSPA7, HSPA1A, HSPA1B, and HSPA1L. Additionally, DNAJB1, which regulates the heat shock response, was also linked to these genes (Table 4). According to gene ontology analysis, five pathways thought to be related to depression were selected for every ontological process. The results obtained revealed that the HSPA6, HSPA7, HSPA1L, HSPA1A, and HSPA1B genes were responsible for various the gene ontology processes such as ATP-dependent protein folding chaperone, chaperone cofactor-dependent protein refolding, chaperone-mediated protein folding, and blood microparticle (Table 5). Molecular function analyses have shown that depression delays protein refolding and the heat shock response. Additionally, cellular repair mechanisms and cell cycle regulation are also delayed.
Table 4
KEGG pathway analysis of differentially expressed genes the brain tissue of depressed females
Table 5
Gene ontology analysis of differentially expressed genes in the brain tissue of females with depression
DISCUSSION
There are numerous variables, including gender-based discrimination, that cause sex-dependent depression to be more common in women than in men, even if the risk factors for depression seem to be identical. Depression, a multifaceted psychiatric phenomenon, has been studied in relation to gender by examining single nucleotide polymorphisms that affect cortisol release [17], dopamine levels [18, 19], and the immune system [20, 21]. Nevertheless, our transcription analyses emphasized the biological aspect of the etiology of depression in females, considering it as a multifaceted characteristic of the condition. In the investigation presented here, we observed that distinct genes activate immune system-related pathways in both sex-specific and tissue-specific transcriptome analyses.
The findings from the Netherlands Twin Register (NTR) and the Netherlands Study of Depression and Anxiety (NESDA) indicate that LGSN is specifically linked to depression in males, whereas PCLO, LAPTM4A/SDC1, C18orf62, and SPC24/KANK2 are connected with depression in females [22]. Our research indicates that females’ repressed genes are linked to cell stress proteins involved in protein refolding, such as HSPA6, HSPA7, HSPA1A, HSPA1B, and HSPA1L. According to our findings, depressed women experience a lag in heat shock response, protein refolding, and cell cycle regulation and repair. The heat-shock 70 family of proteins has recently been proposed to be stimulated by antidepressants, leading to a decrease in pro-inflammatory cytokines [23]. It is expected that a decrease in the expression of Hsp70 family members in women with depression within this framework should be observed. The synthesis and folding of proteins in the ER secretory pathway is important for the maintenance of cellular function. The folding of secretory proteins in this pathway is constantly controlled by calnexin and calreticulin. If protein folding does not occur correctly, the ERAD (endoplasmic reticulum associated protein degradation) pathway is first activated and then, if this response is not sufficient, the unfolded protein response (UPR) occurs. To activate the UPR, 3 different types of ER stress sensors – PERK, ATF6 and IRE1 – transmit ER stress signals to the nucleus and stimulate chaperone gene expression. The significant result of ER stress in KEGG pathways in women and the support of it via molecular function and biological process suggests that female depression is associated with protein folding in the cell. In addition, neurotransmitters such as dopamine and serotonin are synthesized from the ER secretory pathway. According to the information found in the study, whether the relationship between depression and ER stress is cause or effect will be the subject of further research. This study’s results corroborate those in the literature and shed light on the ways in which depression manifests differently in men and women.
KEGG pathway studies of the post-mortem brain tissue of people with depression showed that immune system genes were upregulated and aminoacyl-tRNA production genes were downregulated. The gene expressions of CXCL8 and ADAMTS1 were downregulated, while HLA-G and E2F2 were upregulated in blood tissue. Upon conducting a transcription analysis of depression, we noted that there were distinct variations in gene expression between post-mortem brain tissue and blood tissue. This could be a physiological disparity that arises after death. Depression stimulates, in both kinds of tissue, genes linked to the immune system, which is a common denominator. Overall, both sex- and tissue-specific factors contribute to the association between depression and the immune system via distinct genes.
A major strength of this study is the use of datasets on both blood and brain tissues, providing a more comprehensive understanding of the biological mechanisms underlying depression. Blood samples offer insights into systemic immune responses, while brain tissue data shed light on neurological changes directly associated with the disorder. This dual-tissue approach offers a more holistic view of depression by capturing multiple biological aspects, thus enhancing both the validity and depth of the findings. Additionally, the inclusion of both tissue types facilitated the identification of tissue-specific gene expression patterns, revealing both similarities and differences in expression. Cross-tissue comparisons further bolster the study by highlighting common pathways, such as immune system dysregulation, which may play a central role in depression. This broader understanding of shared pathways not only reinforces the findings but also supports the development of therapies targeting these core mechanisms across different biological systems.
A limitation of our study, however, is the inherent physiological differences between the types of tissue analyzed. These discrepancies, particularly between blood and brain tissues, make direct comparisons more challenging to interpret. Another limitation is that post- mortem brain tissue may not accurately reflect in vivo conditions, as the processes of death or sample collection can alter gene expression levels, introducing potential biases in the interpretation of results.
CONCLUSIONS
This study reveales that comparative transcriptomic evidence supports the immune hypothesis of depression in different tissue samples, and also shows that gender-specific depression may be triggered by protein misfolding. Ultimately, this thorough analysis enabled the identification of genes linked to depression and their link with the immune system; thus, we believed that immune system regulation can be an important factor both in preventing and treating depression. In addition, this study has shown the importance of protein folding and cellular stress in the pathophysiology of depression.


