Introduction
Down syndrome (DS), also known as trisomy 21 (T21), is the most common human chromosomal abnormality, occurring in approximately 1 in 700 live births [1]. The presence of an extra copy of chromosome 21 results in characteristic physical and cognitive features, as well as an increased risk of multiple health complications, including recurrent infections, thyroid disorders, congenital heart anomalies, and metabolic disturbances [2].
Individuals with DS exhibit excessive disturbances in oxidative balance due to overexpression of genes located on chromosome 21, which collectively contribute to increased oxidative stress (OS), defined as an imbalance between reactive oxygen species (ROS) production and antioxidant defense mechanisms, leading to cellular damage [3–5].
Overproduction of ROS can damage cellular structures, including membranes, nucleic acids, lipids, and proteins. One of the most commonly measured consequences of this damage is malondialdehyde (MDA), the principal end-product of lipid peroxidation of polyunsaturated fatty acids, which is widely used as a biomarker of OS, reflecting the magnitude of oxidative injury at the cellular level [3, 6, 7].
Obesity and subsequent metabolic disorders show higher prevalence in children and adults with DS compared to the general population. These disturbances frequently include impaired fasting glucose, diabetes mellitus, dyslipidemia, and metabolic syndrome. Defects of insulin signaling appear early in life and persist into adulthood in DS individuals, affecting both peripheral tissues and the brain. Several DS-specific factors contribute to altered body composition and fat accumulation patterns [8, 9].
Body mass index (BMI) is widely applied in epidemiological research and clinical practice to categorize overweight and obesity; however, it does not account for fat distribution. Alternative anthropometric measures such as waist circumference (WC) and waist-to-height ratio (WHtR) are stronger predictors of cardiometabolic risk. WC has been shown to better predict cardiovascular risk and mortality [10, 11] and is useful in evaluating abdominal obesity among children and adolescents aged 6–18 years [12]. Compared to BMI alone, WC and WHtR demonstrate stronger associations with diabetes risk and are better tools for identifying individuals at risk of prediabetes, serving also as more accurate markers of systemic inflammation and OS potential, particularly in individuals with short stature [13–15].
Insulin resistance (IR) is a condition in which normal insulin action is impaired, requiring higher circulating insulin levels to maintain glucose homeostasis, particularly in muscle, adipose tissue, and liver. It plays a central role in the development of type 2 diabetes mellitus and is associated with dyslipidemia, hypertension, cardiovascular disease, and other non- communicable conditions [16, 17].
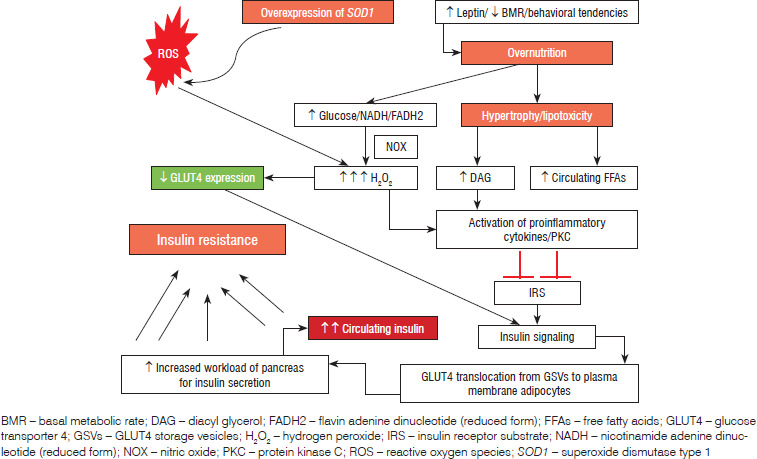
Figure 1 illustrates the proposed cellular mechanisms linking OS, adiposity, and IR, based on evidence from previous studies. In individuals with DS, overnutrition increases glucose availability, which promotes ROS generation. This effect is further amplified by the overexpression of superoxide dismutase type 1 (SOD1) on chromosome 21, leading to excessive conversion of superoxide radicals into hydrogen peroxide (H2O2). The resultant accumulation of H2O2 impairs glucose transporter type 4 expression and translocation, disrupts insulin signaling pathways, and contributes to compensatory hyperinsulinemia and IR [18, 19].
Figure 1
Schematic illustration of the pathophysiological pathways linking obesity, oxidative stress, and insulin resistance within Down syndrome. The figure was created by the authors based on data and pathways described in the literature [18, 19]
The Homeostasis Model Assessment of Insulin Resistance (HOMA-IR) index is the most popular method and serves as a validated index for assessing IR and β-cell function in clinical and epidemiological studies [17, 20].
Previous studies on DS have reported conflicting results regarding OS and IR in the DS population. Despite numerous studies examining OS and IR separately, no study has comprehensively evaluated their association in Libyan individuals with DS while accounting for age and obesity status. We hypothesized that individuals with DS would exhibit higher levels of OS (MDA) and IR (HOMA-IR) compared with a matched CG. We further expected that higher adiposity, whether BMI or WHtR, would be associated with elevated MDA and HOMA-IR, with DS participants consistently showing higher values than the CG across all subgroups.
Aim of the study
The aim of this study was to compare OS and IR between individuals with DS and a healthy CG. The study also aimed to evaluate the influence of age, overall adiposity (BMI), and central obesity on these biomarkers. Additionally, the correlation between OS and IR was examined within the DS group.
Material and methods
Study design and setting
This cross-sectional study was conducted over a three-month period (1 March to 30 May 2025) at two specialized DS centers in Al-Bayda, Libya: Al-Ishraqa School and Al-Taqaddum Center. The study was approved by the Al-Jabal Al-Akhdar Branch Committee for Bioethics, Libyan Academy for Postgraduate Studies, under the Libyan National Committee for Biosafety and Bioethics, Libyan Authority for Scientific Research (Approval No. 004.H.25.9). Written informed consent was obtained from the parents or legal guardians of all participants prior to enrollment.
Participants
Initially, 68 participants with DS were enrolled in our study; 18 (≈26%) participants were excluded due to lack of consent or underlying health conditions. The final study cohort included a total of 50 individuals with DS (28 males and 22 females) aged 5–25 years [mean ± standard deviation (SD): 14 ±5 years].
Exclusion criteria
Participants with DS were excluded if they had any of the following:
Chronic medical conditions including: congenital heart disease (n = 2, 2.9%), hypothyroidism (n = 2, 2.9%), celiac disease (n = 1, 1.5%), celiac disease with psoriasis (n = 1, 1.5%), diabetes (n = 2, 2.9%). Information on chronic medical conditions was obtained solely from existing medical files of the participating center.
Use of medications or dietary supplements.
Lack of parental or guardian consent (n = 10).
These exclusions were applied to minimize confounding in the assessment of HOMA-IR and MDA. We acknowledge that this selective sampling may reduce the generalizability of the findings, as the DS cohort may not fully represent the typical metabolic phenotype of the broader DS population. No additional laboratory investigations or physical examinations were conducted by the research team.
Comparison group
A comparison group (CG) of 58 healthy individuals (25 males, 33 females) aged 5–25 years (mean ±SD: 15 ±6 years) was recruited from the local community. The CG was age-, sex-, and BMI-matched to the DS group using group-level (frequency) matching:
Participants were stratified by sex (male/female).
They were divided into three initial age bands (5–12, 13–18, 19–25 years) to reflect the DS cohort distribution.
Within each stratum, controls were selected to approximate the median BMI of the DS participants. Due to some of the age subgroups containing very few participants, the original three age categories were re-grouped into two strata, children/adolescents < 18 years and adults ≥ 18 years, according to the definition provided by the United Nations Convention on the Rights of the Child [21].
Anthropometric measurements
Measurements were taken in a fasting state at Al-Borj laboratory (Al-Bayda). Weight (kg) was measured to the nearest 0.1 kg using a digital scale (InBody 770, InBody Co., Ltd., Seoul, South Korea). Height (cm) was measured to the nearest 0.1 cm using a digital stadiometer (InBody 770, BSM series, InBody Co., Ltd., Seoul, South Korea). WC in cm was measured at the midpoint between the lower rib margin and iliac crest using a flexible tape.
BMI was calculated as weight (kg)/height2 (m2). All participants were stratified by obesity status (normal weight, overweight, and obese). Classification followed the 2000 Centers for Disease Control and Prevention BMI criteria. For children and adolescents, BMI-for-age percentiles were used: healthy weight was defined as the 5th to < 85th percentile, overweight as the 85th to < 95th percentile, and obesity at or above the 95th percentile. For adults, normal BMI ranged from 18.5 to 24.9 kg/m2, overweight ranged from 25 to 29.9 kg/m2, and obesity ≥ 30 kg/m2 [22, 23]. For the CG, classification was performed using growth charts for typically developing children, while for the DS group, growth charts specifically developed for children with DS were used [24]. Because of small sample sizes in certain BMI subgroups, we collapsed the original three BMI categories into two groups (non-obese vs. overweight/obese) prior to analysis to ensure adequate cell counts for valid statistical testing.
To assess central obesity, the WHtR was calculated. A cut-off value of 0.5 was used to define abdominal obesity [15], where WHtR ≥ 0.5 indicated central obesity and WHtR < 0.5 indicated absence of central obesity.
Estimation of dietary intake
The average amount of carbohydrate intake among the participants was estimated using both a food frequency questionnaire and the 24-hour dietary recall method, based on the participant’s responses, mainly from starches, fruits, milk, canned juice, and desserts.
Physical activity assessment
Physical activity level was recorded using a brief questionnaire assessing daily walking duration, sedentary time, and participation in routine exercise.
Specimen collection and laboratory analysis
All participants in both groups had complete anthropometric and biochemical measurements required for the study. Venous blood samples were collected after 8–10 hours of fasting by qualified professionals. Samples were centrifuged at 3,000 rpm for 10–15 minutes. All procedures followed manufacturer protocols and safety guidelines. Fasting blood glucose (FBG) was measured using standardized enzymatic methods with a Cobas Integra 400 plus analyzer (Roche Diagnostics, Rotkreuz, Switzerland) and commercial kits (Hexokinase Glucose Reagent Kit, HK Gen.3, Roche Diagnostics). Serum insulin (SI) was measured using electrochemiluminescence immunoassay (sandwich technique) with a Cobas E 411 analyzer (Roche Diagnostics, Germany) and Elecsys Insulin Assay Kit (Roche Diagnostics). MDA was measured using a colorimetric assay with the CHEM-7 semi-automated analyzer (Erba Diagnostics, Germany) and Elabscience MDA Colorimetric Assay Kit [25].
Calculation of HOMA-IR index
The HOMA-IR was calculated using FBG and insulin concentrations. HOMA-IR values > 2.5 indicated IR [17, 20].
HOMA-IR was calculated as follows:
[glucose (mg/dl) × insulin (μU/ml)]/405.
Hyperinsulinemia was not used as a categorical variable due to the wide age range (5–25 years) and the lack of universally applicable cutoffs; HOMA-IR was considered a continuous measure to better reflect IR across age groups.
Statistical analysis
Data were coded and analyzed using SPSS version 26. Normality was assessed with the Shapiro-Wilk test. Depending on data distribution, the independent-samples t-test, Mann-Whitney U test, or χ2 test was used for group comparisons, and Pearson or Spearman correlation for associations. Continuous variables were presented as mean ±SD or median (interquartile range). A p-value < 0.05 was considered statistically significant. HOMA-IR values were log-transformed using the natural logarithm (ln) prior to linear regression analysis, as the values were not normally distributed. Multivariable linear regression analyses were performed to examine the independent contribution of predictors to IR, measured by HOMA-IR (dependent variable). Age, sex, and adiposity indicators (BMI or WHtR) were included as independent variables. A p-value < 0.05 was considered statistically significant.
Results
The study included 46.3% participants with DS and 53.7% in the CG, with 73.1% of all participants clustered within the < 18 age group. Demographic, anthropometric and physical activity characteristics of participants with DS and CG are summarized in Table I. BMI did not differ between the DS and CG (p = 0.746), and the prevalence of overweight/obesity was similar in both groups (≈65%), consistent with the BMI-matched sampling strategy.
Table I
Demographic, anthropometric, and physical activity characteristics of participants with Down syndrome (DS) and comparison group (CG)
Although the prevalence of central obesity was slightly higher in DS (60% vs. 55.2%), this difference was not statistically significant. In contrast, the median WHtR was significantly higher among individuals with DS [0.56 (0.4–0.87) vs. 0.53 (0.4–0.78), p = 0.045], indicating greater central adiposity that was not fully captured by categorical cut-off-based definitions. Additionally, a significantly higher proportion of participants with DS fell into the sedentary lifestyle category compared with the CG (58.0% vs. 8.6%, p < 0.001).
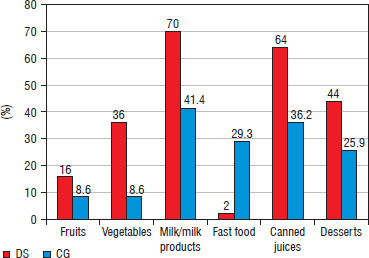
According to Table II, DS participants reported a greater number of meals per day (p < 0.001) and higher carbohydrate intake (p = 0.014), along with significantly higher consumption of vegetables (p = 0.004), milk and dairy products (p = 0.014), juices (p = 0.031), and desserts (p < 0.001), and significantly lower fast-food consumption (p < 0.001) compared to the CG, as illustrated in Figure 2.
Table II
Dietary intake summary based on 24-hour recall and food frequency questionnaire (FFQ) in participants with Down syndrome (DS) and comparison group (CG)
[i] Data are presented as mean ± standard deviation or median (interquartile range), depending on the distribution, or as number (%). Dietary intake data are summarized from FFQ. Differences in distribution of dietary frequencies were further explored using adjusted standardized residuals (ASR); values of ASR ≥ 1.96 were considered statistically significant. Bold p-values indicate statistical significance at p < 0.05.
Figure 2
Prevalence of participants consuming daily food groups among individuals with Down syndrome (DS) and the comparison group (CG). The X-axis represents the food groups and the Y-axis shows the percentage (%) of participants consuming the food daily
According to Table III, there were no statistically significant differences in IR between the DS group and CG, either in terms of prevalence (44% vs. 48.2%, p = 0.657) or median HOMA-IR values (p = 0.822). The mean MDA levels were significantly higher in the DS group (p < 0.001).
Table III
Comparison of laboratory parameters between individuals with Down syndrome (DS) and comparison group (CG)
[i] Data are presented as mean ± standard deviation or median (interquartile range), depending on the distribution, or as number (%). Bold p-value indicates statistical significance at p < 0.05. FBG – fasting blood glucose; HOMA-IR – Homeostasis Model Assessment of Insulin Resistance; MDA – malondialdehyde
According to Table IV, no significant differences in FBS, SI, or HOMA-IR were observed between age subgroups. Within DS participants, adults had significantly higher FBS than children/adolescents (p = 0.003), whereas SI and HOMA-IR did not differ significantly. Both age subgroups in DS exhibited significantly higher MDA levels compared to the CG (children/adolescents: p < 0.001; adults: p = 0.034), while differences between DS age categories were non-significant.
Table IV
Comparison of laboratory parameters in individuals with Down syndrome (DS) and comparison group (CG) based on age groups
[i] Data are presented as mean ± standard deviation or median (interquartile range), depending on the distribution, or as number (%). Bold p-values indicate statistical significance at p < 0.05. FBG – fasting blood glucose; HOMA-IR – Homeostasis Model Assessment of Insulin Resistance; MDA – malondialdehyde; NS – not significant; a comparing < 18 years vs. DS ≥ 18 years DS; b comparing < 18 years DS vs. < 18 years CG; c comparing ≥ 18 years DS vs. ≥ 18 years CG
As shown in Table V, no significant differences in FBS, SI, or HOMA-IR were observed between overweight/obese DS and overweight/obese CG individuals, or between non-obese DS vs. non-obese CG individuals. However, HOMA-IR was significantly higher in overweight/obese DS vs. non-obese DS individuals (p < 0.001), overweight/obese DS vs. overweight/obese CG individuals (p < 0.001), and non-obese DS vs. non-obese CG individuals (p = 0.029).
Table V
Comparison of laboratory parameters in individuals with Down syndrome (DS) and comparison group (CG) according to overall obesity based on body mass index categories
[i] Data are presented as mean ± standard deviation or median (interquartile range), depending on the distribution, or as number (%). Bold p-values indicate statistical significance at p < 0.05. FBG – fasting blood glucose; HOMA-IR – Homeostasis Model Assessment of Insulin Resistance; MDA – malondialdehyde; NS – not significant; a comparing overweight/obesity DS vs. non-obese DS; b comparing overweight/obesity DS vs. overweight/obesity CG; c comparing non-obese DS vs. non-obesity CG
In participants with central obesity, SI was significantly higher in DS individuals with central obesity compared to DS participants without central obesity (p < 0.001). Similarly, HOMA-IR was significantly higher in DS participants with central obesity than in those without (p < 0.001). No statistically significant differences were observed between DS participants with central obesity and the corresponding CG, with or without central obesity, as illustrated in Table VI.
Table VI
Comparison of laboratory parameters in individuals with Down syndrome (DS) and comparison group (CG) according to central obesity based on waist-to-height ratio (WHtR) categories
[i] Data are presented as mean ± standard deviation or median (interquartile range), depending on the distribution, or as number (%). Bold p-values indicate statistical significance at p < 0.05. FBG – fasting blood glucose; HOMA-IR – Homeostasis Model Assessment of Insulin Resistance; MDA – malondialdehyde; NS – not significant; a comparing DS with central obesity vs. DS without central obesity; b comparing DS with central obesity vs. CG with central obesity
According to Table VII, no significant correlation between HOMA-IR and MDA was observed in the DS group (r = 0.064, p = 0.661). Positive significant correlations were found between HOMA-IR and age, BMI, and WHtR. HOMA-IR was also positively and significantly correlated with the number of meals per day and the amount of carbohydrate consumed.
Table VII
Correlation analysis of possible predictors of Homeostasis Model Assessment of Insulin Resistance (HOMA-IR) and malondialdehyde (MDA) with some anthropometric measurements and dietary factors in individuals with Down syndrome
Multivariable linear regression analyses were conducted to examine predictors of ln(HOMA-IR) in the full sample and within the DS group. In the full sample, age, sex, and group (DS vs. CG) explained 14.7% of the variance in ln(HOMA-IR) (R2 = 0.147, p < 0.001), which increased to 42.3% (ΔR2 = 0.276, p < 0.001) after adding BMI. Within the DS group, age and sex explained 23.5% of the variance (R2 = 0.235, p < 0.01), which increased to 55% (ΔR2 = 0.315, p < 0.001) after including BMI. Using WHtR instead of BMI in the DS group, the explained variance increased from 23.5% to 43.3% (ΔR2 = 0.198, p < 0.001), showing that central adiposity also contributed independently, though to a lesser extent than BMI. In a separate analysis within the DS group, Model 1 (age, sex, and BMI) explained 40.6% of the variance in ln(HOMA-IR) (R2 = 0.406, p < 0.001), whereas Model 2 (WHtR alone) explained 40.2% (R2 = 0.402, p < 0.001). The minimal difference (ΔR2 = 0.004) indicates that general and central adiposity contribute similarly to IR in this population. Additionally, linear regression within the DS group revealed that age, sex, BMI, and WHtR collectively explained 55% (R2 = 0.550, p < 0.001) of the variance in HOMA-IR, whereas MDA alone explained 54% (R2 = 0.540, p < 0.001).
Discussion
In our dataset, MDA levels were significantly higher in individuals with DS compared with the CG. This elevation was consistent across all subgroups, indicating that OS is generally increased in DS regardless of age or adiposity category. A plausible explanation for this pattern is the T21-related overexpression of genes involved in redox imbalance, such as DYRK1A, NRIP1, SOD1, SUMO3, CBS, and S100B, which may increase ROS production while reducing the efficiency of antioxidant defenses [3, 4]. This genetically driven disruption of oxidative homeostasis provides a mechanistic basis for the elevated lipid peroxidation marker observed in our cohort.
These findings align with several previous studies that similarly reported elevated MDA levels in children [6, 26] as well as in adults with DS [27], although other investigations have noted non-significant differences in MDA [28]. Such variability may reflect differences in sample characteristics or the inherent limitations of MDA as a single biomarker of OS.
One study reported that a 12-week treadmill training program significantly decreased serum MDA and increased glutathione activity in DS participants, indicating that OS may be modifiable through improved physical activity [29]. However, a systematic review with meta-analysis concluded that there remains considerable uncertainty about the effect of exercise on OS in people with DS, due to heterogeneity in study designs, biomarkers measured, and participant characteristics [30]. Given this inconsistency, and considering the high prevalence of sedentary behavior in our DS cohort, insufficient physical activity may represent a contributing factor to the elevated MDA levels observed, but causality cannot be assumed in our cross-sectional design.
Among all 108 participants, 50 individuals (approximately 46%) had HOMA-IR values above 2.5. Elevated HOMA-IR was more common in older participants, those with higher BMI, and those with central obesity patterns consistent with mechanisms involving visceral fat accumulation, reduced adiponectin, elevated leptin, chronic OS, impaired pancreatic β-cell function, and chronic low-grade inflammation [8, 16]. These findings align with previous reports linking obesity to IR in DS [15, 20, 24, 31].
Although carbohydrate intake differed significantly between DS and CG, no corresponding differences in HOMA-IR were observed. This may reflect the stronger influence of age, BMI, and central adiposity on IR, overshadowing the effect of dietary carbohydrate at the group level. Nevertheless, correlation analyses revealed a significant association between individual carbohydrate intake and HOMA-IR, indicating that dietary carbohydrate may still modulate IR at the individual level. Measurement error or reporting inaccuracies in dietary assessment may further contribute to the lack of detectable between-group differences.
Contributing factors such as impaired leptin sensitivity, hyperphagia, mastication or gastrointestinal difficulties, and preference for sweet-tasting foods, as well as cognitive and behavioral aspects with limited nutritional education [32–34], may explain the distinct dietary tendencies in DS without necessarily producing group-level differences in IR.
This interpretation is consistent with studies reporting no significant differences in HOMA-IR or fasting insulin between BMI-matched DS and non-DS individuals [15], whereas studies without such matching have documented higher IR in obese or older DS participants [31, 32]. Together, these heterogeneous findings emphasize the central role of adiposity and age in determining metabolic risk in DS and highlight the need to account for body composition differences when comparing metabolic outcomes across studies.
No significant correlation was observed between MDA and HOMA-IR, suggesting that OS and IR may follow largely independent pathways in individuals with DS. Alternatively, MDA alone may not be sufficiently sensitive or specific to capture the oxidative mechanisms underlying IR. This contrasts with previous studies reporting significant associations between HOMA-IR and other OS markers, such as total antioxidant status, total oxidant status, and OS index [20], suggesting that the relationship between IR and OS may depend on the selected biomarker.
Multivariable linear regression analyses within the DS group indicated that both general adiposity (BMI) and central adiposity (WHtR) were significant independent determinants of HOMA-IR, with similar contributions. Age and sex also contributed to the explained variance, though to a lesser extent. Importantly, when MDA was added to the model alongside age, sex, BMI, and WHtR, it contributed minimally to explaining HOMA-IR variability (ΔR2 = 0.01), suggesting that OS, as measured by MDA, does not have an independent effect on IR in this population. These results support the notion that IR in DS is largely driven by adiposity rather than the syndrome itself.
Elevated OS in individuals with DS suggests that interventions enhancing antioxidant defenses through diet or physical activity may be beneficial [26]. A substantial proportion of participants exhibited IR, highlighting the importance of targeted obesity management and lifestyle interventions. Considering dietary habits and physical activity preferences can further help design effective interventions to improve overall quality of life [35].
Study strengths and limitations
This study minimized potential confounding by matching cases and controls for age, gender, and BMI, providing a more reliable comparison. The use of validated biomarkers, such as HOMA-IR and lipid peroxidation (MDA), along with detailed anthropometric measurements, offered useful insights into IR and OS in individuals with DS. However, several limitations should be noted. Matching was performed at the group level rather than individually, and the wide age range (5–25 years) encompasses major developmental transitions that can influence insulin sensitivity. Pubertal status (Tanner staging) was not assessed, representing an additional confounding factor. Excluding participants with common DS comorbidities (e.g., thyroid disease, celiac disease, congenital heart disease) likely produced a metabolically healthier cohort, limiting generalizability. The cross-sectional design prevents causal inference, and self-reported dietary data may be affected by recall bias. Moreover, MDA is a nonspecific marker influenced by diet, inflammation, and sample handling, and its assessment alone may not fully capture the complexity of OS pathways.
Conclusions
This study showed that IR in individuals with DS was not higher than in an age- and BMI-matched population, suggesting that DS itself does not inherently increase the risk of metabolic impairment as assessed by HOMA-IR. In contrast, MDA levels were significantly elevated in the DS group, indicating a distinct oxidative profile. However, the lack of an association between MDA and HOMA-IR suggests that OS and IR may develop through independent pathways in this population. These findings highlight the importance of further studies using a wider range of oxidative and inflammatory markers to better understand the underlying mechanisms and to identify potential targets for intervention.