
Introduction
Metabolic dysfunction-associated steatotic liver disease (MASLD), formerly known as non-alcoholic fatty liver disease (NAFLD), is one of the main causes of chronic liver disease worldwide [1]. The inflammatory form of MASLD (previously referred to as non-alcoholic steatohepatitis [NASH]), is linked with disease progression, and is now termed metabolic dysfunction-associated steatohepatitis (MASH) [2–5]. MicroRNAs (miRNAs), a set of short non-coding RNAs, were initially recognised as biomarkers for cancer [6, 7]. However, miRNAs are now regarded as powerful biomarkers for diagnosing hepatic disorders due to their critical role as epigenetic regulators and their involvement in lipid and cholesterol biosynthesis in hepatocytes [7]. Because circulating miRNAs are easily quantifiable and stable, they hold promise as clinical biomarkers [8]. Several studies have linked circulating, cell-free miRNAs with the progression of MASLD [9, 10]. Some researchers have demonstrated the association of miR-182-5p with MASLD, but the results are contradictory. For instance, Liang et al. verified that miR-182-5p could treat NASH via targeting TLR4 [11]; however, Compagnoni et al. reported upregulation of miR-182-5p in NAFLD with downregulation of Cyld and Foxo1 expression levels [12]. miR-127 has been linked to many liver diseases, but its role in MASLD progression has not been studied yet [13, 14].
Aim
This research was designed to check the significance of miR-182-5p and miR-127-5p as diagnostic markers for MASLD, assess their correlation with insulin resistance, and investigate their expression levels in relation to different clinical and laboratory data.
Material and methods
This study included 110 individuals divided into two groups: (1) a study group of 60 MASLD patients. The diagnosis of MASLD was based on the criteria mentioned by Rinella et al. [15]. Fibroscan was performed to confirm the diagnosis of MASLD. HOMA-IR was calculated according to the formula: fasting glucose [mmol/l] × fasting insulin [mIU/l]/22.5. (2) A control group consisted of 50 healthy adults, matched for age and sex, who attended the outpatient clinic as controls. The MASLD patients were recruited from the Department of Internal Medicine at Fayoum University Hospital, Fayoum.
Patients with any other liver diseases such as acute liver disease, viral hepatitis, liver failure, etc. were excluded from the study. Furthermore, patients with autoimmune or immunodeficiency disorders, as well as those with renal failure, heart failure, or malignancy, were also excluded. Additionally, individuals under 18 years of age were not included. The study received ethical approval from the Fayoum University Supreme Committee for Scientific Research Ethics (FU-SCSRE) after the study’s purpose was explained (code no. EC2381), in compliance with the Declaration of Helsinki.
Sample preparation
Using the vacutainer technique, 3 ml of peripheral venous blood was drawn from each individual. The samples were collected (in tubes containing separating gel) and then centrifuged for 10 min at 4000 rpm (after being allowed to clot for 15 min). The separated sera were stored at –80°C until analysis.
Isolation of miRNAs
miRNAs were isolated from serum samples with the use of the miRNeasy Mini Kit (Qiagen, Hilden, Germany). The amount and purity of RNA were determined using a NanoDrop ND-1000 spectrophotometer (NanoDrop Technologies, Inc., Wilmington, USA). Using the RT Kit (MiRCURY LNA, catalogue no. 339340, Qiagen, Maryland, USA), cDNA was produced from total RNA in a reaction with a final volume of 10 µl at room temperature.
Detection of miR-182-5p and miR-127-5p
Real-time PCR was performed using the miRCURY LNA miRNA PCR assays and miRCURY LNA SYBR Green Master Mix (Qiagen, Maryland, USA) on the PikoReal 24™ Real-Time PCR System (Thermo Scientific, Finland). The PCR cycling conditions were as follows: 40 cycles of denaturation at 95°C for 10 s, followed by combined annealing/extension at 56°C for 60 s, with an initial heat activation at 95°C for 2 min. Melting curve analysis (between 60°C and 95°C) was used to assess the specificity of the products that were amplified. Regarding the internal reference that was used in our study to evaluate the serum expression levels of miR-127-5p and miR-182-5p, miR-16-5p was measured [16, 17]. For miR-127-5p, miR-182-5p, and miR-16-5p, previously established primers were utilised (miR-127-5p: catalogue no. YP00204161, lot no. 201706010149-1; miR-182-5p: catalogue no. YP00206070, lot no. 201803060144-2; miR-16-5p: catalogue no. YP00205702, lot no. 201910040131-3).
Statistical analysis
Statistical Package for Social Sciences (SPSS) was used to evaluate the results. Quantitative data were analysed using mean and standard deviation (SD) or the median and interquartile range (IQR). The c2 test was conducted to assess qualitative data, which are presented as numbers and percentages. The Shapiro-Wilk test and Kolmogorov-Smirnov test were used to assess normal distribution of variables. A receiver operating characteristic (ROC) curve was generated to determine the cut-off point, sensitivity, and specificity of miR-182-5p and miR-127-5p as biomarkers for MASLD. Spearman’s correlation was used to calculate the relationship between miR-182-5p and miR-127-5p with insulin resistance and various laboratory parameters. A significance level of p > 0.05 was adopted.
The fold change (FC) or 2–DDCT method was used to assess gene expression. The following mathematical procedures were used to assume that the control value was equal to 1.
1) The DCT between the gene of interest and the average of reference genes was computed to determine the DCT of controls. 2) The average DCT for the controls was determined. 3) DCT between the gene of interest and an average of reference genes were calculated for each patient. 4) DDCT was assessed [DCT (patient) – average DCT of control]. 5) 2−∆∆CT for relative quantification was calculated.
Since -DDCt for control participants equals zero, it was presumed that the control value was equal to 1 because 2° = 1. miRNA expression is considered overexpressed if the FC is greater than 1 and underexpressed if it is less than 1 [18].
Results
Clinical and demographic data
Table I presents comprehensive clinical and demographic information for 60 MASLD cases and 50 healthy controls.
Table I
Demographic and clinical characteristics among study groups
[i] Data are expressed as median (IQR), mean ± SD, or n (%). AST – aspartate transaminase, ALT – alanine transaminase, gGT – g-glutamyl transferase, HOMA IR – Homeostatic Model Assessment for Insulin Resistance, HbA1c – glycated haemoglobin, HDL – high-density lipoprotein; LDL – low-density lipoprotein, VLDL – very low-density lipoprotein, T.ch – total cholesterol, TSH – thyroid-stimulating hormone, FT3 – free thyroxine 3, FT4 – free thyroxine 4, LSFT – midline abdominal subcutaneous fat thickness in front of the liver, USFT – paraumbilical abdominal subcutaneous fat thickness, PV – portal vein; F – fibrosis score, CAP – controlled attenuation parameter.
Serum expression levels of miR-182-5p and miR-127-5p in the study groups
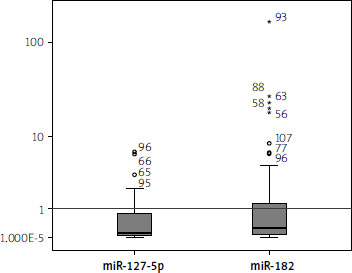
The serum expression levels of miR-182-5p were downregulated, showing a median fold change (interquartile range) of 0.01 (0.002–0.047, p < 0.001). Similarly, the levels of miR-127-5p were significantly downregulated, with a median fold change (interquartile range) of 0.106 (0.05–0.84, p < 0.001). The control fold-change values for miR-182-5p and miR-127-5p are represented by the horizontal line (set as 1) in Figure 1.
Correlation of serum levels of miR-182-5p and miR-127-5p with clinical features of MASLD patients
Table II shows a significant negative correlation between miR-182-5p and HOMA IR (r = –0.304; p = 0.022) (Figure 2). Additionally, a significant negative correlation was found between miR-127-5p and HOMA IR (r = –0.299; p = 0.028) (Figure 3). miR-127-5p showed a significant positive correlation with TSH (r = 0.340; p = 0.012) and triglycerides (r = 0.347; p = 0.012).
Figure 2
Spearman analysis revealed a negative correlation between miR-127-5p and HOMA-IR (r = –0.299; p = 0.028)
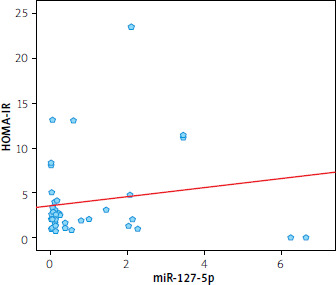
Figure 3
Spearman analysis revealed a negative correlation between miR-182-5p and HOMA-IR (r = –0.304; p = 0.022)
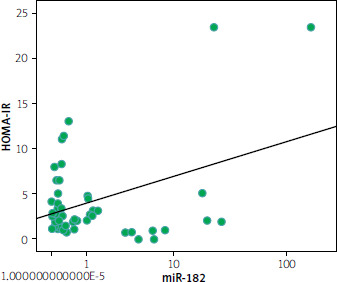
Table II
Correlations between miR-127-5p, miR-182-5p, and demographic and clinical variables in the MASLD group
* Significant p < 0.05. AST – aspartate transaminase, ALT – alanine transaminase, gGT – g-glutamyl transferase, HOMA IR – Homeostatic Model Assessment for Insulin Resistance, HbA1c – glycated haemyoglobin, HDL – high-density lipoprotein; LDL – low-density lipoprotein, VLDL – very low-density lipoprotein, T.ch – total cholesterol; TSH – thyroid-stimulating hormone, FT3 – free thyroxine 3, FT4 – free thyroxine 4.
Correlations between miR-182-5p and miR-127-5p, and abdominal ultrasound as well as FibroScan data among the MASLD group
A significant positive correlation was observed between the expression level of miR-182-5p and portal vein diameter (r = 0.367; p = 0.004) (Tables III and IV).
Table III
Correlations between miR-127-5p, miR-182-5p, and abdominal ultrasound data in the MASLD group
Analysis of the receiver operating characteristic curves (ROC)
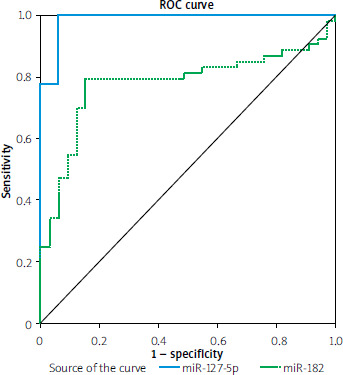
The accuracy of miR-182-5p and miR-127-5p serum levels serving as predictive biomarkers for MASLD was assessed by creating ROC curves, as shown in Table V and Figure 4.
Figure 4
ROC curve for miR-127-5p and miR- 182-5p, distinguishing MASLD patients from the control group
Discussion
As MASLD rapidly emerges as a global health concern, there is a growing need for improved diagnostic and prognostic techniques, as well as effective pharmacotherapies to address one of its most serious complications – MASH. The molecular pathways implicated in the onset and development of MASLD remain unclear and require further investigation [19, 20].
MicroRNAs (miRNAs), also known as non-coding short RNAs, consist of 17–25 nucleotides [21, 22]. These microRNAs have been implicated in the development of MASLD [23]. Hepatic miRNA expression was found to vary according to the stage of MASLD (early, intermediate, and late), with particular miRNA species being important in the development of steatosis and the advancement of MASLD to MASH, cirrhosis, and hepatocellular carcinoma (HCC) [24].
This research was designed to determine the serum levels of miR-182-5p and miR-127-5p as potential diagnostic markers for MASLD, their correlation with insulin resistance, and their relationship with different laboratory and clinical parameters.
In the present work, we found significant reduced serum levels of miR-127-5p. These findings align with an earlier study, which reported that miR-127 was markedly reduced in the livers of rats given a diet low in methyl, compared to control rats. This downregulation led to the upregulation of B-cell lymphoma 6 protein (BCL6), impacting liver fibrogenesis and apoptosis [25]. Similarly, Pan et al. suggested that the downregulation of miR-127 may help proliferation of liver cells by regulating BCL6 during liver regeneration [14]. Notably, BCL6 is also implicated in MASLD progression through its influence on b-oxidation and the accumulation of liver fats [26–28].
Additionally, a prior investigation revealed that miR-127-5p was commonly decreased in HCC tissues, promoting tumour growth [13].
It was also observed that miR-127-5p targets nuclear factor-kB (NF-kB), which is elevated in HCC [13]. Given that NF-kB activation is essential for progression of MASLD [29], this may explain the lower serum levels of miR-127-5p observed in our results. Our findings are further verified by Zhou Lu et al., who confirmed that miR-127 was reduced in HCC tissues compared to healthy tissue, suggesting that miR-127 may inhibit HCC proliferation [30].
Similarly, earlier research revealed decreased miR-127 expression in human HCC specimens, which promoted HCC migration via the upregulation of matrix metalloproteinase 13 (MMP13), a factor also implicated in the progression of MASLD [31, 32].
According to our results, we observed that MASLD patients exhibited downregulated serum expression levels of miR-182-5p. Notably, Liang et al. observed that the onset of NASH is linked to decreased levels of miR-182-5p, which targets Toll-like receptor 4 (TLR4) [11].
Consistent with our findings, significantly downregulated miR-182 was identified in the liver tissues of MASLD rats compared to controls, affecting metabolic processes related to insulin secretion [33]. We also found statistically significant negative correlations between both miR-127-5p and miR-182-5p and HOMA-IR, signifying an association between these microRNAs and insulin resistance – one of the key hallmarks of MASLD.
Previous studies have shown that repression of BCL6 (a target of miR-127) improves insulin sensitivity in the fed state [25, 27]. Similarly, Chikada et al. showed that BCL6 deletion in adipocytes reduces steatosis and enhances insulin sensitivity [28].
Additionally, NF-kB, another target of miR-127, has been documented to be important in the pathogenesis of insulin resistance and may be therapeutically targeted to improve insulin sensitivity [13, 34].
Given this background, we can explain the observed correlations in our results. Regarding miR-182, our findings align with previous reports, which verified that the downregulation of miR-182 is strongly linked to insulin resistance [35, 36]. Interestingly, miR-182 has been described to target sterol regulatory element-binding protein (SREBP) in insulin-responsive tissues compared to controls [37]. Interestingly, insulin resistance pathogenesis was proved to be associated with SREBP [38].
Our results exhibited a significant positive correlation between miR-127-5p and serum levels of triglycerides and TSH. However, no previous studies have reported these correlations; thus, we recommend further research to explore and explain these findings.
Conclusions
miR-127-5p and miR-182-5p were significantly downregulated in MASLD patients. These findings suggest (but also require further investigation in the clinical setting) that both miR-127-5p and miR-182-5p could function as valuable biomarkers for MASLD diagnosis and treatment. Additionally, a negative correlation was noticed between HOMA-IR and the expression of both miR-127-5p and miR-182-5p.
Some limitations regarding the current study should be addressed and they include the following:
1) Relatively small sample size. 2) The molecular pathways of miR-127-5p and miR-182-5p in MASLD are still unclear. 3) The association of miR-127-5p and miR-182-5p with various clinical and laboratory data is not explained.
Additional studies with larger sample sizes are recommended to confirm our results and to search in depth the molecular pathways involving miR-127-5p and miR-182-5p in MASLD. Moreover, the negative correlations between miR-127-5p as well as miR-182-5p and HOMA-IR were weak, so further studies with large sample sizes are necessary to confirm these correlations.