
Introduction
E-cadherin is a type I classical cadherin, which mediates calcium-dependent cell-cell adhesion and regulates multiple cellular functions like proliferation, differentiation, migration, and polarity [1]. In colonic mucosa E-cadherin is expressed on the basolateral aspects of the cell membrane, in all crypt and surface epithelial cells, establishing in this way mucosal integrity. The abnormal expression and function of cadherins is associated with tumourigenesis, in particular the expression of epithelial (E)-cadherin is reported to be reduced or lost in malignant cells. Colorectal cancer (CRC), a lethal and common type of cancer, is mainly comprised of adenocarcinomas. In many cases it is asymptomatic, and the survival of the patient depends on the time of diagnosis and the stage of tumour. The asymptomatic nature of colorectal cancer makes early diagnosis of this cancer difficult. In this context, the expression of E-cadherin as a biomarker to predict CRC progression is still in progress [2]. Besides reduced or absent E-cadherin expression, the redistribution pattern of E-cadherin from membrane to cytoplasm is also indicative of a more poorly differentiated form of CRC, which thereby facilitates tumour cell invasion and metastasis [1]. Multiple clinicopathological studies have associated E-cadherin with colorectal cancer. All these studies have linked reduced E-cadherin expression with loss of differentiation in colorectal cancer [3].
A lower 5-year survival rate in stage II CRC patients with reduced expression of E-cadherin was observed [4]. Furthermore, using small interfering RNA (siRNA)-mediated inhibition of E-cadherin expression, increased growth and metastatic invasion of colorectal cancer cells was noted [5]. The expression level of E-cadherin along with other molecules like β-catenin [6] and many more have been consistently used to predict the prognosis and outcome in CRC patients. Despite advances in use of E-cadherin expression in colorectal cancer, its use as a prognostic marker has been inconclusive, in particular in European populations [7]. In India both colon and rectal cancer are prevalent; among the most common cancers in males, colon cancer ranks 8th followed by rectal cancer, whereas among females colon cancer ranks 9th, and lower incidences of rectal cancer are observed in females [8]. Very few Indian studies have explored the prognostic implication of immunohistochemical analysis of E-cadherin in Indian colorectal cancer population.
Aim
The main objective of this study was to evaluate the role of E-cadherin as a prognostic marker by analysing its intensity of expression in colorectal carcinomas.
Material and methods
Patients and tumour samples
In this retrospective study, paraffin blocks of 100 colon cancer specimens were obtained from the pathology department of the Tertiary Care hospital in South India between January 2013 and January 2016. The demographic details included age and gender, and pathological details included grade of tumour, stage of tumour, site of cancer, tumour invasion, and metastasis. Before commencing the present study, permission of the institutional ethics committee (Reference no: CSP-MED/14/OCT/19/199) was obtained.
Immunohistochemical (IHC) staining
Preparation of slides
The obtained paraffin blocks were made on samples from tumour areas along with adjacent normal tissue from colectomy specimens received in the department. The sections were deparaffinised with xylene for 5 min and then treated twice with absolute alcohol for 1 min each and finally rinsed with water. The staining was performed using Harris Haematoxylin for 5 min, and excess stain was washed off with water twice. The section was then stained in 1% aqueous Eosin Y for 2 min and then washed in running tap water for 1 min. The stained slide was dehydrated by making 3 changes of absolute alcohol. The slides were then rinsed with xylene twice and were mounted with DPX. IHC for E-Cadherin was done on the sections along with internal control, which is the normal colonic epithelium.
E-cadherin staining
For the E-cadherin staining, the prepared unstained sections were placed on the 0.1 Poly-L-lysine coated slides. The sections were circled and labelled with a diamond pencil. The sections were then placed in a slide warmer at 60°C for 30 min. The slides were then transferred to xylene (2 baths) for 5 min each and then placed in absolute alcohol twice. The slides were then rinsed in running water and placed in 0.01 M citrate buffer pH 6.0 for pressure cooker heating. The pressure cooker was set at an operating pressure of 103/115 kPa to ensure 120°C temperature at full pressure. The sections were then retrieved using a target retrieval buffer at room temperature for 15–20 min in the pressure cooker. The solution was boiled and immediately cooled by placing the pressure cooker in cold running water. The slides were transferred to Tris buffer solution (Tris hydroxyl methyl amino methane), and the endogenous peroxidase activity was blocked by using 3% hydrogen peroxide. The slides were then rinsed in distilled water for 5 min. Again, the slides were rinsed in Tris buffer solution, and power block was added for 10 min. The slides were then incubated with primary antibody (E-cadherin, EP700Y, rAb; Cell Marque) for 1 h. The slides were then rinsed in Tris buffer solution and incubated with super enhancer. Again, the slides were rinsed in Tris buffer solution. The slides were then incubated with Horseradish Peroxidase (HRP)-polymer and then again rinsed in Tris buffer solution. The excess buffer was then wiped off, and the slides were incubated with substrate/chromogen for 5 min. The slides were then rinsed in distilled water and counter-stained with Haematoxylin for 3 min. Finally, the slides were dehydrated and mounted.
Evaluation (scoring) of E-cadherin staining
The intensity of E-cadherin was read semi-quantitatively based on the immunostaining intensity and the percentage of E-cadherin-positive cells. Based on the Allred scoring system, 4 categories of staining (0, 1, 2, and 3) ranging from none (negative) to strong were used. Zero (0) referred to negative/none with zero positive cells, 1 – weak with < 1 positive cell, 2 – intermediate with 1–10 positive cells, and 3 – strong with 11–33 positive cells.
Ethics statement
All procedures performed in this study were approved by the Institutional Ethics Committee (IEC), (CSP-MED/14/OCT/19/199) in accordance with the ICMR guidelines on Biomedical Research in Human beings. Formal written informed consent was waived by the IEC.
Statistical analysis
For all the statistical analysis Statistical Package for the Social Sciences (SPSS) 24.0v software was used. The clinical profile data were presented as a frequency distribution. χ2 tests were used to analyse the expression and association of E-cadherin with the clinical and pathological features of the CRC patients. A p-value less than 0.05 was considered statistically significant.
Results
In this study, a total of 100 patients diagnosed with CRC were included. The clinical profile including demographic and histopathological details of CRC are presented in Table I. The majority of patients belonged to the age group 41–60 years (45%), and CRC was more predominant in males (58%). The most common site of the tumour was the colon (62%) as compared to the rectum (38%), and the histological type was adenocarcinoma including mucinous type with a size range of 5–10 cm (55%). The majority of the tumours were moderately differentiated (74%), followed by poorly differentiated in 13%. The extent of invasion of the tumour up to the muscularis propria (pT2) was noted in 42% of samples, and into the peri colorectal tissues in 42% (pT3). Lymphovascular invasion (LVI) was observed in 30% of patient samples. Furthermore, in 27% of samples CRC was found in more than one lymph node (N1), whereas in 13% of samples more than 4 lymph nodes were involved (N2). With respect to metastasis, many samples showed that the cancer had not spread to distant parts of the body (95%). Other clinical features like perineural invasion (15%), involvement of radial margin (6%), and tumour deposit (5%) had lower frequency.
Table I
Patients and their tumour characteristics
Association of E-cadherin expression with clinicopathological parameters
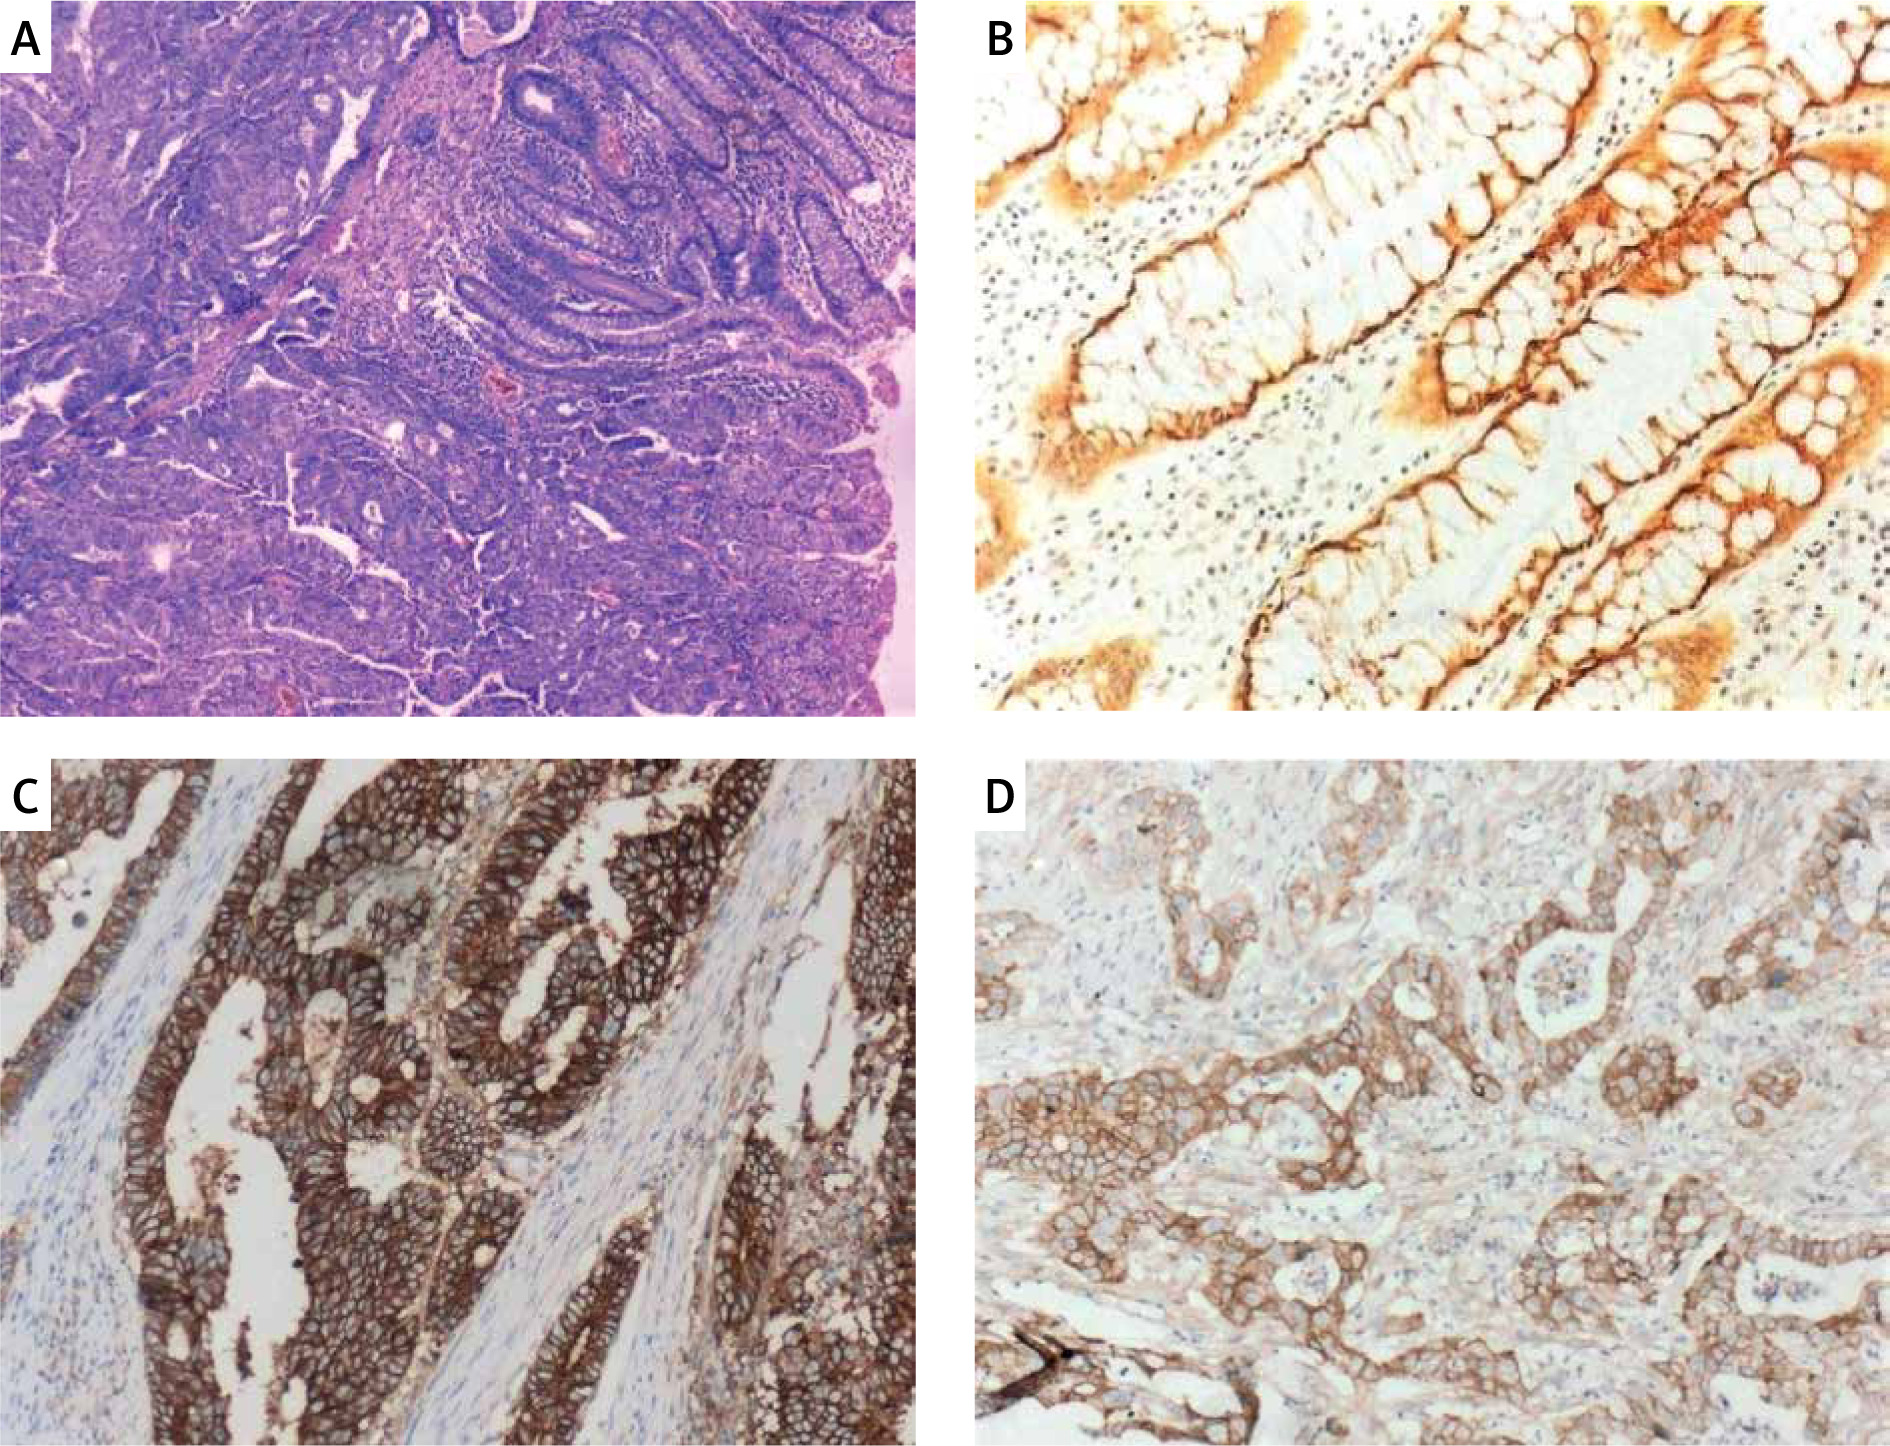
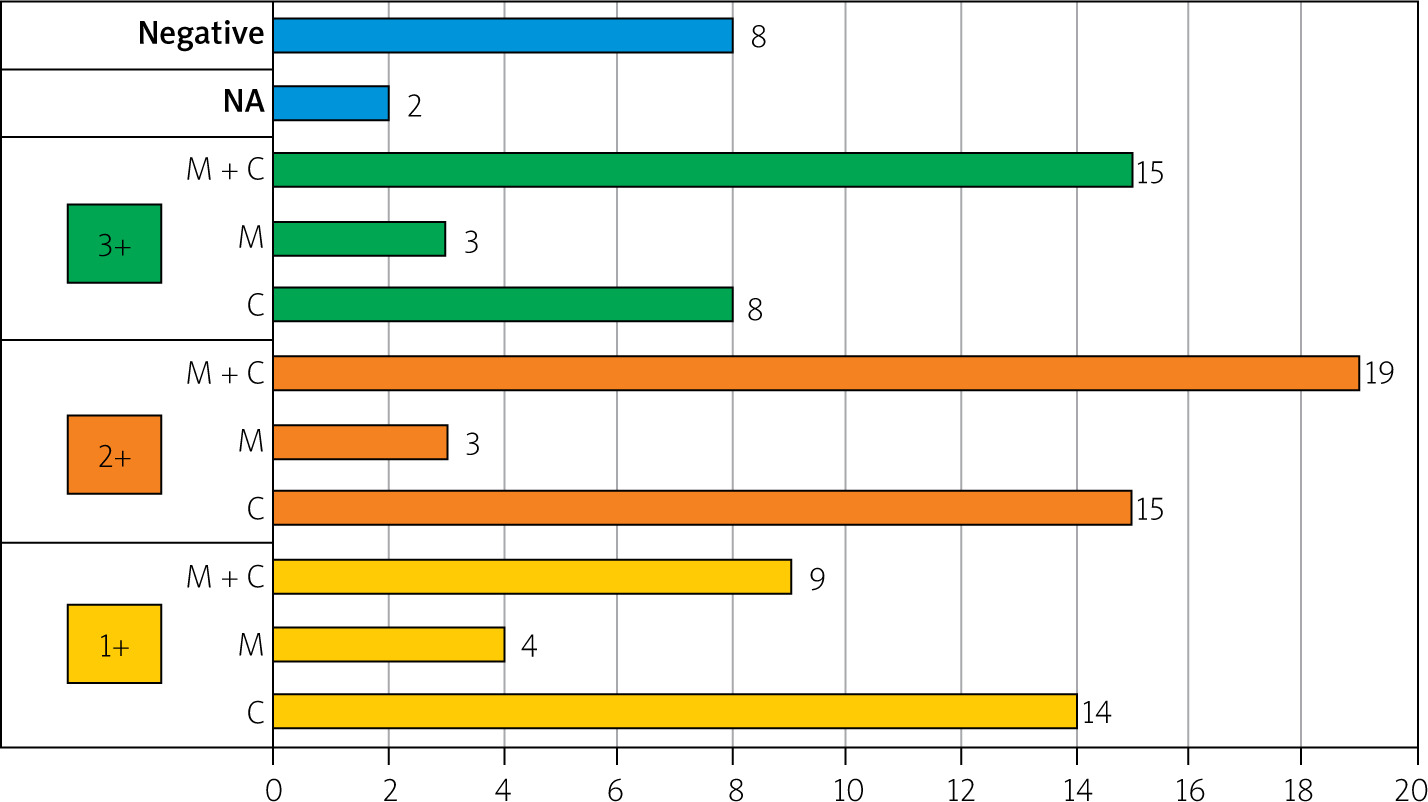
Table II exemplifies the association of E-cadherin staining with clinical as well as pathological parameters of colorectal cancer patients. An insignificant association (p > 0.05) was observed between E-cadherin expression and parameters such as age (χ2 = 4.620), gender (χ2 = 4.690), and size of tumour (χ2 = 3.393). Additionally, E-cadherin expression showed statistically insignificant correlation with sites of cancer (χ2 = 5.539, p > 0.05) and tumour invasion (T-status) (χ2 = 6.793). The correlation of E-cadherin expression with lymph node involvement was statistically significant, as revealed by a χ2 value of 22.82 (p < 0.01). About 54% samples showed no lymph node invasion. Lymph node involvement of N1 type with invasion of 1–3 lymph nodes was found in 27% of samples, and about 13% samples had lymph node invasion in more than 4 nodes (N2). The association between E-cadherin expression and distant organ metastasis was insignificant (χ2 = 4.196, p > 0.05). In the majority of samples (95%) there was no distant organ metastasis, and 2 samples showing metastasis revealed weak to intermediate E-cadherin staining. However, E-cadherin expression was significantly correlated with tumour differentiation pattern (χ2 = 17.131, p < 0.01). Larger numbers of samples were moderately differentiated (n = 74%). Out of 13 poorly differentiated carcinomas, 5 had no E-cadherin staining and 4 had a weak staining. In normal cells, membranous staining of E-cadherin was found in 83% of samples. Figure 1 depicts the representative samples of E-cadherin immunostaining. In carcinoma cells, the association between E-cadherin expression intensity and IHC expression pattern was found to be significant (χ2 = 104.32, p < 0.01). Mixed E-cadherin expression (membrane and cytoplasmic) (n = 43%) was the predominant one followed by cytoplasmic E-cadherin expression (37%), suggestive of the presence of a tumour (Figure 2).
Table II
Correlation between E-cadherin expression and clinic-pathological parameters
Discussion
Among many biomarkers, E-cadherin expression is associated with tumour progression [2]. In general, the loss or heterogeneous expression of E-cadherin is related to advanced stages of colorectal cancer, progression and differentiation, metastasis, and poor outcomes like low survival, thereby making it an important clinicopathological marker [9].
In the present study, the E-cadherin expression did not correlate with the age and gender of patients. Similarly, with respect to tumour characteristics, negative E-cadherin expression was not correlated to size, site, or grade of tumour. In the literature, the correlation of E-cadherin expression with age, gender, and tumour size is inconsistent. The present findings agree with observations reported by Khoursheed et al. [10], but they contrast with another study wherein the author found significant association between E-cadherin membrane expression and the age factor of the colon carcinoma patients [6]. The link between E-cadherin expression and tumour invasion was not observed in this study, in contrast to the observations of Hong et al. [11], who showed an inverse correlation between E-cadherin and depth of tumour invasion, indicating decreased E-cadherin expression with increased depth of tumour invasion, and this was related to higher Slug expression, which was responsible for the inhibition of E-cadherin expression [11].
Higher or positive expression of E-cadherin in epithelial cells of well-differentiated tumours as well as moderately differentiated CRC has been observed by many researchers [10, 12]. Low E-cadherin expression is linked to poor survival outcomes. A similar line of inference can be drawn from our results also, wherein negative to weak E-cadherin expression was found in poorly differentiated colon carcinoma cells, indicating that loss of expression of E-cadherin protein can result in poorly differentiated tumours, as observed in other cancers such as non-small cell carcinoma of the lung and carcinoma of the rectum [13, 14]. Using a multiple-punch tissue microarray, it was shown that among 21 tumour-related factors, E-cadherin was independently regarded as a predictor of lymph node (N) stage in CRC, indicative of its expression in risk stratification of patients with colorectal cancer [15]. A mixed (membrane and cytoplasm) E-cadherin expression pattern in CRC with metastatic lymph nodes agreed with the present observation [16].
In normal colorectal epithelial cells, E-cadherin expression is predominantly distributed in membranes of borders of cells. A poor survival rate is predicted in CRC patients with increased cytoplasmic E-cadherin expression, which suggests cytoplasmic expression of E-cadherin as a prognostic factor for colorectal cancer [17]. Likewise, according to Elzagheid et al., cytoplasmic expression of E-cadherin in primary colorectal tumour reduces the chances of survival, and mixed staining (membrane and cytoplasmic) of E-cadherin was observed in patients who later developed metastases in the liver [18]. This could be indicative of slow progressive metastasis of colorectal cancer. In concordance with our findings, a similar observation on loss of normal membranous expression and the presence of cytoplasmic and mixed staining in tumour tissues was made by Khoursheed et al. [10]. Loss of E-cadherin expression can induce an epithelial-to-mesenchymal transition and result in tumour invasiveness. In general, lower expression of E-cadherin is found in metastasized CRC, which could be due to Snail2-mediated epigenetic suppression of E-cadherin levels during metastasis [19]. According to a meta-analytic review of 27 studies, in the Asian population low or absent E-cadherin expression detection by IHC was observed in metastatic tumours [7]. In the present study, because there were few samples with distant metastasis, little could be extrapolated on E-cadherin expression during metastasis; however, El Gehani et al. observed no link between E-cadherin expression and distant metastasis, which is in agreement with the findings of this study [20]. Early screening of changes in the colon is key in reducing malignancy and mortality in colorectal cancer patients. In this regard, minimally invasive colonoscopy is the gold standard technique; however, non-invasive and low-cost faecal screening tests like the immunochemical Faecal Occult Blood Test (iFOBT) and the guaiac faecal occult blood test (gFOBT) are recommended every year for the earliest screening of colorectal cancer [21].
The present study provides an insight into the use of IHC of E-cadherin expression in tumour cells as a prognostic marker. However, the data from this study have limitations. The small sample size of 100 patients, and all being from a single centre could limit the generalization of findings. Furthermore, the expression of E-cadherin binding partner β-catenin was not tested. Also, the probable disruption in the signalling pathway due to E-cadherin loss was not explored. Therefore, a large and prospective study will further strengthen the findings of this study.
Conclusions
This study was performed to analyse the utility of IHC expression of E-cadherin as a prognostic marker in the detection of colorectal cancer. A reduction in E-cadherin expression was found in samples with colorectal cancer, and it was predominant in poorly differentiated cells. A shift from membranous staining of E-cadherin in normal cells to cytoplasmic or mixed membrane and cytoplasmic staining in cancer cells was observed. The low/weak E-cadherin expression indicated invasiveness of CRC to regional lymph nodes and the progressive nature of colorectal cancer, thereby supporting the use of E-cadherin as a prognostic biomarker for colorectal carcinomas.