Introduction
Adropin is a 76-amino acid peptide hormone expressed in many tissues and cells, primarily in the liver and brain, as well as the pancreas, heart, and vascular tissues [1, 2]. It is encoded by the Energy homeostasis associated (ENHO) gene and plays an essential role in energy homeostasis [1, 2]. Adropin exerts its biological effects through the G protein-coupled receptor 19 as a secreted factor but also acts as a plasma membrane protein with autocrine and paracrine effects in the brain [3, 4].
Adropin has been associated with glucose, insulin, and lipid metabolism in adult and paediatric populations [1, 5–9]. Several studies in children and adolescents have shown that adropin levels are decreased in obesity and may be linked to adverse cardiometabolic risk factors such as hypertension and dyslipidaemia [5, 6]. In addition, adropin has been associated with nonalcoholic fatty liver disease in paediatric patients, suggesting a broader role in metabolic dysfunction [7, 9]. Exercise interventions have been reported to increase adropin levels and improve endothelial function, independent of weight loss [8].
In obese adolescents, an inverse relationship was found between adropin levels and diastolic blood pressure, while no relationship was observed between adropin levels and systolic blood pressure [10]. However, findings are not entirely consistent across studies.
Some studies have reported lower adropin levels in obese individuals [5, 8], whereas others have found higher levels [6]. Kocaoglu et al. [7] reported no association between plasma adropin levels and obesity, metabolic syndrome, or insulin resistance in normal-weight or in obese children. Sayın et al. [9] investigated obesity-related comorbidities and demonstrated that serum adropin levels were lower in obese adolescents with fatty liver disease compared to obese adolescents without fatty liver disease and normal-weight controls. In contrast, Bays et al. [11] showed that serum adropin levels did not differ between adolescents with metabolic dysfunction-associated steatotic liver disease and those without the condition (both obese and normal-weight), as confirmed by histological examination.
In a study evaluating adropin levels in children according to pubertal status, Herrero et al. [12] found that plasma adropin levels were significantly higher in prepubertal children than in pubertal children. They also reported that adropin levels were higher in girls during the prepubertal period and in boys during puberty. Furthermore, obese children had higher adropin levels compared to their normal-weight peers during the prepubertal period; however, no significant differences were observed between obese and normal-weight girls or boys during puberty [12].
The protective effects of adropin extend to preventing endothelial damage, promoting angiogenesis, and alleviating inflammation [13].
These discrepancies highlight the complexity of adropin physiology and suggest that its role may vary depending on the population and underlying metabolic status.
The relationship between adropin and other factors, such as age, sex, body mass index (BMI), and puberty, in children is still debated. Taking these points into consideration, we examined the linear relationship of all these factors in both the obese and healthy control groups.
Material and methods
Subjects
Our case-control study was conducted cross-sectionally on patients admitted to the paediatrics and paediatric endocrinology outpatient clinics between March 2024 and September 2024.
Patients’ weight, height, and BMI values were recorded. Age- and sex-specific reference ranges and standard deviation scores (SDSs) of these parameters were determined. These values were analysed with an online calculation program (www.childmetrics.org) [14]. These children were divided into two groups as “obese” – BMI SDS above 2 standard deviation (SD) and “non-obese” – BMI SDS between –1 and +1 SD according to Centers for Disease Control and Prevention age and sex-specific BMI references.
Weight and height were measured using devices with a sensitivity of approximately 0.1 kg and 0.1 cm. BMI was calculated as weight divided by height squared (kg/m2). The definition of obesity was based on BMI being above the 95th percentile [15]. Puberty stage was graded from Tanner 1 to Tanner 5 according to the Marshall and Tanner method [16, 17]. The study group consisted of children under 18 years of age. Participants were divided into two groups: obese and healthy controls. A second evaluation was performed in the obese group following a dietary intervention. Compliance with the diet was assessed based on weight loss or gain. None of the obese children were engaged in regular sports activities beyond their routine daily activities.
Patients with secondary endocrine disorders (such as diabetes mellitus, hypothyroidism, Cushing syndrome, or familial hyperlipidaemia), as well as those diagnosed with hypertension or chronic liver disease, were excluded. In addition, patients receiving medications such as corticosteroids were not included. Individuals with intellectual disability, a history of brain trauma, or central nervous system-related hearing or visual impairment were also excluded from the study. The control group consisted of age-matched healthy children who were admitted to the paediatric outpatient clinic for routine health evaluation or minor non-endocrine complaints.
Laboratory measurements
All biochemical assessments were performed on venous blood samples obtained following an overnight fasting period of approximately 8–10 hours. After collection, the samples from both the case and control groups were placed in tubes containing protease inhibitor (aprotinin) and kept in a vertical position for about 30 minutes to allow clot formation. They were then centrifuged at 4500 rpm for 7 minutes at a temperature of +4°C. The separated serum was portioned into aliquots and stored at –80°C until further analysis.
Measured parameters included serum glucose, insulin, glycated haemoglobin (HbA1c), total cholesterol, triglycerides, low-density lipoprotein cholesterol, high-density lipoprotein cholesterol, aspartate aminotransferase, alanine aminotransferase (ALT), adrenocorticotropic hormone, and cortisol. Analyses were conducted using Beckman Coulter AU 5800 and DXI 800 analysers (Beckman Coulter, CA, USA). HbA1c concentrations [%] were determined by high-performance liquid chromatography (Lifo- tronic H9, Lifotrophic Technology, Shenzhen, China).
Insulin resistance was estimated via the Homeostasis Model Assessment of Insulin Resistance index, calculated using the formula: fasting insulin × fasting glucose / 22.5 [18].
For adropin measurement, serum obtained from whole blood was analysed by enzyme-linked immunosorbent assay using a Human Adropin ELISA Kit (BT LAB, Cat. No. E3231Hu, China) according to the supplier’s protocol. The assay had a detection range of 5–1000 ng/l, with a sensitivity of 2.49 ng/l. The intra-assay and inter-assay coefficients of variation were below 5% and 10%, respectively. In summary, standards and serum samples were loaded into wells pre-coated with antibodies specific for human adropin. The captured adropin was bound to biotinylated adropin antibodies, followed by streptavidin–horseradish peroxidase conjugation. After washing away excess reagent, a substrate solution was added, leading to a colorimetric change proportional to adropin concentration. The reaction was stopped with an acidic solution, and absorbance was read at 450 nm. Concentrations were derived from the standard curve.
Statistical analysis
Data were analysed using SPSS version 24.0 (IBM Corporation, Armonk, NY, USA). Continuous variables were reported as mean ± SD with corresponding minimum–maximum values, as well as kurtosis and skewness statistics (acceptable range: –1.5 to +1.5). Categorical variables were summarised as frequencies and percentages. The Kolmogorov-Smirnov test was applied to assess normality. Between-group comparisons of categorical variables were performed using chi-square (χ2) or Fisher’s exact tests, while continuous variables were evaluated using independent samples t-tests or Mann-Whitney U tests. For paired comparisons, the paired samples t-test was employed. Pearson or Spearman correlation coefficients were calculated to examine associations between variables.
Factors influencing changes in adropin levels among all participants were examined using a multivariate linear regression model. Model diagnostics indicated no autocorrelation (Durbin-Watson statistic = 1.7) and no multicollinearity (condition index = 7.9; variance inflation factor = 1.2). The regression model was statistically significant (R = 0.7, R2 = 0.6, adjusted R2 = 0.6, F(4,9) = 37.7, p < 0.001), accounting for 60% of the variance in adropin change. A p-value < 0.05 was considered statistically significant.
Results
A total of 99 children (59 obese and 40 healthy controls) were included in our study. The average age of our sample was 11.5 (±4.5) years, and the age range was between 1.5 and 18 years. The study group consisted of 56 females and 43 males.
Clinical and laboratory characteristics of obese and healthy children at admission are shown in Table I.
Table I
Clinical and laboratory characteristics of obese and healthy children at admission
[i] Data are presented as mean ± standard deviation. Student’s t-test is used. αχ2 test is used. Statistically significant results are shown in bold. ACTH – adrenocorticotropic hormone; ALT – alanine aminotransferase; AST – aspartate aminotransferase; BMI – body mass index; F – female; HbA1c – glycated haemoglobin; HDL-C – high-density lipoprotein cholesterol; LDL-C – low-density lipoprotein cholesterol; M – male; NA – not available; SDS – standard deviation score
When adropin levels were compared separately by sex, adropin levels of obese females (n = 35) were found to be lower than those of healthy females (n = 21), (201.2 ±67.1 ng/l vs. 361 ±71 ng/l, p < 0.001). Similarly, obese males (n = 24) had lower adropin levels than healthy males (n = 19), (228.3 ±66.7 ng/l vs. 378.3 ±57.2 ng/l, p < 0.001).
Obese and healthy control groups were also compared according to sex. Although there was a statistical difference in BMI SDS (3.3 ±0.5 SD vs. 2.8 ±0.8 SD, p = 0.01) between obese girls (n = 35) and obese boys (n = 24), no significant difference was detected in age (13.1 ±3.5 years vs. 11.8 ±4.7 years, p = 0.2) and adropin level (201.2 ±67.1 ng/l vs. 228.3 ±66.7 ng/l, p = 0.1), respectively. No statistically significant difference was detected in BMI SDS (–0.3 ±0.7 SD vs. –0.2 ±1.0 SD, p = 0.7), age (10 ±5.1 years vs. 9.8 ±4.4 years, p = 0.9), and adropin (361 ±71 ng/l vs. 378.3 ±57.2 ng/l, p = 0.4) between healthy girls (n = 21) and healthy boys (n = 19).
Metabolic examinations of the obese patients were repeated following a 12-week diet plan. The comparison of clinical and biochemical findings before and after diet intervention in obese children is shown in Table II. A decrease in BMI SDS was observed in 27 obese children (45.8%) compared to the initial assessment. When obese children were re-examined, an increase in adropin levels was observed compared to baseline (212.2 ±67.7 ng/l vs. 237.4 ±87.3 ng/l, p = 0.03). Adropin levels at the time of admission were compared in those who lost weight with the diet (n = 27) and those who could not (n = 32). Children who lost weight had lower adropin levels (187.4 ±65.8 ng/l vs. 233.1 ±62.8 ng/l, p = 0.009) at initial admission. No statistically significant difference was observed in BMI SDS at the time of admission in those who lost weight through diet and those who could not (3.1 ±0.8 SD vs. 3.1 ±0.6 SD, p = 0.8). While there was a positive relationship in adropin level in children who lost weight with the diet (BMI SDS change –0.2 SD), there was a negative relationship in adropin level in children who could not lose weight with the diet (BMI SDS change +0.07 SD). The difference between the two time measurements of adropin levels is statistically significant (118.1 ±23.5 ng/l vs. –53.1 ±17.9 ng/l, p < 0.001).
Table II
Comparison of clinical and biochemical findings before and after treatment in children with obesity
[i] Data are presented as mean ± standard deviation. Paired t-test is used. Statistically significant results are shown in bold. ACTH – adrenocorticotropic hormone; ALT – alanine aminotransferase; AST – aspartate aminotransferase; BMI – body mass index; HbA1c – glyca-ted haemoglobin; HDL-C – high-density lipoprotein cholesterol; LDL-C – low-density lipoprotein cholesterol; SDS – standard deviation score
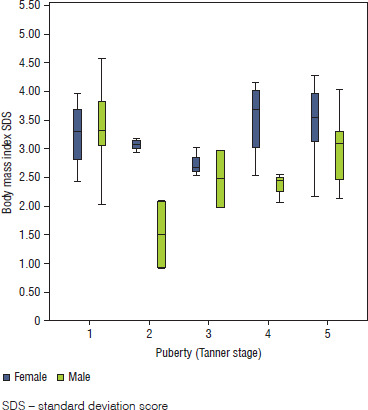
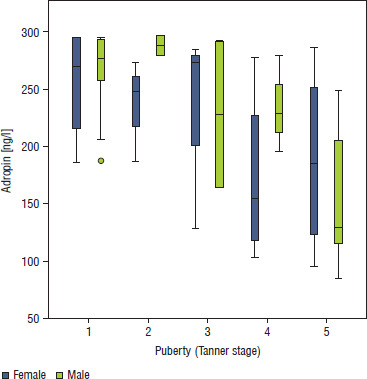
In the group with obesity, 4 of the girls were at Tanner stage 1, 3 of them were at Tanner stage 2, 3 of them were at Tanner stage 3, 4 of them were at Tanner stage 4, and 21 of them were at Tanner stage 5 puberty; on the other hand, 10 of the boys were at Tanner stage 1, 2 of them were at Tanner stage 2, 2 of them were at Tanner stage 3, 3 of them were at Tanner stage 4, and 7 of them were at Tanner stage 5 puberty (p = 0.06). The change in adropin level as the puberty progressed was examined separately for both sexes in children with obesity. The puberty stage and adropin level, and puberty stage and BMI SDS relationships in children with obesity are shown in Figures 1 and 2.
Factors effecting adropin levels were first examined separately in both obese and healthy control groups using correlation analyses. Then, the effect and degree of metabolic parameters that may have affected the adropin were examined by multivariate linear regression analysis. The relationship between adropin level and metabolic syndrome parameters in obese and healthy control groups is shown in Table III.
Table III
The relationship between adropin level and metabolic syndrome parameters in obese and healthy control groups
[i] Pearson correlation analysis was used. α indicates that Spearman correlation analysis was used. Statistically significant results are shown in bold. ALT – alanine aminotransferase; BMI – body mass index; HbA1c – glycated haemoglobin; HDL-C – high-density lipoprotein cholesterol; HOMA-IR – Homeostasis Model Assessment of Insulin Resistance; LDL-C – low-density lipoprotein cholesterol; NA – not available; SDS – standard deviation score
The examination of the direction and degree of factors (in all patients) affecting adropin level with a multivariate linear regression model is shown in Table IV.
Table IV
Multivariate linear regression analysis of factors affecting adropin levels
Discussion
In our study, adropin levels were found to be significantly lower in obese children than in the healthy control group, as shown in some studies in the literature [5, 8, 19, 20]. Although the mean age and serum ALT levels were higher in the obese group, when age, sex, BMI SDS, and ALT were evaluated together in multivariate regression analysis, BMI SDS was found to be the only independent factor affecting the adropin level (β = –0.6, p < 0.001). Additionally, a statistically significant increase in adropin levels was observed in obese children with 3 months of dietary intervention compared to baseline (212.2 ±67.7 ng/ml vs. 237.4 ±87.3 ng/ml, p = 0.03). In this respect, adropin can also be used as an examination method to evaluate compliance with diet. Adropin levels at the time of admission were compared in those who lost weight with a diet and those who could not. Children who were able to lose weight had lower adropin levels (187.4 ±65.8 ng/l vs. 233.1 ±62.8 ng/l, p = 0.009) at initial admission. No statistically significant difference was observed in BMI SDS at the time of admission in those who lost weight through diet and those who could not. In this respect, we observed that although adropin level is a parameter that can change with BMI SDS, it can change in the short term with nutritional content and diet. Therefore, it may not be a guide for long-term changes in conditions related to metabolic health.
The plasma half-life of adropin remains unclear and has been reported to last from a few minutes to half an hour [4, 21]. Adropin has been shown not to be regulated by acute signals of nutrient intake in humans. No significant changes in adropin levels associated with circadian, meal, or fasting were observed [22].
Butler et al. [22] reported a significant increase in adropin levels following Roux-en-Y gastric bypass surgery, with peak levels detected particularly at the three-month postoperative follow-up. Similarly, Zhang et al. [8] reported an increase in adropin levels in children who lost weight after a 12-week aerobic exercise intervention. In our study, we observed a similar result with diet-related lifestyle changes.
In our study, there was a negative relationship between age and adropin level in the obese group, and although age and pubertal progression showed a positive correlation, there was no linear decrease in adropin levels with puberty. It is conceivable that adropin levels may decrease with age during puberty. However, the change in BMI SDS should also be taken into account. In this respect, the effect of puberty on adropin level will not be linear. We noticed that BMI SDS change influenced the alteration of adropin levels during the pubertal period. One of the limitations of our study was that pubertal evaluation was not performed in the control group. For this reason, we could not evaluate the relationship between puberty and adropin in the entire group. We think that in the healthy group, the change in Tanner stages (Tanner stages 2–3, when physical growth peaks in females, and Tanner stages 3–4, when physical growth peaks in males), should be examined more carefully, especially by including more children.
We did not detect any relationship between age or BMI SDS and adropin levels in the healthy control group. So, this entity does not reveal the cause-and-effect relationship between obesity and low adropin levels. As also emphasised by Butler et al. [22], further studies are needed to determine whether low adropin levels in healthy-weight individuals can predict the future risk of overweight or metabolic disorders. Evidence from animal studies suggests that adropin may not play a major role in the regulation of body weight. Specifically, Kumar et al. [23] demonstrated that altered adropin levels had only a modest effect on fat mass in adropin knockout mice and were not associated with hyperphagia or the response to diet-induced obesity.
Studies have found lower levels of adropin in obesity-related comorbidities [20, 24–26]. Aydin et al. [27] found that cord blood adropin levels were significantly lower in the intrauterine growth restriction (IUGR) group compared to controls. Furthermore, the authors suggested that differences in foetal adropin expression in IUGR may influence the future development of obesity, metabolic syndrome, diabetes mellitus, and cardiovascular disease. These reports suggest that children with low adropin levels may be more metabolically unhealthy and may initially create a negative motivation to lose weight through diet. However, in our study, we observed that although the initial BMI SDS were similar in the groups that could lose weight with diet and those that could not, those with lower initial adropin levels were able to lose weight better.
Research has established links between adropin and cardiovascular risk factors such as obesity, insulin resistance, and dyslipidaemia, positioning it as a valuable biomarker for assessing cardiovascular disease risk. New studies highlight the diagnostic and prognostic significance of adropin, showing that higher levels are associated with better cardiovascular outcomes, while lower levels are associated with a higher risk of cardiovascular disease [25].
We also have some limitations in our research. First, our study was a cross-sectional study, and our sample size was not large enough. Second, assays using adropin antibodies, which have not yet been fully validated, were used to measure adropin concentrations. This makes it difficult to compare results across studies using different assays, and developing a universal approach is challenging. Thirdly, it is unknown whether interventions such as lifestyle change, diet, or exercise made changes in the adropin levels in the healthy control group. Finally, we did not use a standard scale to evaluate obese patients’ compliance with the diet. This condition also creates a limitation.
We could not evaluate the relationship between puberty and adropin in the control group. We think that the relationship between adropin and the central nervous system and hypothalamus, and the changing body composition with puberty are new areas that need to be investigated.
Conclusions
Our research is an important study that examines the effect of parameters such as age, sex, and BMI on adropin and shows that the only independent factor effecting the change in adropin level is BMI SDS. We observed that BMI SDS plays a role in the non-linear relationship between pubertal progression and adropin level. A significant increase in adropin levels was observed in obese children who were able to lose weight with a 12-week diet intervention.
Long-term rather than cross-sectional studies examining factors that may affect adropin levels in obese and normal-weight paediatric populations are needed.