


Introduction
The last years have seen an ever-growing number of publications reporting the results from randomized clinical trials investigating new treatment options for irritable bowel syndrome (IBS) patients. The gastrointestinal tract of IBS patients is malfunctional, leading to a variety of characteristic symptoms such as periodic abdominal pain, bloating, and abnormal bowel movements [1]. Published prevalence rates for IBS differ significantly depending on regions analyzed and criteria employed for the diagnosis, with a pooled prevalence of 11.2% [2, 3]. There is no reliable biological marker for IBS which makes IBS diagnosis totally dependent on the symptoms reported by patients [4–6]. Consequently, characterization of treatment effects in clinical IBS trials is mainly focused on assessing changes of the severity or frequency of typical symptoms observed in IBS patients. For this purpose, a number of IBS-specific assessment scales have been established, among them the IBS Adequate Relief (IBS-AR) scale [7] and the IBS Severity Scoring System (IBS-SSS) [5].
The IBS-AR scale comprises a single question: “Has the treatment resulted in adequate relief?”, which has to be answered “yes” or “no”. The IBS-AR scale has its limitations but due to its binary character is easy to employ in clinical trials, and its dichotomous characteristics provide a direct responder rate value [8].
Treatment effects on the severity of IBS symptoms can be measured with the IBS-SSS. The IBS-SSS comprises five subscales, each assessing a particular symptom typically associated with IBS. The five subscales assess: (i) abdominal pain severity, (ii) abdominal pain occurrence rate, (iii) flatulence severity, (iv) patient’s dissatisfaction with bowel movements, and (v) negative impact of IBS on patient’s quality of life. To answer each of the five questions, patients mark a position on a visual analog scale ranging from 0 to 100 points. The total IBS-SSS score can vary between 0 and 500 points, with each of the five subscales contributing a maximum of 100 points. High scores on the IBS-SSS indicate a high symptom severity or a high burden for patients. Measuring IBS-SSS scores can be used to assess treatment effects on symptom load over time and to characterize differences between individual treatment groups (e.g., differences between treatment with verum and placebo). Due to the continuous character of results obtained with the IBS-SSS, the determination of an IBS-SSS responder rate requires the definition of a cut-off value. In the 1997 publication describing the validation of the IBS-SSS, the authors claimed that a change of –50 points on the scale is adequate to detect an improvement in IBS patients [5]. It is interesting that in the publication, little justification for this –50 points cut-off value was provided. Nevertheless, numerous clinical IBS trials using the IBS-SSS have used a change of –50 points for the calculation of an IBS-SSS patient responder rate.
Our team has recently published results from a multicenter, randomized, double-blind, placebo-controlled trial involving primary-care patients with moderate to severe IBS [9]. A total of 202 IBS patients were randomly allocated (1 : 1) to treatment with either placebo or a balanced nine-strain synbiotic. After treatment for 12 weeks, data from 201 patients were analyzed after 1 patient was lost to follow-up. Among the different endpoints of the trial were the change on the IBS-SSS (primary endpoint) and the achievement of adequate relief determined with the IBS-AR scale (secondary endpoint). As done for many other randomized clinical IBS-trials, the IBS-SSS responder rate was calculated by using a –50 points cut-off value. This cut-off value was defined during the registration process (at ClinicalTrials.gov) performed before the trial recruitment was started. The use of the –50 points cut-off value resulted in an IBS-SSS responder rate of 98% for the verum and 14% for the placebo group. The responder rates obtained with the IBS-AR scale were 70% and 0% for the verum and the placebo group, respectively. Triggered by the differences of the responder rates observed for the two scales in our trial, the present analysis aimed to evaluate whether the –50 points cut-off value used for the IBS-SSS responder rate calculation is an appropriate value or should be revised. A receiver operating characteristics curve (ROC) analysis using the changes obtained on the IBS-SSS scale as cut-off values and the IBS-AR data as a binary classifier was performed to determine whether changes on the IBS-SSS are good indicators for the achievement of adequate relief in IBS patients [10–12]. To determine the optimal cut-off value for calculating an IBS-SSS responder rate, the accuracy rates and the Youden’s J index values were analyzed.
Aim
While the results from the current analysis are of importance for the interpretation of the results obtained in our clinical trial, they might also be of relevance for the re-evaluation of published data from past IBS clinical trials, as well as the assessment of IBS-SSS responder rates of future clinical trials with IBS patients.
Material and methods
Patients
The present study used data obtained in a recently published multicenter, randomized, double-blind, placebo controlled clinical trial (the Vivatlac Synbiotic in IBS (ViIBS) Trial) evaluating the efficacy of a balanced nine-strain synbiotic in primary care IBS patients [9]. The ViIBS Trial was reviewed and approved by the Ethics Committee of the Calisia University (projects identification code 1/2023, 25 January 2023). Written informed consent was obtained from each patient included in the study. The study was conducted in accordance with the 1975 Declaration of Helsinki. The trial was registered at ClinicalTrials.gov under NCT05731232.
Data acquisition
Individual data from 201 patients (101 from the synbiotic treatment group and 100 from the placebo group) were analyzed. For the present analysis, two data sets from the trial were used: i) the treatment-caused change of the severity of IBS symptoms determined as the difference of the IBS-SSS scores at the end of the treatment and at enrollment in the clinical trial, and ii) measurement of adequate relief at the end of treatment determined with the IBS-AR scale. Details of the measurements can be found in the “Material and methods” section of the trial publication [9]. For the purpose of the analysis, answers to the IBS-AR scale were transformed by replacing “yes” with “1” and “no” with “0.”
Data analyses
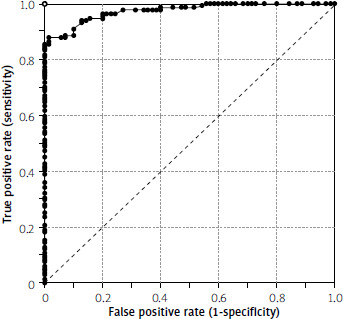
An ROC curve was established by calculating true positive (sensitivity) rates and false positive (1-specificity) rates using the change of IBS-SSS values as cut-off values with the transformed IBS-AR scale results used as a binary classifier. The ROC curve was established by plotting the “sensitivity” (y-axis data) against the “1-specificity” (x-axis data). The resulting ROC curve then underwent statistical analysis as described in the “Statistical analysis” section.
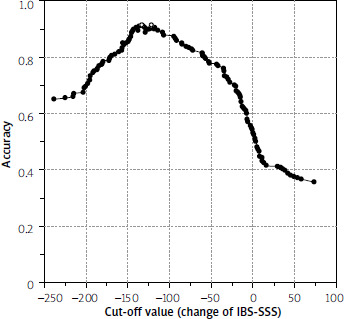
The accuracy rates for each change of IBS-SSS values used as the cut-off value were calculated by adding up the corresponding true positive and true negative rates. The accuracy rates (y-axis) were plotted against the IBS-SSS cut-off values (x-axis). This resulting curve was examined for maximum values.
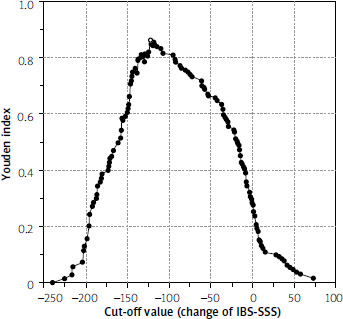
Youden’s J statistic refers to the distance between the 45° diagonal and the ROC curve while moving the 45° diagonal (a straight line with the slope of 1) in the coordinate (0,1) direction. The Youden’s J statistic values were calculated by adding up the “sensitivity” and the “specificity” values and subtracting one. The Youden index values (y-axis) were plotted against the IBS-SSS cut-off values (x-axis). This resulting curve was examined for maximum values.
Results
For the 201 patients analyzed in the trial, changes on the IBS-SSS at the end of the treatment compared to the value determined at the enrollment examination varied from –239 to +73 points, with negative values indicating a reduction and positive values indicating a worsening of the severity of symptoms. Of the 201 patients analyzed, 70 achieved an adequate relief at the end of the treatment. All 70 patients with adequate relief were patients from the synbiotic treatment group; none of the placebo-treated patients achieved adequate relief.
ROC curve
To establish the ROC curve, the “sensitivity” values were plotted against the “1-specificity” values (Figure 1). The AUC value determined for this ROC was 0.9738 (Z = 11.0591; p < 0.000001) with a 95% CI ranging from 0.9565 to 0.9912.
Figure 1
Receiver operating characteristic curve using change of Irritable Bowel Syndrome Severity Scoring System values (score at end of treatment minus score at enrollment) as cut-off values for determining the true positive and the false positive rates based on the results of the Irritable Bowel Syndrome Adequate Relief measurements at the end of the trial as binary differentiators.The dashed diagonal line indicates the ROC of a random classifier. A perfect classifier is represented by the open circle (0,1) in the upper eft corner of the graph
Analysis of accuracy rates
Figure 2 shows the accuracy rates plotted against the changes of the IBS-SSS scores. Analyzing the curve for maximum values revealed that there were two maxima. In both cases, the accuracy rate values were 0.9154, while the IBS-SSS change values were –133 and –122, respectively.
Analysis of Youden index rates
The analysis of the accuracy rates revealed two maximum values, preventing the determination of a single, well-defined cut-off value. Therefore, the Youden index values were plotted against the changes of the IBS-SSS scores (Figure 3). Analyzing the resulting curve revealed one maximum at an IBS-SSS change of –122 and a Youden index of 0.8636.
Re-evaluation of the IBS-SSS responder rates for the ViIBS trial
In accordance with the registered protocol of the ViIBS trial, IBS-SSS responder rates for the publication of the trial results were calculated by using a cut-off value of –50 points [9]. This cut-off value resulted in IBS-SSS responder rates of 98% for the multi-strain synbiotic and 14% for the placebo group. Re-evaluation of the trial data using a cut-off value of –122 points resulted in IBS-SSS responder rates of 79% for the patient group treated with the multi-strain synbiotic and of 0% for the placebo group.
Discussion
Determination of the AUC of the ROC curve established with IBS-SSS and IBS-AR scale data from the clinical trial revealed a value (0.9738) which is close to the AUC value of an ideal ROC curve (1.000). For any diagnostic technique to be meaningful, the AUC of the ROC curve must be greater than 0.5 (a value suggesting that there is no discrimination). In general, the AUC value should be greater than 0.8 to be considered acceptable [12]. In addition, as clinical trial data are influenced by statistical errors, the lower value of the 95% CI of the AUC should be greater than 0.5, which is the case for the ROC curve established in the present analysis, for which the value is 0.9565. The data from the ROC curve analysis indicate that measuring the change of IBS-SSS scores can be used to evaluate whether IBS patients have achieved adequate relief or not.
Finding the optimal cut-off value for the determination of a meaningful IBS-SSS responder rate, one with an appropriate sensitivity and specificity, is not a simple task. Applying less stringent criteria to increase the sensitivity results is a trade-off in which specificity decreases. Therefore, finding the optimal cut-off is not achievable by maximizing sensitivity and specificity, but requires the identification of an appropriate compromise between these two parameters. For the purpose of the present analysis, we assumed that sensitivity and specificity are equally important. This assumption facilitates the determination of a cut-off value; however, we are aware that this simplification may be questioned. There are more than 30 methods known to find the optimal cut-off value [13], two of which have been employed for the present study. In the first approach, the accuracy rates for different changes of the IBS-SSS scores were calculated and analyzed. This method assumes that all correctly classified results (whether they are true positive or true negative) are of equal value and all misclassified results are equally undesirable. Analyzing accuracy rates has the intrinsic disadvantage that, as sensitivity and specificity change, there may be two or more points at which the accuracy values maximize. This was actually the case, as the analysis of the accuracy value curve revealed two identical maxima at IBS-SSS score changes of –122 and –133 points. The second approach for determining the optimal cut-off value employed the Youden’s J statistic. Analyzing the Youden’s index curve revealed a single maximum at an IBS-SSS score change of –122 points.
While using a cut-off value of –50 points for the calculation of the IBS-SSS responder rate from the data obtained in the ViIBS trial was in line with (i) the pre-study registered trial protocol and (ii) the practice used frequently in clinical IBS trials, it might not represent the best approach for analyzing the trial data. Based on the findings of the present analysis, we conclude that, at least for the ViIBS trial, the IBS-SSS responder rate is more appropriately calculated by using a cut-off value of –122 points. Calculating the IBS-SSS responder rates for the ViIBS trial with this larger hurdle reduces the responder rate for the multi-strain synbiotic treatment group from 98% to 79% and for the placebo group from 14% to 0%.
Trial results obtained with continuous scales (like with the IBS-SSS) require conversion into dichotomous groups to determine the presence or absence of a meaningful treatment effect. Establishing an appropriate cut-off point for this conversion is important as otherwise the effect of the treatment under investigation is either under- or overestimated. This can lead to a wrong judgement of the therapeutic value of the treatment investigated. Since the publication by Francis et al. in 1997 [5], a cut-off value of –50 points for the determination of the IBS-SSS responder rate has been used in a number of past clinical trials and also by us when we planned the ViIBS trial. So far, the –50 points IBS-SSS cut-off value has been rarely challenged. An exception is a publication from 2009 in which the authors proposed an IBS-SSS cut-off value of –95 points [14]. After learning about the results of the present study, we strongly believe that the appropriate IBS-SSS cut-off value for analyzing the data from the ViIBS trial is –122 points rather than the initially used –50 points value. Based on this insight, the IBS-SSS responder rates observed in the ViIBS trial have to be adjusted for the verum group from 98% to 79% and for the placebo group from 14% to 0%. Thereby, the difference of the responder rate of the multi-strain treated patient group and the patient group treated with placebo is reduced from 84% (98–14%) to 79% (79–0%). The latter (still large) difference between the responder rates of the verum and the placebo group should be taken into account when judging the value of the balanced multi-strain synbiotic as a treatment for IBS patients.
Data used for the presented analysis were obtained in a multicenter, randomized, double-blind, placebo-controlled clinical trial fulfilling the clinical trial design requirements of a high-quality study. Taking into account that many IBS trials involve fewer than 100 patients, the 201-patient data sets used for the present analysis represent a rather large sample size. The IBS-SSS and the IBS-AR scale are well established and frequently used in IBS clinical trials, thereby making the results of this study interesting for the analyses of clinical trial research with IBS patients in general. The methodology used (analyses of the ROC curve, the accuracy rates, and Youden’s index values) is well established and most likely common knowledge for people interested in clinical IBS research.
For the determination of a meaningful IBS-SSS cut-off value, the results from IBS-AR scale measurements have been used as a binary differentiator. The limitations of the IBS-AR scale have to be considered when evaluating the results of the present study. However, obtaining the statement “adequate relief achieved” from an IBS patient is a tough call, as it most likely represents the ultimate desire each IBS patient has. Therefore, the use of the IBS-AR results as a binary differentiator might not be a bad approach after all. For the determination of the cut-off value, it was assumed that sensitivity and specificity are equally valuable. Not everyone might agree with this assumption, but it was employed to avoid overcomplicating the analyses.
Conclusions
Using an appropriate IBS-SSS cut-off value for the calculation of the responder rate is important to allow a meaningful assessment of the effects of treatment in clinical trials with IBS patients. While a –50 points cut-off value is frequently used, this value should be critically challenged when analyzing IBS-SSS data from clinical trials with IBS patients. By using data from a high-quality clinical trial with data from 201 patients, the present study established a value of –122 points as an appropriate cut-off value for the calculation of the IBS-SSS responder rate for that particular trial. More analyses like the one presented here might be needed to establish a commonly appropriate cut-off value for the calculation of IBS-SSS responder rates. However, based on the insights generated by the present study, analyses of IBS-SSS measurements from past and future IBS trials should carefully evaluate which cut-off value is appropriate for the calculation of IBS-SSS responder rates.