Pediatric Endocrinology Diabetes and Metabolism

Pełna treść

2/2026 vol. 32
Artykuł przeglądowy

Konsekwencje dysfunkcji adipocytów w otyłości dziecięcej: przegląd narracyjny

  1. Undergraduate Student – Faculty of Medicine, Pontifical Catholic University of Campinas, Brazil

  2. Graduate Student – Post-Graduation Program in Health Sciences, Pontifical Catholic University
    of Campinas, Brazil

  3. Professor and Researcher – Post-Graduation Program in Health Sciences, Pontifical Catholic University of Campinas, Brazil

Pediatr Endocrinol Diabetes Metab 2026; 32 (2): 121-128

Data publikacji online: 2026/06/05
Plik artykułu
0424_Implications of adipocyte (3).pdf
Confronting perimenopausal women’s knowledge of coronary heart disease with their health behaviours. Controversial role of hormone replacement therapy in the protection of coronary heart disease

Introduction

In addition to its passive function in storing lipids, white adipose tissue (WAT) is recognized as a dynamic endocrine organ involved in various physiological processes, including energy homeostasis, inflammation, and metabolic regulation. The functional diversity of WAT is attributed to its heterogeneous cellular composition [1]. Among its key components are adipocytes, which store energy in the form of triglycerides and release it according to metabolic demands [2]. In addition to adipocytes, WAT comprises preadipocytes – precursor cells that differentiate into mature adipocytes through the process of adipogenesis. This process occurs during childhood and adolescence [3]. Blood cells, fibroblasts, and a collection of immune cells are jointly referred to as the stromal vascular fraction of adipose tissue. Visceral adipose tissue (VAT) and subcutaneous adipose tissue (SAT) depots are compartments that house cells and adipocytes with different characteristics. SAT is characterized by a predominance of anti-inflammatory immune cell populations as well as smaller, more plastic adipocytes capable of healthier lipid storage and turnover. Conversely, VAT is more likely to develop inflammatory activation, characterized by increased infiltration of pro-inflammatory immune cells and a higher degree of adipocyte hypertrophy in response to metabolic stress [4]. A high caloric intake, environmental factors, lifestyle, inadequate nutrition, and exposure to maternal obesity are conditions that may stimulate [57] the secretion of pro-inflammatory cytokines such as tumor necrosis factor-alpha (TNF-α) and interleukin-6 (IL-6), thereby contributing to systemic low-grade inflammation [8]. Inflammation leads to endocrine complications such as a reduction in insulin sensitivity, increased risk for type 2 diabetes, and cardiometabolic risk [9], and may also be associated with cancer development in children [10, 11]. Here, we summarize aspects of adipose tissue development and the clinical outcomes of its unhealthy expansion associated with inflammation in children. We also discuss how maternal obesity may induce the development of childhood obesity and the long-term outcomes associated with this condition. Scopus and PubMed databases were searched, and published studies were included until May 2025. Search terms included childhood obesity, adipose tissue development, adipose tissue inflammation, childhood cancer, maternal obesity, and a combination of these terms.

Obesity metrics and fat measurements in children

According to the World Obesity Federation, it is estimated that 206 million children and adolescents aged 5–19 will be obese by 2030 [12, 13]. Childhood and youth obesity are estimated using the body mass index (BMI), which is calculated by measuring body weight relative to height [14, 15]. Z-scores or percentiles represent BMI in children and are expressed relative to the same sex and age groups. According to the Centers for Disease Control and Prevention, among individuals aged 2 to 19 years, overweight is defined as a BMI > 85th percentile and < 95th percentile, and obesity as BMI > 95th percentile. Using z-scores, under 5 years old, overweight is defined as weight-for-height ≥ 2 standard deviations (SD), while obesity is ≥ 3 SD. Among those aged 5–19 years, overweight and obesity are characterized by a BMI-for-age ≥ 1 SD and 2 SD, respectively [16]. Alternatively, anthropometric measurements define overweight and obesity, such as the mid-upper arm circumference [17, 18] and the waist circumference [19].

However, BMI does not directly represent body fat mass. Therefore, different techniques can be used to obtain a quantitative assessment of fat mass in children and adolescents, such as dual-energy X-ray absorptiometry (DXA), bioelectrical impedance (BIA), and magnetic resonance imaging (MRI). DXA is considered the gold standard technique to assess body composition in children, although it is costly and sometimes difficult to implement in clinical practice. Beyond the fat mass measurement and the estimation of VAT and SAT, DXA has also been used to evaluate lean mass [20]. An analysis of different studies in a systematic review demonstrated that BIA is also accurate in the estimation of fat mass and fat-free mass in the pediatric population [21]. MRI has emerged as a method for the quantification of abdominal fat in addition to estimation of brown adipose tissue [22, 23].

These techniques associated with family history and lifestyle may be useful to differentiate healthy and unhealthy obesity and implement personalized therapeutic strategies for child and youth obesity.

Maternal obesity and offspring adiposity

Metabolic dysfunctions such as obesity and diabetes during pre-pregnancy or the gestational period may be associated with offspring adiposity and the development of childhood/adolescent obesity. This association is probably a combination of genetic and intrauterine factors, and possibly lifestyle, as demonstrated in different studies [6, 24, 25].

Maternal obesity may trigger epigenetic changes in genes responsible for controlling the development of offspring adipose tissue. In this situation, adipose tissue may lose healthy expansion, acquiring a hypertrophic phenotype that can be associated with inflammation [26]. Maternal obesity is a strong predictor of pediatric obesity, as suggested by clinical studies and those comprising experimental models. DNA demethylation of the promoter region of a zinc finger protein induced by maternal obesity has been observed in adipose tissue progenitor cells from offspring, conferring enhanced adipogenic capacity on these cells [27]. In an experimental animal model where mothers were fed a high-fat diet (HFD), fetal SAT exhibited hypertrophy alongside increased levels of cluster of differentiation 68, chemokine receptor 2, and pro-inflammatory cytokines such as TNF-α [28]. It was shown that if offspring from obese mothers are weaned onto an obesogenic diet, they may have larger visceral adipocytes, higher fat content in the adipocytes, and impaired insulin signaling protein expression. These findings showed that a combination of maternal and offspring obesity leads to the worst metabolic effects on offspring [29]. Interestingly, in humans, it was reported that women who underwent surgery for weight loss before pregnancy tend to have children with normal weight parameters when compared to those born to obese mothers [30].

Childhood obesity is associated with a higher risk of metabolic diseases, including type 2 diabetes mellitus, metabolic syndrome, and fatty liver disease [3133], as well as an increased incidence and mortality of cancers in adulthood. It remains unclear whether childhood obesity can predispose individuals to the development of cancer during childhood [34]. However, retrospective studies have shown that children born to overweight mothers have a greater risk of developing leukemia [35, 36]. A population-based cohort study in Sweden found that maternal overweight/obesity is a significant risk factor for childhood acute lymphoblastic leukemia in daughters [37]. Additionally, the association between high birth weight and leukemia risk appears to be mediated by hormones such as insulin growth factor and growth hormone (GH) [3840].

Studies involving humans and experimental models suggest that maternal obesity is associated with an increased risk of breast cancer in adulthood. Higher birth weight correlates with an elevated risk of breast cancer in premenopausal women [41]. An association between elevated birth weight and increased breast cancer risk has been proposed in Swedish postmenopausal women [42]. In a model where offspring breast cancer tumor-bearing mice were born to an obese mother due to a HFD, accelerated mammary tumor growth was observed. This growth was associated with a reduction in the number of granzyme B-secreting cluster of differentiation 8-positive (CD8+) T cells in the tumor microenvironment, indicating that consuming a HFD during pregnancy may increase the susceptibility of female offspring to tumor immune suppression and mammary tumor growth [43].

WAT development and expansion

VAT, primarily located in the mesentery and omentum, and SAT, localized in subcutaneous areas, are sites of lipid storage that differ in their development. Combined findings in mice and humans show that VAT in humans differentiates postnatally, whereas SAT differentiation occurs during embryogenesis [44, 45]. In humans, SAT differentiation begins at 14 weeks, followed by vascularization of this tissue. By 19 weeks, mesenchymal cells are proliferating, and the first adipocytes appear at week 28 [44]. The origin of adipocytes is controlled by transcriptional regulators, including peroxisome proliferator-activated receptor-γ and CCAAT/enhancer-binding proteins, which coordinate the formation of mature adipocytes [4648]. VAT and SAT may also exhibit distinct developmental gene signatures [49, 50], which are closely associated with the cellular, molecular, and physiological characteristics of these tissues. VAT is more sympathetically innervated than SAT, which could explain its lipolytic capacity. The inflammatory profile and vascularization are important characteristics of VAT. Therefore, SAT may be associated with the absence of metabolic abnormalities [4, 51]. In contrast, VAT may be more prone to an unhealthy profile, considering that immune cell infiltration and pro-inflammatory cytokine production are more pronounced in VAT.

The expansion of these tissues occurs through hypertrophy and hyperplasia, which are processes triggered by diet, such as a HFD [52, 53]. Hypertrophy involves the enlargement of existing adipocytes, and hyperplasia the formation of new adipocytes from adipogenic precursors – preadipocytes [54]. Adipocyte hypertrophy is associated with inflammation in obese children, suggesting that this metabolic condition develops in early childhood [55]. It was also reported that in obese male children, hypertrophic adipocytes in SAT, increased collagen deposition, and changes in the polarization and accumulation of M1 macrophages were found in adipose tissue [56].

Adipose tissue expansion often leads to hypoxia associated with reduced tissue vascularization. Evidence suggests that hypoxia increases adipocyte hypoxia-inducible factor-1α (HIF-1α) expression [57]. HIF-1α triggers obesity-related fibrosis and inflammation [57, 58], which compromise the functionality of adipose tissue. It has been reported that HIF-1α expression is increased in the adipose tissue of obese children compared with that of normal weight children, along with elevated circulating HIF-1α levels associated with adiposity and metabolic dysfunction [59]. Altered oxygen availability in adipose tissue affects immune cell composition (as discussed in the next section) and adipokine secretion. Leptin is an adipokine whose secretion correlates with adipose tissue mass [60, 61]. An increase in leptin secretion was associated with increased HIF-1α expression during hypoxia [62]. Different studies have reported that obese children have high leptin levels [63, 64]. Serum leptin concentration and other inflammatory cytokines were significantly higher in prepubertal obese children compared to the control group [65]. A significant positive correlation was found between BMI and leptin levels in prepubertal children [66]. Furthermore, it was shown that blood leptin levels were higher in obese children with acute lymphoblastic leukemia [67]. In other studies, it was reported that obesity in childhood leukemia at diagnosis may be associated with relapse [68], early mortality [69], and minimal residual disease [70].

Leptin signals through its receptor (leptin receptor), which is a single-transmembrane-domain molecule that belongs to the class I cytokine receptor superfamily [which includes the receptors of interleukin-1 (IL-1), interleukin-2, IL-6, and GH] [71]. Leptin circulates in free and protein-bound forms [72]. Leptin binding to its receptors in hypothalamic neurons regulates feeding and many other functions [73]. Leptin also exerts immunomodulatory effects in immune cells, promoting inflammatory responses [74, 75]. In different cells, the binding of leptin to leptin receptor long isoform b results in the activation of Janus kinase 2, which phosphorylates and activates signal transducer and activator of transcription 3 (STAT3). This enables STAT3 dimerization and translocation to the nucleus, where the transcriptional activity of multiple target genes is modulated [76, 77]. Leptin also activates mitogen-activated protein kinase, AMP-activated protein kinase, and phosphatidylinositol 3-kinase (PI3K)/Akt/mTORC1 pathways [78]. These pathways are also associated with the proliferation of cancer cells that express leptin receptors [79].

Obesity and inflammation

The important finding of TNF-α expression [80] and the presence of macrophages with a pro-inflammatory profile in adipose tissue [81, 82] revealed the link between inflammation triggered in adipose tissue and metabolic alterations associated with obesity, such as insulin resistance and type 2 diabetes. In obese children, an association between adipose tissue macrophage infiltration, inflammation, and insulin resistance has also been demonstrated [83].

Although macrophages were the first immune cells characterized in adipose tissue in the context of obesity, it has been observed that other immune system cells are also part of this scenario [84, 85]. In obese VAT, for instance, while immune cells with an inflammatory phenotype are more predominant, the anti-inflammatory cells, including regulatory T cells, M2-like macrophages, and group 2 innate lymphoid cells (ILC2s), are decreased [86]. Further studies have attempted to uncover which cell initiates the inflammatory process and how immune cell infiltration occurs in adipose tissue. It has been shown that the infiltration of CD8+ T cells in adipose tissue precedes the accumulation of macrophages, and approaches to induce depletion of CD8+ T cells have been effective in reducing macrophage infiltration and adipose tissue inflammation [87]. CD4+ T cells may also infiltrate adipose tissue before the appearance of macrophages [88]. It was also found that the adipose tissue of mice fed a HFD increased the expression of C-X-C motif chemokine receptor 3 in CD8+ T cells, which promotes the recruitment of pro-inflammatory M1 macrophages and maintains low-grade chronic inflammation [89]. More recently, it has been shown that in the early stage of obesity, adipose stem cells are responsible for recruiting T cells to adipose tissue via C-C motif chemokine ligand 5 [90]. In human adipose tissue, several chemokines have been shown to be expressed by adipocytes under obesity-associated chronic inflammation, suggesting their involvement in the recruitment and infiltration of leukocytes into obese adipose tissue [91]. Beyond chemokines, cytokines such as interleukin-33, produced by adipose stem and progenitor cells, contribute to an immune balance in adipose tissue by inducing ILC2-derived type 2 cytokines and sustaining eosinophil populations [92].

In the obese mouse model, hypoxia also determines the infiltration of immune cells in adipose tissue and sustained inflammation. It was observed that hypoxic adipose tissue possessed more CD8+ T cells when compared to controls, suggesting an increase in CD8+ T cell infiltration under this condition [93]. Moreover, in macrophages, enhanced HIF-1α expression associated with glycolysis sustained IL-1β production and therefore local and systemic inflammation [94].

Different cellular interactions that occur in adipose tissue are also important and contribute to the acquisition of an inflammatory identity in some cells. The shift from M2 to M1 macrophage differentiation and activation is enhanced by interferon γ-secreting Th1 cells in adipose tissue [95]. The expression of class II major histocompatibility complex in adipocytes is important to activate CD4+ T cells and to trigger adipose tissue inflammation [96]. New interactions of immune cells, as well as novel subtypes, have been characterized in adipose tissue using single-cell sequencing [97, 98].

Inflammation associated with obesity is not limited to adults. Different studies investigating immune cells in obese children suggest a correlation between low-grade inflammation and immune cells. The accumulation of macrophages in adipose tissue was associated with a high BMI in children [55]. Besides macrophages, other immune cells in adipose tissue or blood circulation were related to the degree of adiposity in children, such as CD19+ B cells [99]. A high frequency of neutrophils [100] and an increased percentage of Th17 cells were observed in obese children when compared to non-obese children [101]. The function of some immune cells also appears to be altered in childhood obesity. Tobin et al. [102] observed that natural killer (NK) cells presented reduced functionality, with a lower capacity for proliferation or response to stimuli. Considering the anti-tumor capacity of NK cells, these findings may suggest that obese children have a reduced immune response to tumors.

The evidence described indicates that low-grade inflammation and dysregulation of the immune system occur in obesity. These conditions, in addition to being related to metabolic conditions, are also closely associated with cancer. In adults, the relationship between obesity and cancer is already well established. Strong associations were recorded between BMI and cancers of the esophagus, thyroid, colon, kidneys, endometrium, and gallbladder [103]. However, the mechanisms related to obesity and childhood cancer are not fully understood. Some evidence links aspects of inflammation and obesity to different types of childhood cancer. Wang et al. [104] observed that children with brain tumors have increased total and central adiposity compared to healthy controls. Childhood obesity may be a potential factor associated with the development of central nervous system tumors, such as glioblastoma multiforme [105]. Pro-inflammatory cytokines such as IL-6 are also associated with neuroblastoma and event-free survival related to the disease. In vitro, using an anti-IL-6 antibody to neutralize IL-6 was suggested as an effective strategy to inhibit neuroblastoma cell proliferation [106].

Also, in childhood hematological cancer, it was reported that worse outcomes occur when children are obese [107]. Inflammation and the niche of adipose tissue may contribute to leukemia survival. Adipose tissue is a niche where leukemia cells may obtain advantages to survive. It was reported that stromal cell-derived factor 1 is the adipocyte-derived chemoattractant responsible for the migration of leukemia cells. Migrating to adipose tissue, leukemia cells were protected against chemotherapeutic drugs such as daunorubicin and vincristine [108]. In adipose tissue, leukemia cells have a source of free fatty acid provided by adipocytes. These fatty acids are incorporated into triglycerides and phospholipids, and used for oxidative phosphorylation, or are stored in lipid droplets that could be consumed under fuel deprivation, contributing to leukemia survival and proliferation [109].

Obesity-induced inflammation may exacerbate clonal hematopoiesis, contributing to hematologic neoplasia [110]. Inflammation can also trigger the activation of indoleamine-2,3-dioxygenase 1 (IDO1) – an enzyme that oxidizes tryptophan into kynurenine [111]. IDO1 is overexpressed in adipocytes from obese subjects [112]. It has been reported that childhood leukemia cells can also express IDO1 to obtain kynurenine, which can inhibit the anti-tumoral functions of immune cells, thus contributing to immunosuppression [113]. No studies have shown the expression of IDO1 in adipose tissue in children.

Conclusions

Childhood obesity is an important public health challenge. Understanding how external factors, such as HFDs and periods like pregnancy, are associated with obesity, and how they affect the development of adipocytes and the emergence of an unhealthy adipose tissue phenotype, may contribute to the development of new therapies for obesity and the prevention of metabolic diseases associated with it. Understanding the migratory profile of immune system cells to adipose tissue in children, as well as the cellular interactions within adipose tissue that establish a pro-inflammatory environment, is also important for the development of new therapeutic targets (Figure 1).
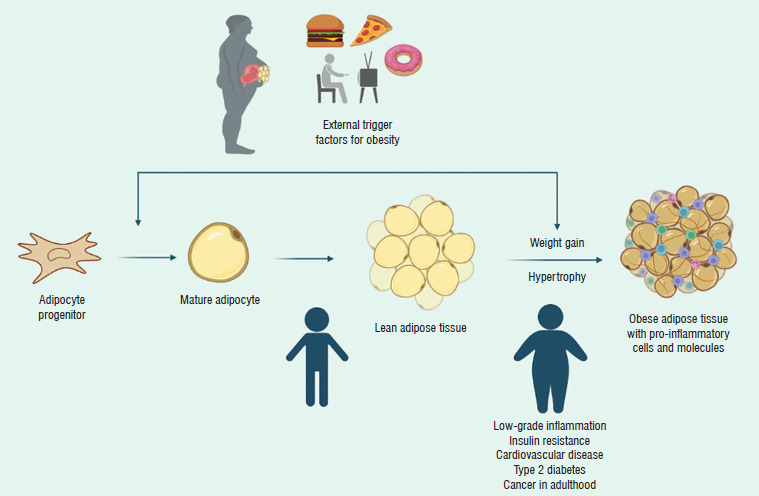

Figure 1

External trigger factors contribute to unhealthy adipose tissue expansion in children. These factors may also affect the generation of mature adipocytes. The altered adipose tissue environment promotes obesity-associated diseases, such as type 2 diabetes, insulin resistance, and cancer

/f/fulltexts/PEDM/57951/PEDM-32-57951-g001_min.jpg

Conflict of interest

None declared.

Funding

None.

Ethics approval

Not applicable.

References

1 

Esteve Ràfols M. Adipose tissue: cell heterogeneity and functional diversity. Endocr Nutr 2014; 61: 100–112. doi: 10.1016/j.endonu.2013.03.011.

2 

Spiegelman BM, Flier JS. Adipogenesis and obesity: rounding out the big picture. Cell 1996; 87: 377–389. doi: 10.1016/s0092-8674(00)81359-8.

3 

Spalding KL, Arner E, Westermark PO, et al. Dynamics of fat cell turnover in humans. Nature 2008; 453: 783–787. doi: 10.1038/nature06902.

4 

Ibrahim MM. Subcutaneous and visceral adipose tissue: structural and functional differences. Obes Rev 2010; 11: 11–18. doi: 10.1111/j.1467-789X.2009.00623.x.

5 

Lobstein T, Jackson-Leach R, Moodie ML, et al. Child and adolescent obesity: part of a bigger picture. Lancet 2015; 385: 2510–2520. doi: 10.1016/S0140-6736(14)61746-3.

6 

Larqué E, Labayen I, Flodmark CE, et al. From conception to infancy–early risk factors for childhood obesity. Nat Rev Endocrinol 2019; 15: 456–478. doi: 10.1038/s41574-019-0219-1.

7 

Woolford SJ, Sidell M, Li X, et al. Changes in body mass index among children and adolescents during the COVID-19 pandemic. JAMA 2021; 326: 1434–1436. doi: 10.1001/jama.2021.15036.

8 

Kolb H. Obese visceral fat tissue inflammation: from protective to detrimental? BMC Med 2022; 20: 494. doi: 10.1186/s12916-022-02672-y.

9 

Marcus C, Danielsson P, Hagman E. Pediatric obesity–long-term consequences and effect of weight loss. J Intern Med 2022; 292: 870–891. doi: 10.1111/joim.13547.

10 

Fernandes Q, Inchakalody VP, Bedhiafi T, et al. Chronic inflammation and cancer: the two sides of a coin. Life Sci 2024; 338: 122390. doi: 10.1016/j.lfs.2023.122390.

11 

Miracle CE, McCallister CL, Egleton RD, Salisbury TB. Mechanisms by which obesity regulates inflammation and anti-tumor immunity in cancer. Biochem Biophys Res Commun 2024; 12: 150437. doi: 10.1038/s41392-021-00658-5.

12 

Jebeile H, Kelly AS, O’Malley G, Baur LA. Obesity in children and adolescents: epidemiology, causes, assessment, and management. Lancet Diabetes Endocrinol 2022; 10: 351–365. doi: 10.1016/S2213-8587(22)00047-X.

13 

Lobstein T, Brinsden H. Atlas of childhood obesity. World Obesity Federation 2019. Available at: https://data.worldobesity.org/resources/11996-Childhood-Obesity-Atlas-Report-ART-V2.pdf (accessed 20 May 2024).

14 

Gurnani M, Birken C, Hamilton J. Childhood obesity: causes, consequences, and management. Pediatr Clin North Am 2015; 62: 821–840. doi: 10.1016/j.pcl.2015.04.001.

15 

Adab P, Pallan M, Whincup PH. Is BMI the best measure of obesity? BMJ 2018; 360: k1274. doi: 10.1136/bmj.k1274.

16 

World Health Organization. Obesity and overweight 2024. Available at: https://www.knowledge-action-portal.com/en/content/obesity-and-overweight (accessed 20 May 2024).

17 

Jayawardene W, Dickinson S, Lohrmann D, Agley J. Arm circumference-to-height ratio as a situational alternative to BMI percentile in assessing obesity and cardiometabolic risk in adolescents. J Obes 2018; 2018: 7456461. doi: 10.1155/2018/7456461.

18 

Sisay BG, Hassen HY, Jima BR, et al. The performance of mid-upper arm circumference for identifying children and adolescents with overweight and obesity: a systematic review and meta-analysis. Public Health Nutr 2022; 25: 607–616. doi: 10.1017/S1368980022000143.

19 

Dobashi K. Evaluation of obesity in school-age children. J Atheroscler Thromb 2016; 23: 32–38. doi: 10.5551/jat.29397.

20 

Shepherd JA, Ng BK, Sommer MJ, Heymsfield SB. Body composition by DXA. Bone 2017; 104: 101–105. doi: 10.1016/j.bone.2017.06.010.

21 

Chula de Castro JA, Lima TR, Silva DAS. Body composition estimation in children and adolescents by bioelectrical impedance analysis: a systematic review. J Body Mov Ther 2018; 22: 134–146. doi: 10.1016/j.jbmt.2017.04.010.

22 

Ly KV, Armstrong T, Yeh J, et al. Free-breathing magnetic resonance imaging assessment of body composition in healthy and overweight children: an observational study. J Pediatr Gastroenterol Nutr 2019; 68: 782–787. doi: 10.1097/MPG.0000000000002309.

23 

Andersson J, Roswall J, Kjellberg E, et al. MRI estimates of brown adipose tissue in children–associations to adiposity, osteocalcin, and thigh muscle volume. Magn Reson Imaging 2019; 58: 135–142. doi: 10.1016/j.mri.2019.02.001.

24 

Voerman E, Santos S, Patro Golab B, et al. Maternal body mass index, gestational weight gain, and the risk of overweight and obesity across childhood: an individual participant data meta-analysis. PLoS Med 2019; 16: e1002744. doi: 10.1371/journal.pmed.1002744.

25 

McIntyre HD, Catalano P, Zhang C, et al. Gestational diabetes mellitus. Nat Rev Dis Primers 2019; 5: 47. doi: 10.1038/s41572-019-0098-8.

26 

Lecoutre S, Maqdasy S, Lambert M, Breton C. The impact of maternal obesity on adipose progenitor cells. Biomedicines 2023; 11: 3252. doi: 10.3390/biomedicines11123252.

27 

Liang X, Yang Q, Fu X, et al. Maternal obesity epigenetically alters visceral fat progenitor cell properties in male offspring mice. J Physiol 2016; 594: 4453–4466. doi: 10.1113/JP272123.

28 

Murabayashi N, Sugiyama T, Zhang L, et al. Maternal high-fat diets cause insulin resistance through inflammatory changes in fetal adipose tissue. Eur J Obstet Gynecol Reprod Biol 2013; 169: 39–44. doi: 10.1016/j.ejogrb.2013.02.003.

29 

De Almeida Faria J, Duque-Guimarães D, Carpenter AA, et al. A post-weaning obesogenic diet exacerbates the detrimental effects of maternal obesity on offspring insulin signaling in adipose tissue. Sci Rep 2017; 7: 44949. doi: 10.1038/srep44949.

30 

Kral JG, Biron S, Simard S, et al. Large maternal weight loss from obesity surgery prevents transmission of obesity to children who were followed for 2 to 18 years. Pediatrics 2006; 118: e1644–e1649. doi: 10.1542/peds.2006-1379.

31 

Gepstein V, Weiss R. Obesity as the main risk factor for metabolic syndrome in children. Front Endocrinol 2019; 10: 568. doi: 10.3389/fendo.2019.00568.

32 

Eslam M, Alkhouri N, Vajro P, et al. Defining paediatric metabolic (dysfunction)-associated fatty liver disease: an international expert consensus statement. Lancet Gastroenterol Hepatol 2021; 6: 864–873. doi: 10.1016/S2468-1253(21)00183-7.

33 

Parlee SD, MacDougald OA. Maternal nutrition and risk of obesity in offspring: the Trojan horse of developmental plasticity. Biochim Biophys Acta 2014; 1842: 495–506. doi: 10.1016/j.bbadis.2013.07.007.

34 

Mohammadian Khonsari N, Shahrestanaki E, Ehsani A, et al. Association of childhood and adolescence obesity with incidence and mortality of adulthood cancers: a systematic review and meta-analysis. Front Endocrinol (Lausanne) 2023; 14: 1069164. doi: 10.3389/fendo.2023.1069164.

35 

Stacy SL, Buchanich JM, Ma ZQ, et al. Maternal obesity, birth size, and risk of childhood cancer development. Am J Epidemiol 2019; 188: 1503–1511. doi: 10.1093/aje/kwz118.

36 

Marley AR, Ryder JR, Turcotte LM, Spector LG. Maternal obesity and acute lymphoblastic leukemia risk in offspring: a summary of trends, epidemiological evidence, and possible biological mechanisms. Leuk Res 2022; 121: 106924. doi: 10.1016/j.leukres.2022.106924.

37 

Liu J, Kharazmi E, Liang Q, et al. Maternal weight during pregnancy and risk of childhood acute lymphoblastic leukemia in offspring. Leukemia 2025; 39: 590–598. doi: 10.1038/s41375-025-02517-6.

38 

Caughey RW, Michels KB. Birth weight and childhood leukemia: a meta-analysis and review of the current evidence. Int J Cancer 2009; 124: 2658–2670. doi: 10.1002/ijc.24225.

39 

Milne E, Royle JA, de Klerk NH, et al. Fetal growth and risk of childhood acute lymphoblastic leukemia: results from an Australian case-control study. Am J Epidemiol 2009; 170: 221–228. doi: 10.1093/aje/kwp117.

40 

Tsilingiris D, Vallianou NG, Spyrou N, et al. Obesity and leukemia: biological mechanisms, perspectives, and challenges. Curr Obes Rep 2024; 13: 1–34. doi: 10.1007/s13679-023-00542-z.

41 

Zhou W, Chen X, Huang H, et al. Birth weight and incidence of breast cancer: dose-response meta-analysis of prospective studies. Clin Breast Cancer 2020; 20: 555–568. doi: 10.1016/j.clbc.2020.04.011.

42 

Lahmann PH, Gullberg B, Olsson H, et al. Birth weight is associated with postmenopausal breast cancer risk in Swedish women. Br J Cancer 2004; 91: 1666–1668. doi: 10.1038/sj.bjc.6602203.

43 

Zhang X, de Oliveira Andrade F, Zhang H, et al. Maternal obesity increases offspring’s mammary cancer recurrence and impairs tumor immune response. Endocr Relat Cancer 2020; 27: 469–482. doi: 10.1530/ERC-20-0065.

44 

Poissonnet CM, Burdi AR, Garn SM. The chronology of adipose tissue appearance and distribution in the human fetus. Early Hum Dev 1984; 10: 1–11. doi: 10.1016/0378-3782(84)90106-3.

45 

Wang QA, Tao C, Gupta RK, Scherer PE. Tracking adipogenesis during white adipose tissue development, expansion and regeneration. Nat Med 2013; 19: 1338–1344. doi: 10.1038/nm.3324.

46 

Gregoire FM, Smas CM, Sul HS. Understanding adipocyte differentiation. Physiol Rev 1998; 78: 783–809. doi: 10.1152/physrev.1998.78.3.783.

47 

Tontonoz P, Hu E, Spiegelman BM. Stimulation of adipogenesis in fibroblasts by PPAR gamma 2, a lipid-activated transcription factor. Cell 1994; 79: 1147–1156. doi: 10.1016/0092-8674(94)90006-X.

48 

Cristancho AG, Lazar MA. Forming functional fat: a growing understanding of adipocyte differentiation. Nat Rev Mol Cell Biol 2011; 12: 722–734. doi: 10.1038/nrm3198.

49 

Gesta S, Blüher M, Yamamoto Y, et al. Evidence for a role of developmental genes in the origin of obesity and body fat distribution. Proc Natl Acad Sci USA 2006; 103: 6676–6681. doi: 10.1073/pnas.0601752103.

50 

Yamamoto Y, Gesta S, Lee KY, et al. Adipose depots possess unique developmental gene signatures. Obesity (Silver Spring) 2010; 18: 872–878. doi: 10.1038/oby.2009.512.

51 

Lazarescu O, Ziv-Agam M, Haim Y, et al. Human subcutaneous and visceral adipocyte atlases uncover classical and nonclassical adipocytes and depot-specific patterns. Nat Genet 2025; 57: 413–426. doi: 10.1038/s41588-024-02048-3.

52 

Poret JM, Souza-Smith F, Marcell SJ, et al. High fat diet consumption differentially affects adipose tissue inflammation and adipocyte size in obesity-prone and obesity-resistant rats. Int J Obes (Lond) 2018; 42: 535–541. doi: 10.1038/ijo.2017.280.

53 

Bilal M, Nawaz A, Kado T, et al. Fate of adipocyte progenitors during adipogenesis in mice fed a high-fat diet. Mol Metab 2021; 54: 101328. doi: 10.1016/j.molmet.2021.101328.

54 

Ghaben AL, Scherer PE. Adipogenesis and metabolic health. Nat Rev Mol Cell Biol 2019; 20: 242–258. doi: 10.1038/s41580-018-0093-z.

55 

Landgraf K, Rockstroh D, Wagner IV, et al. Evidence of early alterations in adipose tissue biology and function and its association with obesity-related inflammation and insulin resistance in children. Diabetes 2015; 64: 1249–1261. doi: 10.2337/db14-0744.

56 

Mujkić R, Šnajder Mujkić D, et al. Early childhood fat tissue changes–adipocyte morphometry, collagen deposition, and expression of CD163+ cells in subcutaneous and visceral adipose tissue of male children. Int J Environ Res Public Health 2021; 18: 3627. doi: 10.3390/ijerph18073627.

57 

Halberg N, Khan T, Trujillo ME, et al. Hypoxia-inducible factor 1alpha induces fibrosis and insulin resistance in white adipose tissue. Mol Cell Biol 2009; 29: 4467–4483. doi: 10.1128/MCB.00192-09.

58 

Fujisaka S, Usui I, Ikutani M, et al. Adipose tissue hypoxia induces inflammatory M1 polarity of macrophages in an HIF-1α-dependent and HIF-1α-independent manner in obese mice. Diabetologia 2013; 56: 1403–1412. doi: 10.1007/s00125-013-2885-1.

59 

Zhou N, Zheng W, Peng L, et al. HIF1α elevations at tissue and serum levels and their association with metabolic disorders in children with obesity. J Clin Endocrinol Metab 2024; 109: 1241–1249. doi: 10.1210/clinem/dgad710.

60 

Zhang Y, Proenca R, Maffei M, et al. Positional cloning of the mouse obese gene and its human homologue. Nature 1994; 372: 425–432. doi: 10.1038/372425a0.

61 

Maffei M, Halaas J, Ravussin E, et al. Leptin levels in human and rodent: measurement of plasma leptin and ob RNA in obese and weight-reduced subjects. Nat Med 1995; 1: 1155–1161. doi: 10.1038/nm1195-1155.

62 

Wang B, Wood IS, Trayhurn P. Hypoxia induces leptin gene expression and secretion in human preadipocytes: differential effects of hypoxia on adipokine expression by preadipocytes. J Endocrinol 2008; 198: 127–134. doi: 10.1677/JOE-08-0156.

63 

Pilcová R, Sulcová J, Hill M, et al. Leptin levels in obese children: effects of gender, weight reduction and androgens. Physiol Res 2023; 52: 53–60.

64 

Antunes H, Santos C, Carvalho S. Serum leptin levels in overweight children and adolescents. Br J Nutr 2009; 101: 1262–1266. doi: 10.1017/S0007114508055682.

65 

Aygun AD, Gungor S, Ustundag B, et al. Proinflammatory cytokines and leptin are increased in serum of prepubertal obese children. Mediators Inflamm 2005; 2005: 180–183. doi: 10.1155/MI.2005.180.

66 

Vales-Villamarín C, de Dios O, Pérez-Nadador I, et al. Leptin concentrations determine the association between high-sensitivity C-reactive protein levels and body mass index in prepubertal children. Nutrients 2023; 15: 2388. doi: 10.3390/nu15102388.

67 

Zareifar S, Shorafa S, Haghpanah S, et al. Association of serum leptin level with obesity in children with acute lymphoblastic leukemia. Iran J Pediatr Hematol Oncol 2015; 5: 116–124.

68 

Egnell C, Ranta S, Banerjee J, et al. Impact of body mass index on relapse in children with acute lymphoblastic leukemia treated according to Nordic treatment protocols. Eur J Haematol 2020; 105: 797–807. doi: 10.1111/ejh.13517.

69 

Núñez-Enríquez JC, Gil-Hernández AE, Jiménez-Hernández E, et al. Overweight and obesity as predictors of early mortality in Mexican children with acute lymphoblastic leukemia: a multicenter cohort study. BMC Cancer 2019; 19: 708. doi: 10.1186/s12885-019-5878-8.

70 

Orgel E, Tucci J, Alhushki W, et al. Obesity is associated with residual leukemia following induction therapy for childhood B-precursor acute lymphoblastic leukemia. Blood 2014; 124: 3932–3938. doi: 10.1182/blood-2014-08-595389.

71 

Baumann H, Morella KK, White DW, et al. The full-length leptin receptor has signaling capabilities of interleukin 6-type cytokine receptors. Proc Natl Acad Sci U S A 1996; 93: 8374–8378. doi: 10.1073/pnas.93.16.8374.

72 

Brabant G, Horn R, von zur Mühlen A, et al. Free and protein bound leptin are distinct and independently controlled factors in energy regulation. Diabetologia 2000; 43: 438–442. doi: 10.1007/s001250051326.

73 

Friedman JM. Leptin and the endocrine control of energy balance. Nat Metab 2019; 1: 754–764. doi: 10.1038/s42255-019-0095-y.

74 

Pérez-Pérez A, Sánchez-Jiménez F, Vilariño-García T, Sánchez-Margalet V. Role of leptin in inflammation and vice versa. Int J Mol Sci 2020; 21: 5887. doi: 10.3390/ijms21165887.

75 

Abella V, Scotece M, Conde J, et al. Leptin in the interplay of inflammation, metabolism and immune system disorders. Nat Rev Rheumatol 2017; 13: 100–109. doi: 10.1038/nrrheum.2016.209.

76 

Banks AS, Davis SM, Bates SH, Myers MG Jr. Activation of downstream signals by the long form of the leptin receptor. J Biol Chem 2000; 275: 14563–14572. doi: 10.1074/jbc.275.19.14563.

77 

Kiernan K, MacIver NJ. The role of the adipokine leptin in immune cell function in health and disease. Front Immunol 2021; 11: 622468. doi: 10.3389/fimmu.2020.622468.

78 

Liu J, Lai F, Hou Y, Zheng R. Leptin signaling and leptin resistance. Med Rev 2021; 2: 363–384. doi: 10.1515/mr-2022-0017.

79 

Lin TC, Hsiao M. Leptin and cancer: updated functional roles in carcinogenesis, therapeutic niches, and developments. Int J Mol Sci 2021; 22: 2870. doi: 10.3390/ijms22062870.

80 

Hotamisligil GS, Shargill NS, Spiegelman BM. Adipose expression of tumor necrosis factor-alpha: direct role in obesity-linked insulin resistance. Science 1993; 259: 87–91. doi: 10.1126/science.7678183.

81 

Weisberg SP, McCann D, Desai M, et al. Obesity is associated with macrophage accumulation in adipose tissue. J Clin Invest 2023; 112: 1796–1808. doi: 10.1172/JCI19246.

82 

Lumeng CN, Bodzin JL, Saltiel AR. Obesity induces a phenotypic switch in adipose tissue macrophage polarization. J Clin Invest 2007; 117: 175–184. doi: 10.1172/JCI29881.

83 

Landgraf K, Rockstroh D, Wagner IV, et al. Evidence of early alterations in adipose tissue biology and function and its association with obesity-related inflammation and insulin resistance in children. Diabetes 2015; 64: 1249–1261. doi: 10.2337/db14-0744.

84 

McLaughlin T, Ackerman SE, Shen L, Engleman E. Role of innate and adaptive immunity in obesity-associated metabolic disease. J Clin Invest 2017; 127: 5–13. doi: 10.1172/JCI88876.

85 

Wang Q, Wang Y, Xu D. The roles of T cells in obese adipose tissue inflammation. Adipocyte 2021; 10: 435–445. doi: 10.1080/21623945.2021.1965314.

86 

Bapat SP, Liang Y, Zheng Y. Characterization of immune cells from adipose tissue. Curr Protoc Immunol 2019; 126: e86. doi: 10.1002/cpim.86.

87 

Nishimura S, Manabe I, Nagasaki M, et al. CD8+ effector T cells contribute to macrophage recruitment and adipose tissue inflammation in obesity. Nat Med 2009; 15: 914–920. doi: 10.1038/nm.1964.

88 

Kintscher U, Hartge M, Hess K, et al. T-lymphocyte infiltration in visceral adipose tissue: a primary event in adipose tissue inflammation and the development of obesity-mediated insulin resistance. Arterioscler Thromb Vasc Biol 2008; 28: 1304–1310. doi: 10.1161/ATVBAHA.108.165100.

89 

Kiran S, Kumar V, Murphy EA, et al. High fat diet-induced CD8+ T cells in adipose tissue mediate macrophages to sustain low-grade chronic inflammation. Front Immunol 2021; 12: 680944. doi: 10.3389/fimmu.2021.680944.

90 

Liao X, Zeng Q, Xie L, et al. Adipose stem cells control obesity-induced T cell infiltration into adipose tissue. Cell Rep 2024; 43: 113963. doi: 10.1016/j.celrep.2024.113963.

91 

Tourniaire F, Romier-Crouzet B, Lee JH, et al. Chemokine expression in inflamed adipose tissue is mainly mediated by NF-κB. PLoS One 2013; 8: e66515. doi: 10.1371/journal.pone.0066515.

92 

Mahlakõiv T, Flamar AL, Johnston LK, et al. Stromal cells maintain immune cell homeostasis in adipose tissue via production of interleukin-33. Sci Immunol 2019; 4: eaax0416. doi: 10.1126/sciimmunol.aax0416.

93 

Rausch ME, Weisberg S, Vardhana P, et al. Obesity in C57BL/6J mice is characterized by adipose tissue hypoxia and cytotoxic T-cell infiltration. Int J Obes (Lond) 2008; 32: 451–463. doi: 10.1038/sj.ijo.0803744.

94 

Sharma M, Boytard L, Hadi T, et al. Enhanced glycolysis and HIF-1α activation in adipose tissue macrophages sustains local and systemic interleukin-1β production in obesity. Sci Rep 2020; 10: 5555. doi: 10.1038/s41598-020-62272-9.

95 

Winer S, Chan Y, Paltser G, et al. Normalization of obesity-associated insulin resistance through immunotherapy. Nat Med 2009; 15: 921–929. doi: 10.1038/nm.2001.

96 

Deng T, Lyon CJ, Minze LJ, et al. Class II major histocompatibility complex plays an essential role in obesity-induced adipose inflammation. Cell Metab 2013; 17: 411–422. doi: 10.1016/j.cmet.2013.02.009.

97 

Hildreth AD, Ma F, Wong YY, et al. Single-cell sequencing of human white adipose tissue identifies new cell states in health and obesity. Nat Immunol 2021; 22: 639–653. doi: 10.1038/s41590-021-00922-4.

98 

Emont MP, Jacobs C, Essene AL, et al. A single-cell atlas of human and mouse white adipose tissue. Nature 2022; 603: 926–933. doi: 10.1038/s41586-022-04518-2.

99 

Dieme A, André S, Lapillonne H, et al. Characterization of lymphocyte profiles in children with syndromic obesity. Arch Pediatr 2023; 30: 212–218. doi: 10.1016/j.arcped.2023.02.009.

100 

Medeiros NI, Mattos RT, Menezes CA, et al. IL-10 and TGF-β unbalanced levels in neutrophils contribute to increase inflammatory cytokine expression in childhood obesity. Eur J Nutr 2018; 57: 2421–2430. doi: 10.1007/s00394-017-1515-y.

101 

Artemniak-Wojtowicz D, Rumińska M, Stelmaszczyk-Emmel A, et al. Inflammatory Th17 cells are correlated with insulin resistance and erythrocyte parameters in overweight and obese children. Front Endocrinol (Lausanne) 2024; 15: 1456203. doi: 10.3389/fendo.2024.1456203.

102 

Tobin LM, Mavinkurve M, Carolan E, et al. NK cells in childhood obesity are activated, metabolically stressed, and functionally deficient. JCI Insight 2017; 2: e94939. doi: 10.1172/jci.insight.94939.

103 

Bhaskaran K, Douglas I, Forbes H, et al. Body-mass index and risk of 22 specific cancers: a population-based cohort study of 5.24 million UK adults. Lancet 2014; 384: 755–765. doi: 10.1016/S0140-6736(14)60892-8.

104 

Wang KW, Souza RJ, Fleming A, et al. Adiposity in childhood brain tumors: a report from the Canadian Study of Determinants of Endometabolic Health in Children (CanDECIDE Study). Sci Rep 2017; 7: 45078. doi: 10.1038/srep45078.

105 

Sachdeva P, Ghosh S, Ghosh S, et al. Childhood obesity: a potential key factor in the development of glioblastoma multiforme. Life (Basel) 2022; 12: 1673. doi: 10.3390/life12101673.

106 

Ara T, Song L, Shimada H, et al. Interleukin-6 in the bone marrow microenvironment promotes the growth and survival of neuroblastoma cells. Cancer Res 2009; 69: 329–337. doi: 10.1158/0008-5472.CAN-08-0613.

107 

Orgel E, Genkinger JM, Aggarwal D, et al. Association of body mass index and survival in pediatric leukemia: a meta-analysis. Am J Clin Nutr 2016; 103: 808–817. doi: 10.3945/ajcn.115.124586.

108 

Pramanik R, Sheng X, Ichihara B, et al. Adipose tissue attracts and protects acute lymphoblastic leukemia cells from chemotherapy. Leuk Res 2013; 37: 503–509. doi: 10.1016/j.leukres.2012.12.013.

109 

Tucci J, Chen T, Margulis K, et al. Adipocytes provide fatty acids to acute lymphoblastic leukemia cells. Front Oncol 2021; 11: 665763. doi: 10.3389/fonc.2021.665763.

110 

Pasupuleti SK, Ramdas B, Burns SS, et al. Obesity-induced inflammation exacerbates clonal hematopoiesis. J Clin Invest 2023; 133: e163968. doi: 10.1172/JCI163968.

111 

Stone TW, McPherson M, Darlington LG. Obesity and cancer: existing and new hypotheses for a causal connection. EBioMedicine 2018; 30: 14–28. doi: 10.1016/j.ebiom.2018.02.022.

112 

Huang T, Song J, Gao J, et al. Adipocyte-derived kynurenine promotes obesity and insulin resistance by activating the AhR/STAT3/IL-6 signaling. Nat Commun 2022; 13: 3489. doi: 10.1038/s41467-022-31126-5.

113 

Folgiero V, Goffredo BM, Filippini P, et al. Indoleamine 2,3-dioxygenase 1 (IDO1) activity in leukemia blasts correlates with poor outcome in childhood acute myeloid leukemia. Oncotarget 2014; 5: 2052–2064. doi: 10.18632/oncotarget.1504.

Udostępnij
without publication fees