
Introduction
Inflammatory bowel disease (IBD) is chronic remitting and relapsing disease process characterised by immune-mediated inflammation of the gastrointestinal mucosa; it compromises two main conditions: Crohn’s disease (CD) and ulcerative colitis (UC), which share some common features, with different behaviours reflecting their distinctive patterns [1].
CD can affect any part of the bowel from the oral orifice to the anus, with predilection of the distal small bowel and caecum; the inflammatory process involves all layers from the mucosa to the serosa, with characteristic skip lesions along the whole length [2].
CD has a yearly rate of 3 to 20 cases per 100,000. The disorder tends to begin at the age of 30 years and has two peaks: one occurring at the 3rd and 4th decade, and another smaller peak at the age of 50 years, with slight male predominance [3].
The pathogenesis of CD may be explained by multiple factors including environmental, genetic, and immune factors.
Clinical presentation of CD includes both intestinal manifestations, such as abdominal pain, diarrhoea, weight loss, or fever, and extraintestinal manifestations, such as peripheral and axial arthritis, mucocutaneous manifestations, and eye manifestations, such as uveitis, scleritis, and episcleritis. Clinical subtypes of CD are categorised according to Montreal classification into inflammatory, stricturing, or penetrating [4].
Diagnosis of IBD depends on multiple domains: clinical, laboratory, and endoscopic. There are multiple laboratory markers as complete blood count (CBC), erythrocyte sedimentation rate (ESR), C-reactive protein (CRP), faecal calprotectin, faecal lactoferrin, mopterin, and neopterin [5]. In addition, several genes were identified by GWAS, from which some genes were confirmed to have a direct pathogenic effect, including NOD 2 gene, autophagy, and IL23/17, as well as other non-coding variations that has been identified, such as micro RNA (miRNA) and long non-coding RNAs (LncRNAs) [6, 7].
An ideal biomarker should be simple, rapid, cheap non-invasive, and reproducible with high sensitivity and specificity. Unfortunately, there is no single biomarker that has all these features, but studies are ongoing in the search for promising novel markers [8].
LncRNAs are transcripts consisting of more than 200 nucleotides that can be processed by RNA polymerase II. They can play a role in cellular organisation and control, such as DNA replication, RNA transcription, protein translation, cell growth, and cell differentiation [9–11].
Interferon gamma antisense 1 LncRNA is found near the IFN-encoding (IFNG) gene and is associated with susceptibility loci SNP rs7134599. This lncRNA is thought to be a critical checkpoint in the expression of IFNG in Th1 cells. In IBD patients’ intestinal mucosal tissues interferon gamma antisense-1 (IFNG-AS1) expression rises substantially [12, 13]. Signal transducer and activator of transcription 4 (STAT4) and T-box expressed in T cells (T-bet) are expressed in Th1 cells in response to IFNG-AS1. Several upstream inflammatory regulators, such as interleukin (IL) 1 (IL-1), IL-6, and interferon (IFN), are over expressed in individuals with IBD. These regulators trigger inflammation in Th1 cells. IFNG-AS1 may contribute to intestinal mucosal inflammation in IBD patients by modulating CD4+ T cell immune activity [14, 15].
Material and methods
The study included 50 subjects, divided as follows: Group I: Thirty patients with CD, subdivided into 2 subgroups: Group Ia included 15 patients with active CD; Group Ib included 15 patients with CD in remission. Disease activity was assessed clinically by Crohn’s disease activity index (CDAI) and endoscopically by the simple endoscopic activity score in Crohn’s disease (SES-CD). Group II: Control group, including 20 subjects with normal colonoscopy, who were indicated for colonoscopy for reasons other than IBD. Patients were recruited from the outpatient clinic, scheduled for colonoscopy or admitted in the inpatient ward of the Internal Medicine department at Alexandria Main University Hospital. Written informed consent was obtained from all included subjects. In the case of underage patients, written consent was obtained from the guardians. All procedures performed in the study involving human participants were in accordance with the ethical standards of the institutional research committee (Medical Research Ethics Committee of Alexandria, Faculty of Medicine, Egypt, IRB number 0106545/2020) and with the 1964 Helsinki Declaration and its later amendments or comparable ethical standards.
We excluded patients with gastrointestinal malignancy, autoimmune diseases such as rheumatoid arthritis, type 1 diabetes mellitus, coronary artery disease, and pregnancy. All patients were subjected to detailed history taking and thorough physical examination.
Laboratory investigations included routine laboratory investigations: a) CBC, ESR, quantitative CRP, serum albumin, renal function test, and liver function test; b) faecal markers: quantitative assessment of faecal calprotectin by ELISA; and c) determination of circulating lncRNA IFNG-AS1 using real-time quantitative RT-polymerase chain reaction (qRT-PCR).
The following steps showed the relative quantification of serum level of lncRNA IFNG-AS using real-time PCR [16, 17].
Total RNA isolation from serum samples was performed using Qiagen® miRNeasy Mini Kit (Cat. no. 217004) (Qiagen, Germany).
Complementary DNA (cDNA) was synthesised using High-Capacity cDNA Reverse Transcription Kit. (Applied Biosystems, USA) (Cat. no. Archive).
Real-time PCR was performed using Thermo Scientific Maxima SYBR Green qPCR Master Mix (2X) (Cat. no. K0251) (Thermo Scientific), and specific primers for lncRNA IFNG-AS1 and Glyceraldehyde 3-phosphate37 dehydrogenase (GAPDH) as an endogenous control (Applied Biosystems, USA).
Expression of lncRNA NFG AS-1 was calculated using the comparative cycle threshold (CT) method (2–DDCT).
CT Entero-colonography was done if needed. Ileocolonoscopy was done for all subjects, endoscopic findings were reported, endoscopic indices of activity had been assessed, and tissue specimens for histopathology confirmation of diagnosis and assessment of activity of disease were taken. Assessment of the disease activity in CD patients was performed clinically by CDAI. The CD activity index was first described in 1976, to assess disease severity based on clinical and laboratory data. The CDAI is divided into 8 domains, each of which assesses a different component of CD. Each domain’s score is weighted, and the total CDAI score is the sum of the 8 individual domain scores.
Statistical analysis
Data were fed to the computer and analysed using IBM SPSS software package version 20.0. (Armonk, NY: IBM Corp) Qualitative data were described using number and percent. The Kolmogorov-Smirnov test was used to verify the normality of distribution. Quantitative data were described using range (minimum and maximum), mean, standard deviation, median, and interquartile range (IQR). Significance of the obtained results was judged at the 5% level. The used tests were the c2 test, Fisher’s Exact correction, Student’s t-test, the Mann-Whitney test, and receiver operating characteristic curve (ROC).
Results
Regarding gender, Table I illustrates that no statistically significant difference exists between groups I and II (p = 0.405). The age in group I ranged from 18 to 58 years with mean ± SD 36.10 ±9.49 years, while in group II the age ranged from 22 to 58 years with mean ± SD 36.20 ±9.57 years, with no statistically significant difference (p = 0.971) between the two groups.
Table I
Comparison between the two studied groups according to demographic data
On studying IFN-G AS1 (2-∆∆cT), it was revealed that the median IFN-G AS1 (2-∆∆cT) level in group I was (1.43 pg/ml), which is markedly higher than the median in group II (0.74 pg/ml), with a statistically significant difference between the three groups (p = 0.025), as demonstrated in Table II.
Table II
Comparison of IFN-G AS1 (2-cT) levels between group I and group II
| IFN-G AS1 (2-∆∆cT) | Group I (n = 30) | Group II (n = 20) | U | P-value |
|---|---|---|---|---|
| Min.–max. | 0.03–625.99 | 0.24–1.38 | 187.0* | 0.025* |
| Mean ± SD | 70.10 ±150.55 | 0.70 ±0.34 | ||
| Median (IQR) | 1.43 (0.52–5.65) | 0.74 (0.41–0.92) |
Regarding IFN-G AS1 (2-∆∆cT) among cases, it was found that patients with active CD (Ia) had a median of 5.65 pg/ml, which is significantly higher than in patients with CD in remission (Ib) groups (0.52 pg/ml). Group Ia had significantly higher IFN-G AS1 (2-∆∆cT) compared to group Ib (p < 0.001) Table III.
Table III
Comparison between the two studied subgroups according to IFN-G AS1 (2-∆∆cT)
| IFN-G AS1 (2-∆∆cT) | Group Ia (n = 15) | Group Ib (n = 15) | U | P-value |
|---|---|---|---|---|
| Min.–max. | 1.57–625.99 | 0.03–1.30 | 0.000* | < 0.001* |
| Mean ± SD | 139.64 ±191.28 | 0.55 ±0.40 | ||
| Median (IQR) | 5.65 (2.48–198.1) | 0.52 (0.22–0.76) |
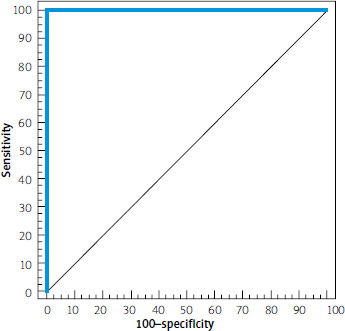
By using ROC-curve analysis, IFN-G AS1 (2-∆∆cT) can discriminate patients with active CD (n = 15) from patients with CD in remission at a cut-off value of 1.3. The sensitivity, specificity, PPV, and NPV were 100%, 100%, 100%, and 100%, respectively, (p < 0.001) (Figure 1).
Figure 1
ROC curve IFN-G AS1 (2-ΔΔcT) to discriminate patients with active Crohn’s disease (n = 15) from patients with Crohn’s disease in remission (n = 15)
Tables IV and V show the correlation between IFN-G AS1 (2-∆∆cT) with Simple Endoscopic Score (SES score) and CDIA in each group and some laboratory investigations.
Table IV
Correlation between IFN-G AS1 (2-∆∆cT) with SES score and CDIA in each group
| IFN-G AS1 (2-∆∆cT) vs. | Total group I (n = 30) | Group Ia (n = 15) | Group Ib (n = 15) | |||
|---|---|---|---|---|---|---|
| rs | P-value | rs | P-value | rs | P-value | |
| SES score | 0.860 | < 0.001* | 0.629 | 0.012* | 0.155 | 0.582 |
| CDIA | 0.854 | < 0.001* | 0.520 | 0.047* | 0.299 | 0.278 |
Table V
Correlation between IFN-G AS1 (2-∆∆cT) with laboratory investigations
Regarding correlation of IFN-G AS1 (2-DDcT) with other parameters, we found a positive correlation between IFN-G AS1 (2-DDcT) and CDAI, and a positive correlation with SES score.
Positive correlation was also found between IFN-G AS1 (2-DDcT) and ESR and CRP, while it had a negative correlation with haemoglobin level and serum albumin.
Discussion
LncRNAs have been implicated in the initiation and maintenance of the intestinal mucosal immunological barrier in IBD, according to many investigations [18]. Several LncRNAs are described in the pathogenesis of IBD as NEAT1. Nuclear paraspeckle assembly transcript 1 (NEAT1), H19, IFNG AS-1 affecting intestinal mucosal immune barrier.
Rankin et al. found that IFNG-AS1 is increased in patients with IBD compared to healthy controls or those with inactive IBD, which is consistent with our findings. However, IFNG-AS1 is considered to have three splice variants, and which splice variant is related with which illness remains unclear. Also, the study suggests that IFNG-AS1 is upregulated conditionally in patients with UC rather than constitutively. In individuals with IBD, IFNG-AS1 may be dysregulated in response to inflammation. Uncertainty persists, however, as to whether IFNG-AS1 may generate inflammation on its own, or whether it is a result of inflammation [19].
Also, in agreement with our results, the study by Padua et al. [20] reported that IFNG-AS1 was found to be statistically different between the two studied cohorts.
In agreement with our results, a study conducted on ANRIL and IFNG-AS1 proved that both are significantly expressed in the peripheral blood of individuals with colitis, suggesting that both may be implicated in its occurrence [21].
Finally, by using ROC-curve analysis, IFN-G AS1 (2–DDcT) can discriminate patients with CD from the control group with normal colonoscopy at a cut-off value of 0.92. The sensitivity, specificity, PPV, and NPV were 60%, 80%, 81.8%, and 57.1%, respectively (p = 0.025).
Also, via ROC-curve analysis, IFN-G AS1 (2-DDcT) can discriminate patients with active CD (n = 15) from patients with CD in remission at a cut-off value of 1.3. The sensitivity, specificity, positive predictive value (PPV), and negative predictive value (NPV) were 100%, 100%, 100%, and 100%, respectively (p < 0.001).
In the study by Huang et al. [21] according to ROC curve analysis, when the cut-off value was 0.725, the diagnostic sensitivity and specificity of IFNG-AS1 for colitis were 57.63% and 84.68%, respectively.
According to Li et al., long non-coding RNAs (lncRNAs) Mirt2 and interferon antisense RNA I (IFNGAS1) act as antagonistic moderators of inflammation in UC patients [22]. Mirt2 levels were found to be substantially lower in plasma from UC patients, but IFNG-AS1 levels were significantly greater (p < 0.05). The AUC for plasma IFNG-AS1 ROC curve was 0.84 (95% confidence range: 0.78–0.91; standard error = 0.035).
By analysing our results, we found a positive correlation between IFN-G AS1 (2-DDcT) and CDAI, as well as a positive correlation with SES score.
Positive correlation was also found between IFN-G AS1 (2-DDcT) and ESR and CRP, while it had a negative correlation with HB level and serum albumin.
These results are consistent with Raza et al. [23] who showed a significant correlation between IFN-g secretion by T cells in peripheral blood with disease severity in CD.
Conclusions
Serum IFNG AS-1 can be utilised as a diagnostic marker in CD patients. Serum IFNG AS-1 correlates well with disease activity indicators and can be used to measure disease activity in CD patients. Its measurement offers a unique, reliable biomarker that may be used to diagnose and monitor the degree of mucosal affection in CD. In future research, serum IFNG AS-1 may be investigated as a possible biomarker to evaluate therapy effectiveness utilising various treatment methods.