
Introduction
Trisomy 21 – Down syndrome (DS), is a genetic disorder that stems from the presence of all or part of an additional copy of chromosome 21. Down syndrome represents one of the most prevalent chromosomal abnormalities, leading to a wide array of physical, cognitive, and developmental complications. The observable traits and conditions associated with DS are incredibly diverse, ranging from distinct facial features and heart defects to varying degrees of intellectual disability. Over the years, a substantial body of research has underscored the intricate link between DS and oxidative stress [1–4]. The supplementary copy of chromosome 21 introduces an abundance of genes, which potentially can influence metabolic irregularities. Oxidative stress arises from an imbalance in the body’s cellular environment, characterized by an excess of pro-oxidants (measured as total oxidant status – TOS) compared to antioxidants (total antioxidant status – TAS). To gain a comprehensive understanding of oxidative stress, it is crucial to consider the oxidative stress index (OSI), a measure that represents the balance between the total antioxidant capacity and total oxidant status of the body. It is the ratio of TOS to TAS, and it provides a powerful tool for assessing the overall oxidative stress status. In individuals with DS, the oxidative stress is postulated to be elevated due to an effect known as the gene-dosage effect, triggered by the overexpression of the superoxide dismutase, a key antioxidant enzyme located on chromosome 21 [5]. Increased oxidative stress plays a critical role in the pathophysiology of numerous diseases and can significantly impact the health and well-being of individuals with DS. Moreover, DS is also associated with various metabolic changes, particularly reflected in body mass, as well as alterations in fasting glucose and insulin levels [6–9]. Body weight is best assessed by the body mass index (BMI). When it comes to children and adolescents, interpreting BMI goes beyond the conventional metrics used for adults. It’s important to consider that children’s body composition varies with age and differs between sexes. Therefore, in pediatric populations, it’s essential to use adjusted measurements, such as BMI Standard Deviation Scores (BMI SDS), to accurately interpret BMI. The metabolic shifts can significantly influence the health status of individuals with DS, potentially leading to a spectrum of metabolic disorders. Despite the wealth of research, understanding these metabolic shifts’ full breadth and the relationship they share with oxidative stress in DS individuals is still a nascent field. While DS research has made considerable strides in understanding the disorder’s physiological implications, there are still gaps. In particular, there is a dearth of comprehensive, comparative studies on the profile of oxidative stress, BMI, and metabolic changes between young people with DS and their non-DS siblings. Siblings without DS provide a unique control group due to their significant shared genetic and environmental influences with the DS individuals, offering an opportunity for a more precise understanding of trisomy 21’s impact on these parameters.
Aim of the study
This study embarks on a thorough comparative analysis of oxidative stress indicators (TAS, TOS, OSI), BMI, BMI standard deviation score (BMI SDS), HOMA-IR and fasting glucose and insulin levels in children and adolescents with DS, as opposed to their non-DS siblings. The goal is to uncover a deeper understanding of the biological complexities of DS, which may guide clinical practices and spark novel therapeutic approaches.
Materials and methods
Study design and participants
The participants comprised a study group (SG) of 42 children and adolescents with DS (DS) (17 females, with a mean age of 14.17 ±6.66 years old), and a control group (CG) of 20 siblings of the individuals with DS (10 females, with a mean age of 15.92 ±8.58 years old). The study protocol adhered to the principles of the Declaration of Helsinki, and the Bioethics Committee of Wroclaw Medical University approved it (KB 674/2020). The inclusion criteria for the SG were patients diagnosed with DS (due to genetic test results) while for the CG, it was being a sibling of an individual SG. There were no specific exclusion criteria. Written informed consent was obtained from the parents or legal guardians of all the participants prior to the data collection and anthropometric measurements. Administrative approvals were also secured from each institution involved to access the necessary participants’ data.
Data collection
Participants were actively recruited from various regions across Poland. Upon receiving written informed consent from the parents or guardians, these recruited children and adolescents were invited for an anthropometric examination and blood collection in a pediatric clinic located in Wroclaw, Poland.
Anthropometric measurements
Anthropometric parameters, specifically body height, and weight, were collected during these examinations. The measurements were obtained by a team of trained personnel, composed of two doctors (including the authors of this study) and the pediatric nurse. They followed standardized techniques to ensure the consistency and reliability of the measurements [10]. These standardized techniques were reviewed and agreed upon prior to the initiation of the study. Body weight and height were recorded using standardized techniques and devices. Participants were weighed using electronic digital scales (OMRON BF-515), with light clothing and barefoot, with measurements to the nearest 0.1 kg. Body height was measured to the nearest 0.1 cm using a stadiometer (SECA 264). The trained personnel ensured the correct body posture of the child during the measurement: straight back, both feet on the ground, and the back of the body pressed against the wall. The same devices were used for all measurements, and conditions were kept consistent throughout the study. BMI was subsequently calculated using the traditional formula: weight (kg) divided by the square of height (m2).
BMI Standard Deviation Score (SDS) calculation
Body mass index was converted into SDS using the LMSGrowth Calculator [11], a Microsoft Excel add-in. The calculator applies the LMS method to fit centiles and SDS into the collected data [12]. The LMSGrowth program uses the British 1990 growth reference charts, which were used as the standard for this study [13, 14]. For the purposes of this study, the following BMI percentile (BMI PC) ranges were adopted: < 3rd PC (underweight), 3rd–90th PC (norm), 90–97th PC (overweight), and > 97th PC (obesity). For the 30% of our participants who were over the age of eighteen (the oldest had 34 years), their data were referenced to the maximum age on the percentile grids, which is 18 years. This adjustment allowed us to include these individuals in the study while maintaining consistency in the use of the growth charts.
Homeostasis Model Assessment (HOMA-IR) Index
The HOMA-IR, a method used to quantify insulin resistance and β-cell function, was calculated from fasting glucose and insulin concentrations using the following formula:
HOMA-IR = (fasting insulin concentration (uIU/ml) × fasting glucose concentration (mmol/l)) / 22.5.
The denominator “22.5” is a normalizing factor derived from the product of fasting glucose and insulin concentrations in healthy individuals. This formula provides an estimate of insulin resistance (HOMA-IR) when the β-cell function is at 100%. HOMA-IR values above 2.5 indicate insulin resistance. To systematically present the results, the following classification was adopted: less than 2.5 is considered a physiologically normal result, while a result greater than 2.5 is generally seen as abnormal.
Laboratory methods
Subsequent to the anthropometric measurements, venous blood samples were collected from the participants by the qualified pediatric nurse. These biological samples were then processed and examined for TAS, TOS, fasting glucose, and insulin in the laboratory of Wroclaw Medical University. To assess metabolic control, both fasting glucose and insulin levels were examined in the study participants. After an overnight fast of at least 8 hours, blood samples were collected from all participants in both groups. The TAS and TOS were expressed as equivalents of Trolox [mmol/l] [15].
Fasting glucose and insulin
The fasting blood glucose levels were results expressed in milligrams per deciliter (mg/dl). The normal reference range for children’s fasting glucose is typically between 70–100 mg/dl [16]. Fasting insulin levels were determined by a radioimmunoassay method. The insulin levels were measured in micro international units per milliliter (μIU/ml), with normal fasting insulin levels in children typically falling below 15 μIU/ml [17].
Oxidative stress index (OSI) calculation
Oxidative stress index was computed as the ratio of TOS to TAS. The OSI formula used for this calculation was: OSI = (TOS / TAS) × 100. This calculation was performed for each individual participant in both groups.
Data analysis
Data analysis was performed utilizing Statistica version 13 software. The normality of the data distribution was assessed using the Shapiro-Wilk test. Subsequent analyses were guided by the results of this normality test. In instances where the data followed a normal distribution, the Student’s t-test was employed. Alternatively, when data exhibited a non-normal distribution, the Mann-Whitney U test was utilized. To identify relationships between variables, correlation matrices were created. Pearson’s correlation was employed for data with a normal distribution, whereas Spearman’s correlation was used for data with a non-normal distribution. The level of statistical significance was set at p < 0.05.
Results
The investigation observed significant disparities in various health parameters between SG and CG. Primary data encompassing the demographic details of the study and control groups, along with the assessed parameters, are presented in Table I.
Table I
Group demographic characteristics
BMI SDS and BMI percentiles
Regarding BMI, the DS group showed a higher average BMI (22.20 kg/m2) than the CG (20.20 kg/m2). Similarly, the average BMI Standard Deviation Score (BMI SDS) for the DS group was 0.79, whereas it was –1.19 for the CG. The comparison of the BMI percentile (BMI PC) was higher for the DS group than in the CG (70.56 vs. 60.97). We observed no significant differences between the two groups when comparing BMI (p = 0.2005), BMI SDS (p = 0.1264), and BMI PC (p = 0.1282). Further percentile calculations based on BMI SDS and LMSGrowth (Table II) for the DS group indicate that while 2 individuals (4,76%) were underweight (below the 3rd percentile), the majority (21 individuals; 50%) fell within the normal range (3rd to 90th percentile). However, a significant proportion was overweight (11 individuals [29,19%] in the 90th to 97th percentile range) and obese (8 individuals [19,05%] exceeding the 97th percentile). When the same percentile calculations (Table II) were applied to the CG, a notably lower prevalence of overweight and obesity was found. While one individual (5%) was underweight (below the 3rd percentile), the majority (15 individuals; 75%) fell within the normal range (3rd to 90th percentile). Only three individuals (15%) were overweight (90th to 97th percentile) and one (5%) was classified as obese (above 97th percentile). The observed trends underline a generally lower prevalence of overweight and obesity in the CG compared to the SG.
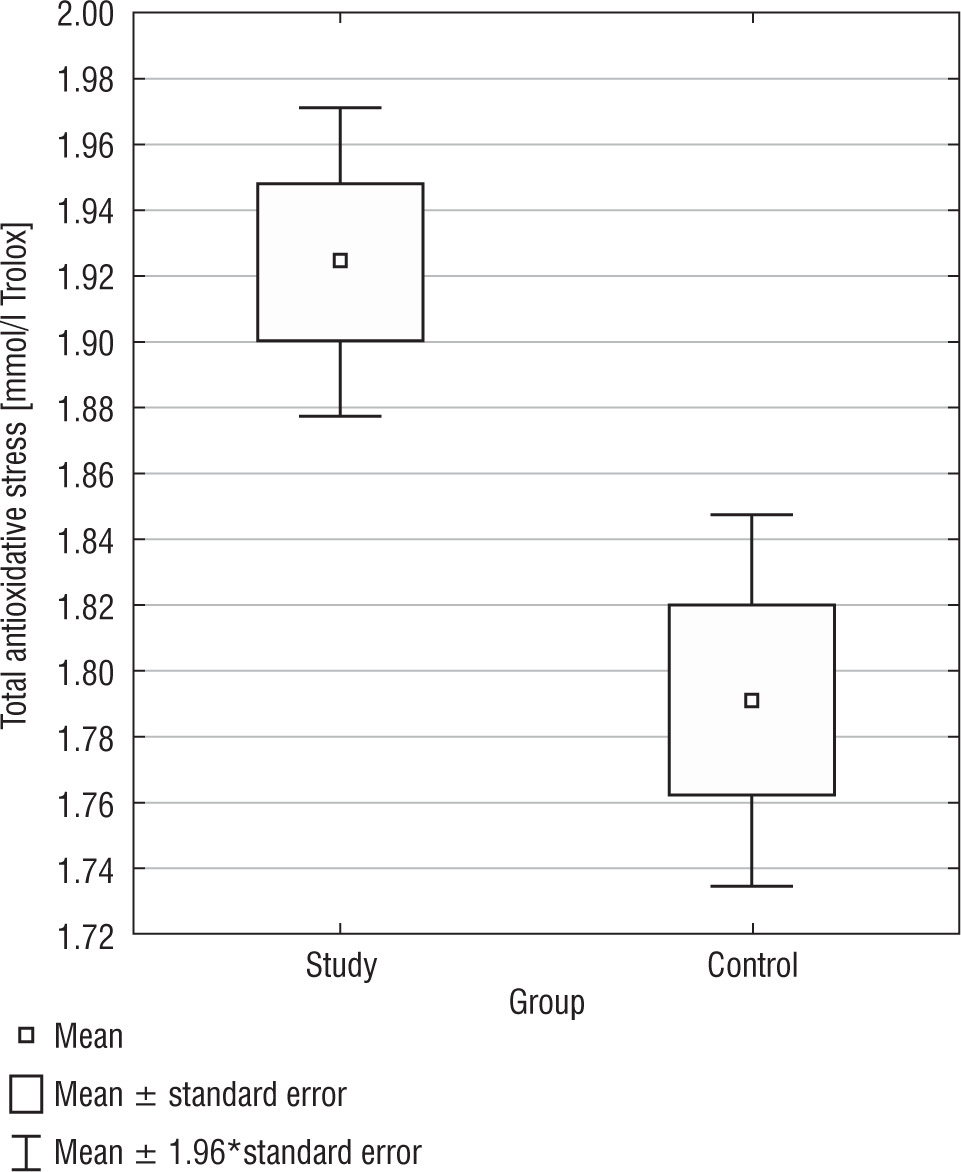
Total antioxidant status
Total antioxidant status presented noticeable differences between the DS group and the control group. The DS group exhibited a higher TAS median as opposed to the CG (1.92 mmol/l vs. 1.79 mmol/l; 1.92 mmol/l vs. 1.83 mmol/l) (p = 0.0015) (Fig. 1). Only in the CG, a positive correlation was found between BMI and TAS (r = 0.4459), but not in the SG. In Table I, basic statistics related to TAS are presented.
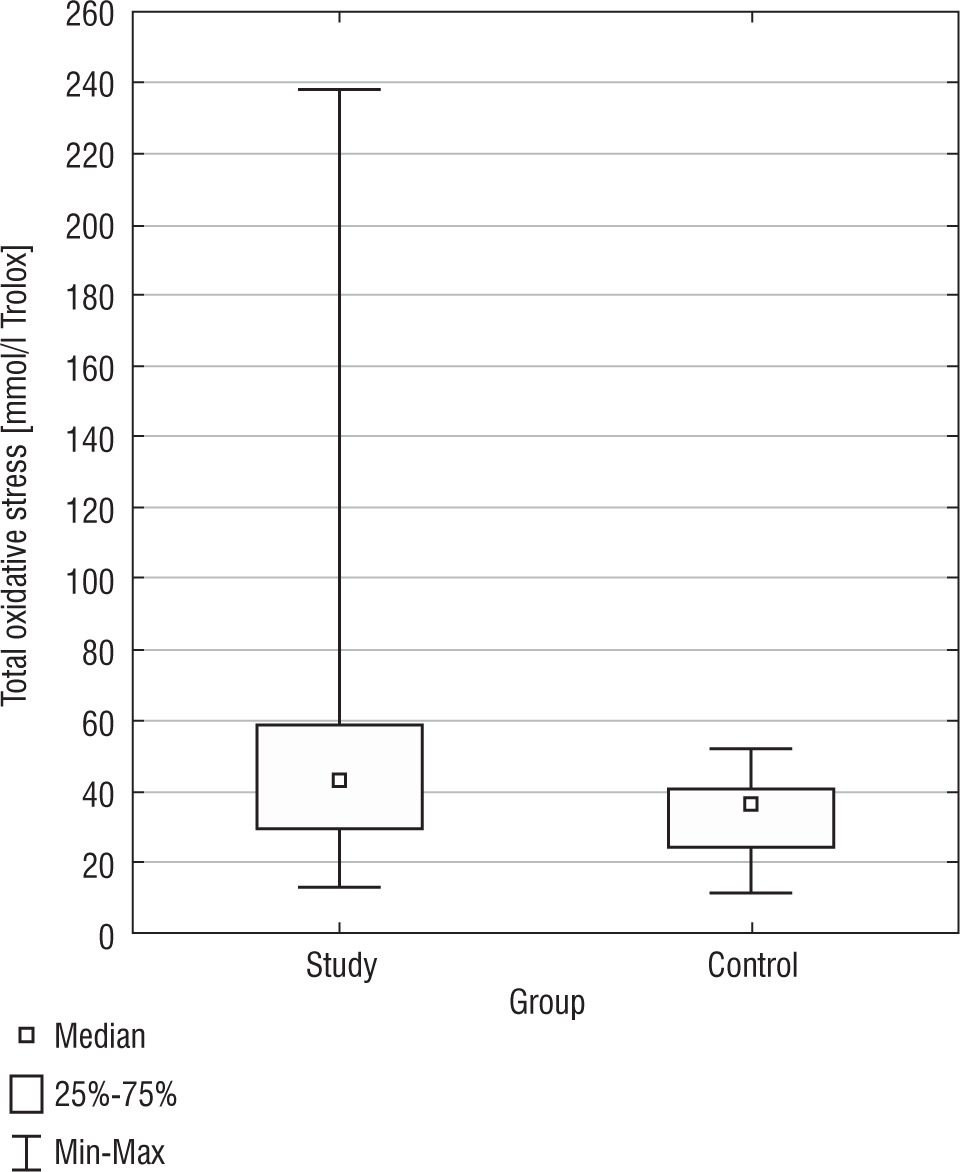
Total oxidant status
Total oxidant status exhibited a statistically significant difference between the SG and the CG (p = 0.0147) (Fig. 2). The DS group had a higher TOS median than the CG (51.52 mmol/l vs. 33.05 mmol/l; 42.85 mmol/l vs. 35.93 mmol/l). In terms of variability, the DS group displayed a higher standard deviation for TOS (37.43 mmol/l) compared to the CG (11.01 mmol/l), suggesting greater variation in TOS values among the DS group. The confidence intervals for the standard deviation in the DS group (30.73 mmol/l to 47.90 mmol/l) and the CG (8.37 mmol/l to 16.07 mmol/l) did not overlap, indicating the observed difference in TOS variability between the groups is statistically significant. There was a negative correlation between BMI and TOS (r = –0.3957) in the DS group. In Table I basic statistics related to TOS are presented.
Oxidative stress index
Oxidative stress index, a measure of the overall oxidative stress status, demonstrated a statistically significant difference (p = 0.0388) between the SG and CG (Fig. 3). The median OSI for the SG was also higher (2475.02) than the CG (1949.75). The confidence intervals for the standard deviation in the DS group (1602.81 to 2497) and the CG (481.45 to 924.66) did not overlap, signifying the observed difference in OSI variability between the groups is statistically significant. In Table I, basic statistics related to OSI are presented. We identified a negative correlation in the DS group between BMI and OSI (r = –0.3925) (Table III).
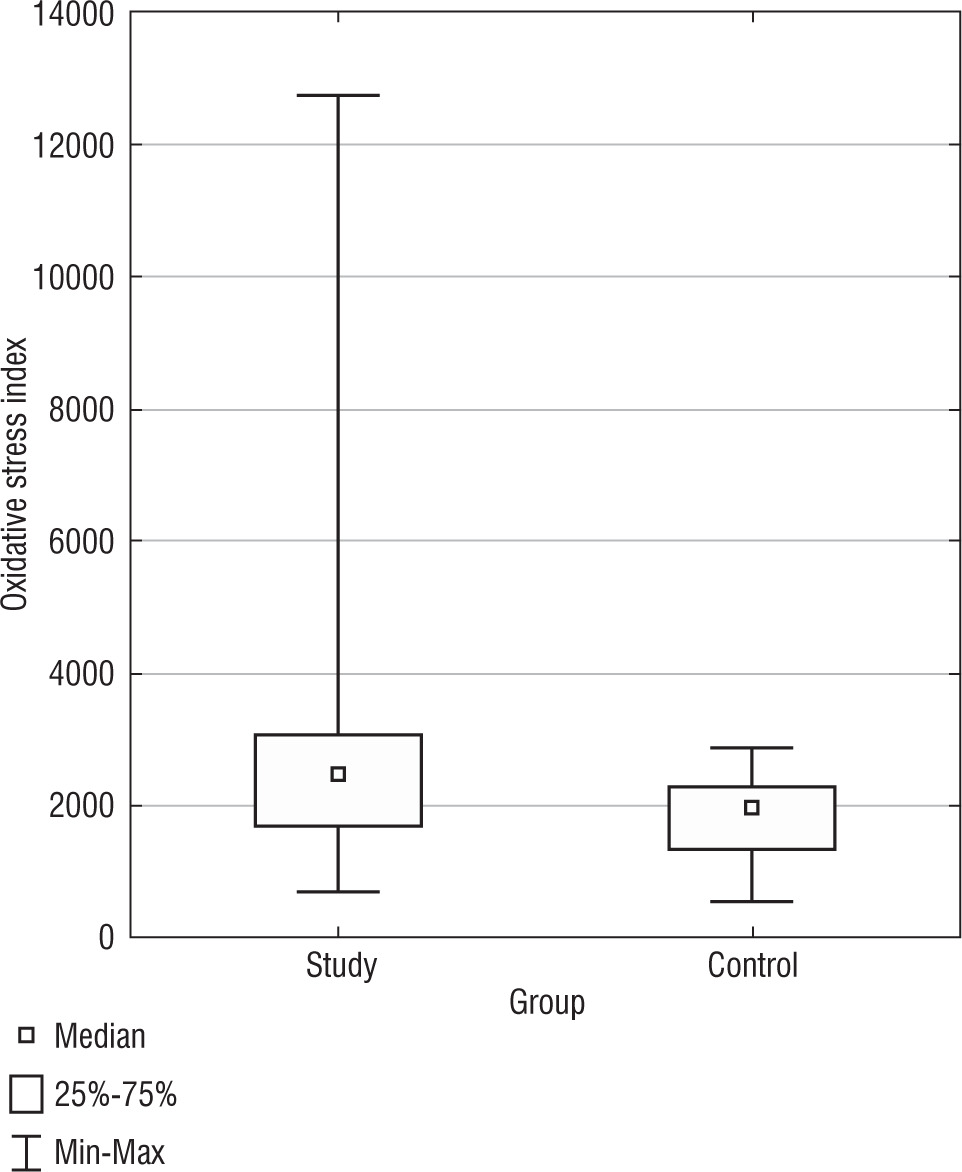
Table III
Correlation matrix of BMI, fasting glucose, fasting insulin, TAS, TOS, OSI and HOMA-IR Index
Fasting glucose and insulin
The analysis of fasting glucose levels revealed no statistically significant difference (p = 0.9327) between the SG and CG (Fig. 5). In the CG, but not in the SG, there was a negative correlation between BMI and fasting glucose levels (r = –0.4887).
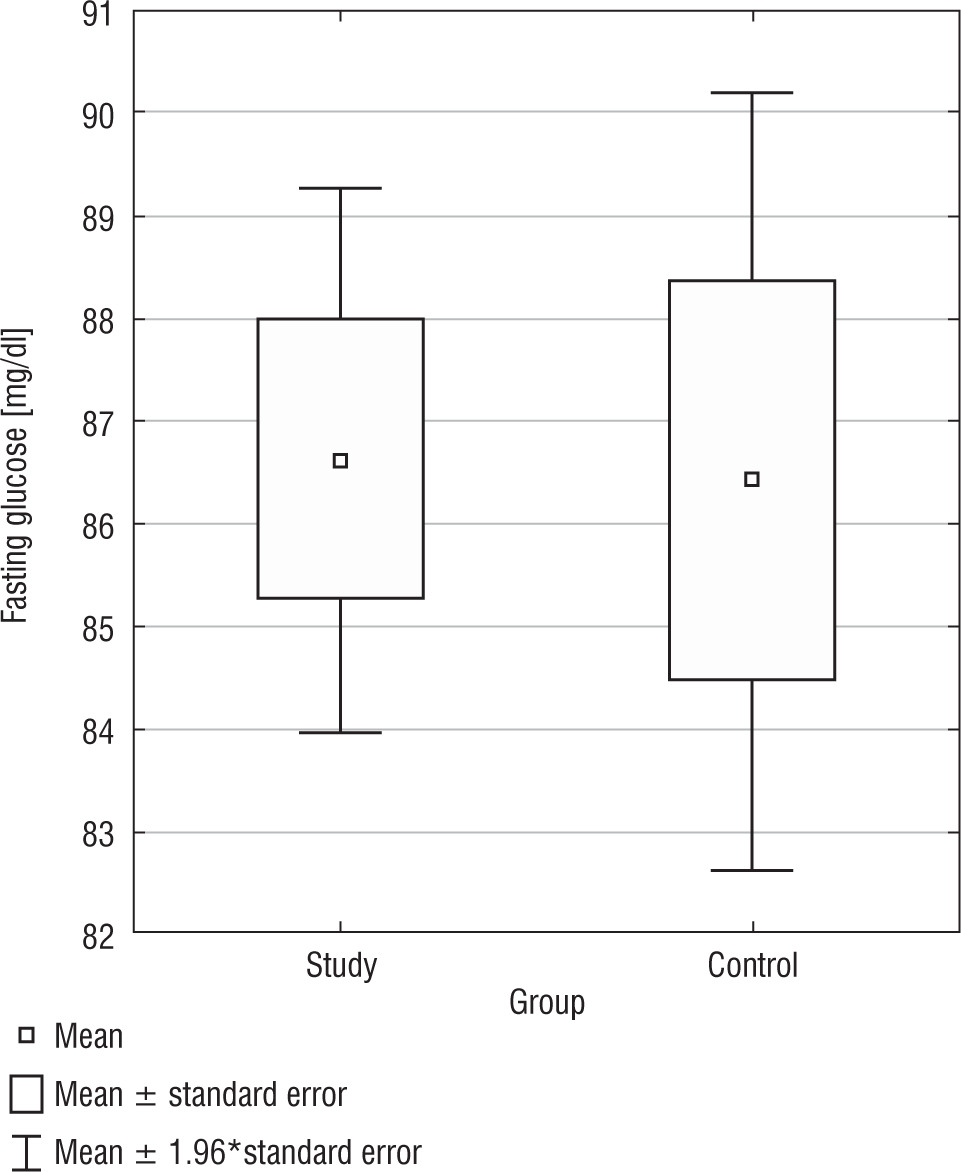
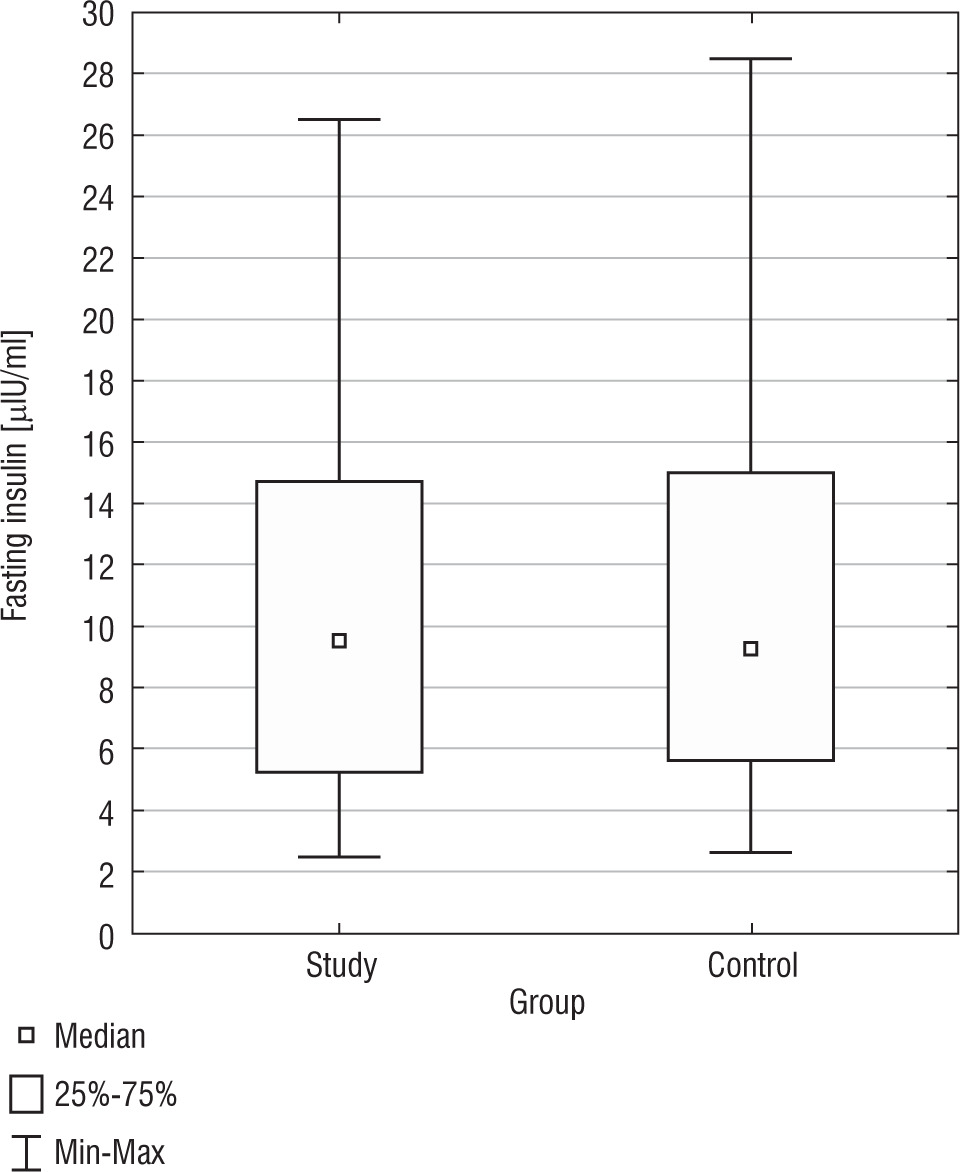
The analysis of fasting insulin levels showed no statistically significant difference between the SG and CG (p = 0.9459) (Fig. 5). Additionally, in the DS group, there was a positive correlation between BMI PC and fasting insulin levels (r = 0.3580) (Table III). Only in the CG, we found a positive correlation between fasting insulin levels and fasting glucose levels (r = 0.5468). In both, the study and control groups, no statistically significant correlations were found between fasting glucose and TAS, TOS, OSI; as well as between fasting insulin and TAS, TOS, OSI. In Table I, basic statistics related to fasting glucose and insulin are presented.
HOMA-IR
In the SG the mean value of HOMA-IR was 2.29 ±1.37. No statistically significant difference was detected between the two groups (p = 0.6930). In Table I, basic statistics related to HOMA-IR are presented. Notably, several statistically significant relationships: positive between HOMA-IR and BMI SDS (r = 0.4348), HOMA-IR and BMI PC (r = 0.4369), and negative HOMA-IR and TOS (r = –0.4605), OSI (r = –0.3692) (Table III). In the CG, a positive statistically significant correlation was found between HOMA-IR and insulin, which is expected given that the HOMA-IR is calculated based on fasting insulin and glucose.
Discussion
Considering the link between obesity and metabolic disorders like insulin resistance, type 2 diabetes, and heart diseases, especially in those with DS, is crucial. Their higher obesity rates call for strategies to prevent excessive weight gain. This includes lifestyle changes like a balanced diet, regular exercise, and weight management. Early obesity detection can prevent severe metabolic issues. Given the DS group’s unique metabolic traits, personalized obesity management is essential, as a generic approach might not meet their specific needs. In terms of BMI, despite the DS group showing higher mean BMI, BMI SDS and BMI PC values than their siblings in the CG, these differences did not reach statistical significance. This might suggest that environmental factors, shared by siblings, such as diet and activity level, play a considerable role in determining BMI, regardless of the presence of DS. However, when analysing the distribution of individuals within specific BMI categories, a distinct trend emerged. The DS group had a noticeably higher proportion of individuals categorized as overweight and obese, based on BMI SDS and BMI PC. Approximately half of the individuals in the DS group were within the normal range, but a significant proportion was overweight and obese. This is concerning and indicates an increased risk of weight-related health issues. Conversely, in the CG, composed of the siblings of the DS group, there was a considerably lower prevalence of overweight and obesity. This sharp contrast underlines the potential impact of DS on weight gain and distribution, beyond the shared environmental factors within families. The higher prevalence of overweight and obesity in the DS group compared to their siblings could potentially be attributed to various factors, including genetic predisposition, metabolic variations, differences in physical activity, or other DS-related health conditions. This is in line with previous studies showing that individuals with DS are at a higher risk of being overweight and obese, potentially due to factors such as hypotonia, reduced physical activity, and altered metabolism [18, 19]. The redox status, reflecting the balance between oxidants and antioxidants in the body, plays a pivotal role in maintaining physiological homeostasis. Our exploration of TAS, TOS and OSI revealed significant variations between the DS group and the CG, highlighting notable differences in their oxidative balance. The DS group consistently showed higher values across these measures, suggesting a distinct oxidative profile that might be shaped by inherent genetic condition. These findings emphasize the importance of monitoring oxidative stress markers in individuals with DS, as it could have far-reaching implications for their health outcomes. Oxidative stress has been implicated in various aspects of DS, such as intellectual disability and premature aging, suggesting the relevance of managing oxidative stress in this population [20–24]. Despite differing oxidative markers, the DS group’s fasting glucose and insulin levels didn’t significantly differ from their non-DS siblings. The degree of insulin resistance, gauged by HOMA-IR, also did not show a significant difference in the DS group, although a higher incidence of abnormal HOMA-IR was reported. Correlation findings suggest a complex interplay between BMI, oxidative stress, and metabolic indicators in DS individuals, with a higher BMI potentially associated with a lower oxidative stress state. These results highlight DS’s complexity, where increased oxidative stress can coexist with certain preserved metabolic processes like glucose and insulin homeostasis. Alternatively, the elevated BMI observed in the DS group could potentially be a consequence of adaptive physiological responses to heightened oxidative stress. The correlations observed indeed suggest a complex interplay between BMI, oxidative stress parameters (TOS and OSI), and metabolic indicators. While we must be cautious in drawing causal relationships from correlation data, the trends offer some interesting avenues for interpretation and further exploration. The negative correlation between BMI and oxidative stress parameters in the DS group might suggest that oxidative stress parameters decrease as BMI increases. This could potentially be due to a protective mechanism, wherein individuals with higher BMI produce more antioxidants to mitigate the damaging effects of oxidative stress. Adipose tissue has been shown to express antioxidant enzymes and may play a role in modulating oxidative stress [25, 26]. However, it is also possible that the increased oxidative stress observed in individuals with DS could stimulate physiological changes that result in increased BMI. Chronic oxidative stress has been linked with inflammation and insulin resistance, which can drive changes in metabolism and energy storage, potentially leading to increased body weight [27–29]. The positive correlation between BMI percentile and fasting insulin in the DS group may imply increasing insulin resistance as BMI rises. However, in the CG, a negative correlation between BMI and fasting glucose was observed, suggesting fasting glucose levels increase as BMI decreases – a seemingly counterintuitive finding given that higher BMI often correlates with increased glucose levels due to insulin resistance. This unexpected result calls for further investigationThe positive correlation between BMI and TAS in the CG could potentially suggest that as BMI increases, so does the antioxidant status. The multifaceted and intricate interplay between BMI, oxidative stress parameters, and metabolic indicators in individuals with DS uncovered in the study reinforces the necessity for continued research in this area to elucidate the mechanisms underlying these correlations. Future studies could explore these relationships in greater depth, potentially incorporating longitudinal designs, larger sample sizes, and more diverse participant groups. The observed positive link between BMI percentile and fasting insulin in the DS group suggests that higher BMI could increase insulin resistance risk. In contrast, the CG showed an inverse correlation between BMI and fasting glucose, and a positive correlation between fasting insulin and glucose, indicating a normal insulin response. A positive correlation between BMI and TAS may mean that as BMI increases, antioxidant activity rises potentially to offset metabolic stress. These interactions underscore the complex relationship between genetic, environmental, and metabolic factors in DS and potential risk factors for future health complications. In the conducted study, BMI had an impact on many laboratory parameters. It’s important to remember that entire families should be involved in the problem of controlling excessive body weight [30, 31].
Limitations and strengths of the study
This study, unique in comparing DS children to their non-DS siblings, provides broad insights into their health and potential genetic and environmental influences. It identifies meaningful correlations that contribute to DS research and future healthcare management, setting the stage for more studies. Limitations include a small sample size potentially affecting results’ power and applicability, possible bias from using non-DS siblings as controls, uncontrolled variables like diet and physical activity, and lack of established causality from correlations. Single-point measurements may not reflect long-term health. However, acknowledging these constraints strengthens the study’s credibility and guides future research.
Conclusions
Despite similar family environments, DS children and adolescents were more often overweight, suggesting DS’s role in weight gain. They showed higher oxidative stress values, indicating a distinct redox state, potentially impacting their health. Even with comparable fasting glucose and insulin levels to the CG, the DS group showed higher incidences of abnormal HOMA-IR values, suggesting potential insulin resistance. There were complex correlations between HOMA-IR, BMI, and oxidative stress, suggesting protective mechanisms or potential risks in DS. The link between higher BMI and fasting insulin in DS may indicate a risk of insulin resistance. These findings emphasize the need for further research and tailored health strategies for DS individuals.


