
Introduction
Atherosclerosis is a chronic inflammatory disease, marked by the accumulation of lipids and fibrous materials within arterial walls, leading to cardiovascular disease (CVD) – one of the major health concerns worldwide. The development of this disease is influenced by a combination of genetic factors, environmental exposures, and various metabolic processes. Notably, lipid metabolism plays a significant role. Excessive levels of low-density lipoprotein cholesterol (LDL), known as “bad cholesterol”, accumulate in arterial walls, forming the basis of atherosclerotic plaque [1]. Conversely, high-density lipoprotein (HDL), termed “good cholesterol”, helps in removing cholesterol from arterial plaques, directing it towards elimination from the body [2]. The relationship between apolipoprotein A1 (APO A1) and apolipoprotein B (APO B) is crucial in understanding atherosclerotic risk [2]. Besides, emerging studies have highlighted the roles of homocysteine (HCY) and lipoprotein(a) (LP(a)) in vascular health, given their correlation with arterial damage and atherosclerosis [3, 4].
Metabolomics, which focuses on identifying and quantifying small molecules in biological samples, has become instrumental in cardiovascular research [5–12]. Through metabolomics, researchers can gain a clearer picture of the numerous metabolic processes taking place at a cellular level. In the context of atherosclerosis, this approach has identified new pathways and molecules of interest [13–16]. Specific metabolites, including acetate, choline, and xanthine, might offer insights into the relationship between Down syndrome (DS) metabolism and atherosclerosis [17–19].
There’s a notable gap in our understanding when considering unique populations like those with trisomy 21 (DS). Historically, individuals with DS display a reduced incidence of atherosclerosis [20, 21], but the metabolic reasons behind this remain elusive.
This study seeks to fill the knowledge gap by providing a comprehensive evaluation of the lipid profiles and related metabolites in individuals with DS. We aimed to discern whether the DS population (study group; DS) is at a heightened risk for atherosclerosis and, by extension, CVD, by comparing their lipid and metabolomic profiles to a control group (CG) – their siblings.
Material and methods
Study design and participants
The participants comprised a study group (DS) of 42 children and adolescents with DS (17 females; mean age of 14.17 ±7 years old) and the control group (CG) of 20 siblings of the individuals with DS (10 females; mean age of 15.92 ±9 years old). The study protocol adhered to the principles of the Declaration of Helsinki, and the Bioethics Committee of Wroclaw Medical University approved it (KB 674/2020). The inclusion criteria for the DS were patients diagnosed with DS (due to genetic test results) while for the CG, it was being a sibling of an individual DS. There were no specific exclusion criteria. Written informed consent was obtained from the parents or legal guardians of all the participants before the data collection and anthropometric measurements. Administrative approvals were also secured from each institution involved to access the necessary participants’ data.
Data collection
Participants were actively recruited from various regions across Poland. Upon receiving written informed consent from the parents or guardians, these recruited children and adolescents were invited for an anthropometric examination and blood collection in a pediatric clinic located in Wroclaw, Poland.
Anthropometric measurements
The methodology and procedures for anthropometric measurements have been detailed in our prior research [22].
BMI Standard Deviation Score (SDS) and Tri-Ponderal Mass Index (TMI) Calculation
BMI was converted into SDS in line with our previously outlined methodologies [20]. The TMI was calculated according to the methodology described by Peterson et al. [23]. For this study, the threshold to determine elevated TMI was set at the 95th percentile – specifically, values surpassing 18.8 kg/m3 were considered elevated for boys, while for girls, the 95th percentile value was set at 19.7 kg/m3 [23]. Before proceeding with the TMI analysis, participants aged below 7 years were excluded from the dataset. This led to the exclusion of nine individuals: 6 from the DS and 3 from the CG. Upon extending the analysis of the TMI to a larger cohort, we incorporated participants older than 18 years by categorizing them within the 17-year-old bracket. This methodological choice was made to expand our sample size and assess broader patterns without the age restrictions strictly imposed by the traditional TMI guidelines [23].
Biochemical tests
All laboratory parameters were determined under fasting conditions. For lipid profile routine laboratory methods were used. APO A1 and APO B were measured by immunotubidimetric method with goat anti-human apolipoprotein A1 antibody and anti-human apolipoprotein B antibody, respectively, whereas for Lp(a) determination particle enhanced immunoturbidimetric test was applied. Homocystein was measured with Diazyme Laboratories, Poway, USA reagent kit on the Konelab 20i analyser (ThermoScientific, Vantta, Finland). The research results were analyzed according to the established reference ranges presented in Table I.
Table I
Reference ranges used for result interpretation
Metabolomic tests
Samples
Metabolomic studies were conducted at the Department of Biochemistry, Molecular Biology, and Biotechnology, Faculty of Chemistry, Wroclaw University of Science and Technology. Serum samples were received from the Medical University of Wroclaw and were stored at –80°C before analysis.
Samples preparation
The volume of 300 µl serum was transferred into the new Eppendorf tube. To each sample, 600 µl of methanol was added. After 1 min mixing, the samples were stored at –20°C for 20 min and centrifugated (15 min, 11000 rpm, 4°C). Next, 750 µl of supernatant was transferred into the new Eppendorf tube, and samples were evaporated (1100 rpm, 4.5 h, 40°C). After that, 600 µl of PBS buffer (0.5 M, 50% D2O, pH = 7.4, TSP = 0.03 mM) were added to each sample and mixed for 3 min. After centrifugation (5 min, 11000 rpm, 4°C), 550 µl of solution were transferred into 5-mm NMR tubes (Norell®) for measurements. Before analysis, the samples were stored at 4°C.
1H NMR spectroscopy analysis of the bacterial metabolites
Standard 1H NMR experiments were performed on a Bruker AVANCE II 600.58 MHz spectrometer equipped with a 5 mm NMR probe at 298 K. All one-dimensional 1H NMR spectra were carried out using the noesy1dpr (in Bruker notation) pulse sequence by suppression of water resonance by presaturation. Acquisition parameters were as follows: spectral width, 19.82 ppm; the number of scans, 128; acquisition time, 2.75 s per scan; relaxation delay, 3.5 s; and time-domain points, 65.5 K. The spectra were referenced to the TSP resonance at 0.0 ppm and manually corrected for phase and baseline (MestReNova v. 14.0.2).
Data processing and multivariate statistical data analysis
Data analysis was performed utilizing Statistica version 13 software. The normality of the data distribution was assessed using the Shapiro-Wilk test. Subsequent analyses were guided by the results of this normality test. In instances where the data followed a normal distribution, the Student’s t-test was employed. Alternatively, when data exhibited a non-normal distribution, the Mann-Whitney U test was utilized. To identify relationships between variables, correlation matrices were created. Pearson’s correlation was employed for data with a normal distribution, whereas Spearman’s correlation was used for data with a non-normal distribution. The level of statistical significance was set at p < 0.05. All spectra were exported to Matlab (Matlab v. 8.3.0.532) for preprocessing. Regions affected by solvent suppression were excluded (4.7–5.1 ppm) and alignment procedures involving the correlation of optimized warping (COW) and interval correlation shifting (icoshift) algorithms were applied [24, 25]. The spectra consisted of 8910 data points and were normalized using the probabilistic quotient method to overcome the issue of dilution [26]. The multivariate and statistical data analysis were performed on a set of the 30 assigned metabolites (methanol wasn’t included in the analysis, because it was used for the extraction). The concentration of metabolite measured by NMR was obtained as the sum of the intensities of the no-overlapping resonances (or a part of partly overlapping resonances). The input for SIMCA-P software was a transformed data matrix (v 17.0.2, Umetrics, Umeå, Sweden). The data sets were unit variance scaled before the chemometric analysis. For T21 samples, principal component analysis (PCA), and partial least square analysis (OPLS) were carried out. The OPLS-DA model reliability was tested with CV-ANOVA at the level of significance of α < 0.05. Univariate analysis was performed by the use of MATLAB software (v R2014a, Mathworks Inc.) by use of Student’s t-test (equal/unequal variance) for data originated from a normal distribution, and Mann-Whitney-Wilcoxon test was performed for data that does not meet these requirements. The normality of distribution was assessed by the Shapiro-Wilk test. The Student’s t-test was performed for metabolites recurring in both samples. The correction for multiple comparisons was preceded by the Benjamini-Hochberg procedure (FDR). All univariate statistics were carried out at the level of significance of α < 0.05.
Results
Anthropometric data
BMI: The DS demonstrated a higher mean BMI and BMI SDS than the CG. Despite the absence of significant statistical disparities, it’s imperative to highlight the contrast in overweight and obesity prevalence: about half of the DS group compared to just 20% in the CG. This accentuates the prominent weight concerns in the DS group. For a comprehensive view, refer to Tables II and IV.
TMI: The mean TMI for the DS was significantly higher than the CG (16.22 ±4.04 kg/m3 vs. 13.67 ±1.59 kg/m3; p = 0.02) emphasizing a potential concern regarding body fat distribution within the DS compared to the CG.
Table II
Comparative parameters analyzed for the DS and CG
[i] DS – study group; CG – control group; N – amount of participants; SD – standard deviation; BMI – body mass index; SDS – standard deviation scores; PC – percentiles; TCH – total cholesterol; HDL – high-density lipoprotein; LDL – low-density lipoprotein; TG – triglycerides; PO A1 – apolipoprotein A1; APO B – apolipoprotein B; HCY – homocysteine; Lp(a) – lipoprotein(a); APO B/APO A1 – ratio; TMI – tri-ponderal mass index
Biochemical tests
Basic descriptive statistics are presented in Table II. Percentage data regarding specific parameters in both groups are presented in Table III.
Table III
Group demographic characteristics
HDL: The DS displayed a significantly lower concentration compared to the CG (46.88 ±10.37 mg/dl vs. 59.19 ±12.28 mg/dl; p = 0.0001). Triglycerides (TG): The DS had a noticeably elevated median TG level than the CG (87.02 mg/dl vs. 63.34 mg/dl; p = 0.0588). LDL: A heightened concentration was observed in the DS when juxtaposed with the CG (104.30 ±25.41 mg/dl vs. 89.78 ±22.43 mg/dl; p = 0.0331). APO A1: The DS exhibited a markedly lower concentration than the CG (119.64 ±20.17 mg/dl vs. 158.21 ±40.61 mg/dl; p = 0.000005).
Other parameters: Statistical examination revealed no significant contrasts between DS and CG for TCH (p = 0.3747); APO B (p = 0.1612); HCY (p = 0.5320); Lp(a) (p = 0.3466), APO B/APO A1 Ratio (p = 0.3466).
Differential correlations between DS and CG
The correlation patterns among the various parameters can be found in Table V.
Homocysteine: Present in DS with correlations to body metrics, absent in CG; HDL: In DS, mainly correlated with APO A1; in CG, correlated with age and BMI; TCH: DS had multiple correlations (e.g., LDL, APO B, Lp(a)); CG’s were fewer and included age; APO B: In DS, primarily linked to lipids; in CG, showed broader links including age and body metrics; APO A1: DS correlations centered around lipids; in CG, they were more diverse, involving HDL, TCH, TG, LDL, APO B; LDL: DS showed correlations including APO B and Lp(a); CG had fewer, like age; APO B/APO A1 Ratio: In DS, both positive and negative correlations were seen, including TCH and BMI metrics. In CG, it was mainly linked to Lp(a).
Table IV
Percentage distribution of participants in the study and control groups across different BMI categories
| Group | N | < 3rdPC | 3–90thPC | 90–97thPC | > 97thPC | ||||
|---|---|---|---|---|---|---|---|---|---|
| Underweight | Normal weight | Overweight | Obese | ||||||
| n % | n % | n | % | n | % | ||||
| Study | 42 | 2 | 4,76 | 21 | 50 | 11 | 26,19 | 8 | 19,05 |
| Control | 20 | 1 | 5 | 15 | 75 | 3 | 15 | 1 | 5 |
Table V
Correlation matrices in DS and CG
[i] DS – study group; CG – control group; BMI – body mass index; SDS – standard deviation scores; PC – percentiles; TCH – total cholesterol; HDL – high-density lipoprotein; LDL – low-density lipoprotein; TG – triglycerides; APO A1 – apolipoprotein A1 ; APO B – apolipoprotein B; HCY – homocysteine; Lp(a) – lipoprotein(a); APO B/APO A1 – ratio
Metabolomics
In total, 31 metabolites were identified (3-hydroxybutyrate, acetate, acetone, alanine, choline, creatinine, ethanol, formate, glucose, glutamine, glycine, histidine, isobutyrate, isoleucine, lactate, leucine, lysine, methionine, methylamine, oxypurinol, phenylalanine, proline, pyroglutamate, pyruvate, succinate, threonine, tryptophan, tyrosine, valine, xanthine, methanol). All assignments were verified using the following databases (HMDB). Information about a chemical shift for each metabolite is available in Table VI. The representative 1H NMR spectrum is presented below (Fig. 1).
Table VI
Statistical analysis of metabolite levels: distinguishing between Study Group (DS) and Control Group (CG) using p-value and FDR criteria
Figure 1
The representative 1D 1H NMR spectra of T21 sample (1 – 3-hydroxybutyrate, 2 – acetate, 3 – acetone, 4 – alanine, 5 – choline, 6 – creatinine, 7 – ethanol, 8 – formate, 9 – glucose, 10 – glutamine, 11 – glycine, 12 – histidine, 13 – isobutyrate, 14 – isoleucine, 15 – lactate, 16 – leucine, 17 – lysine, 18 – methionine, 19 – methylamine, 20 – oxypurinol, 21 – phenylalanine, 22 – proline, 23 – pyroglutamate, 24 – pyruvate, 25 – succinate, 26 – threonine, 27 – tryptophan, 28 – tyrosine, 29 – valine, 30 – xanthine, 31 – methanol)

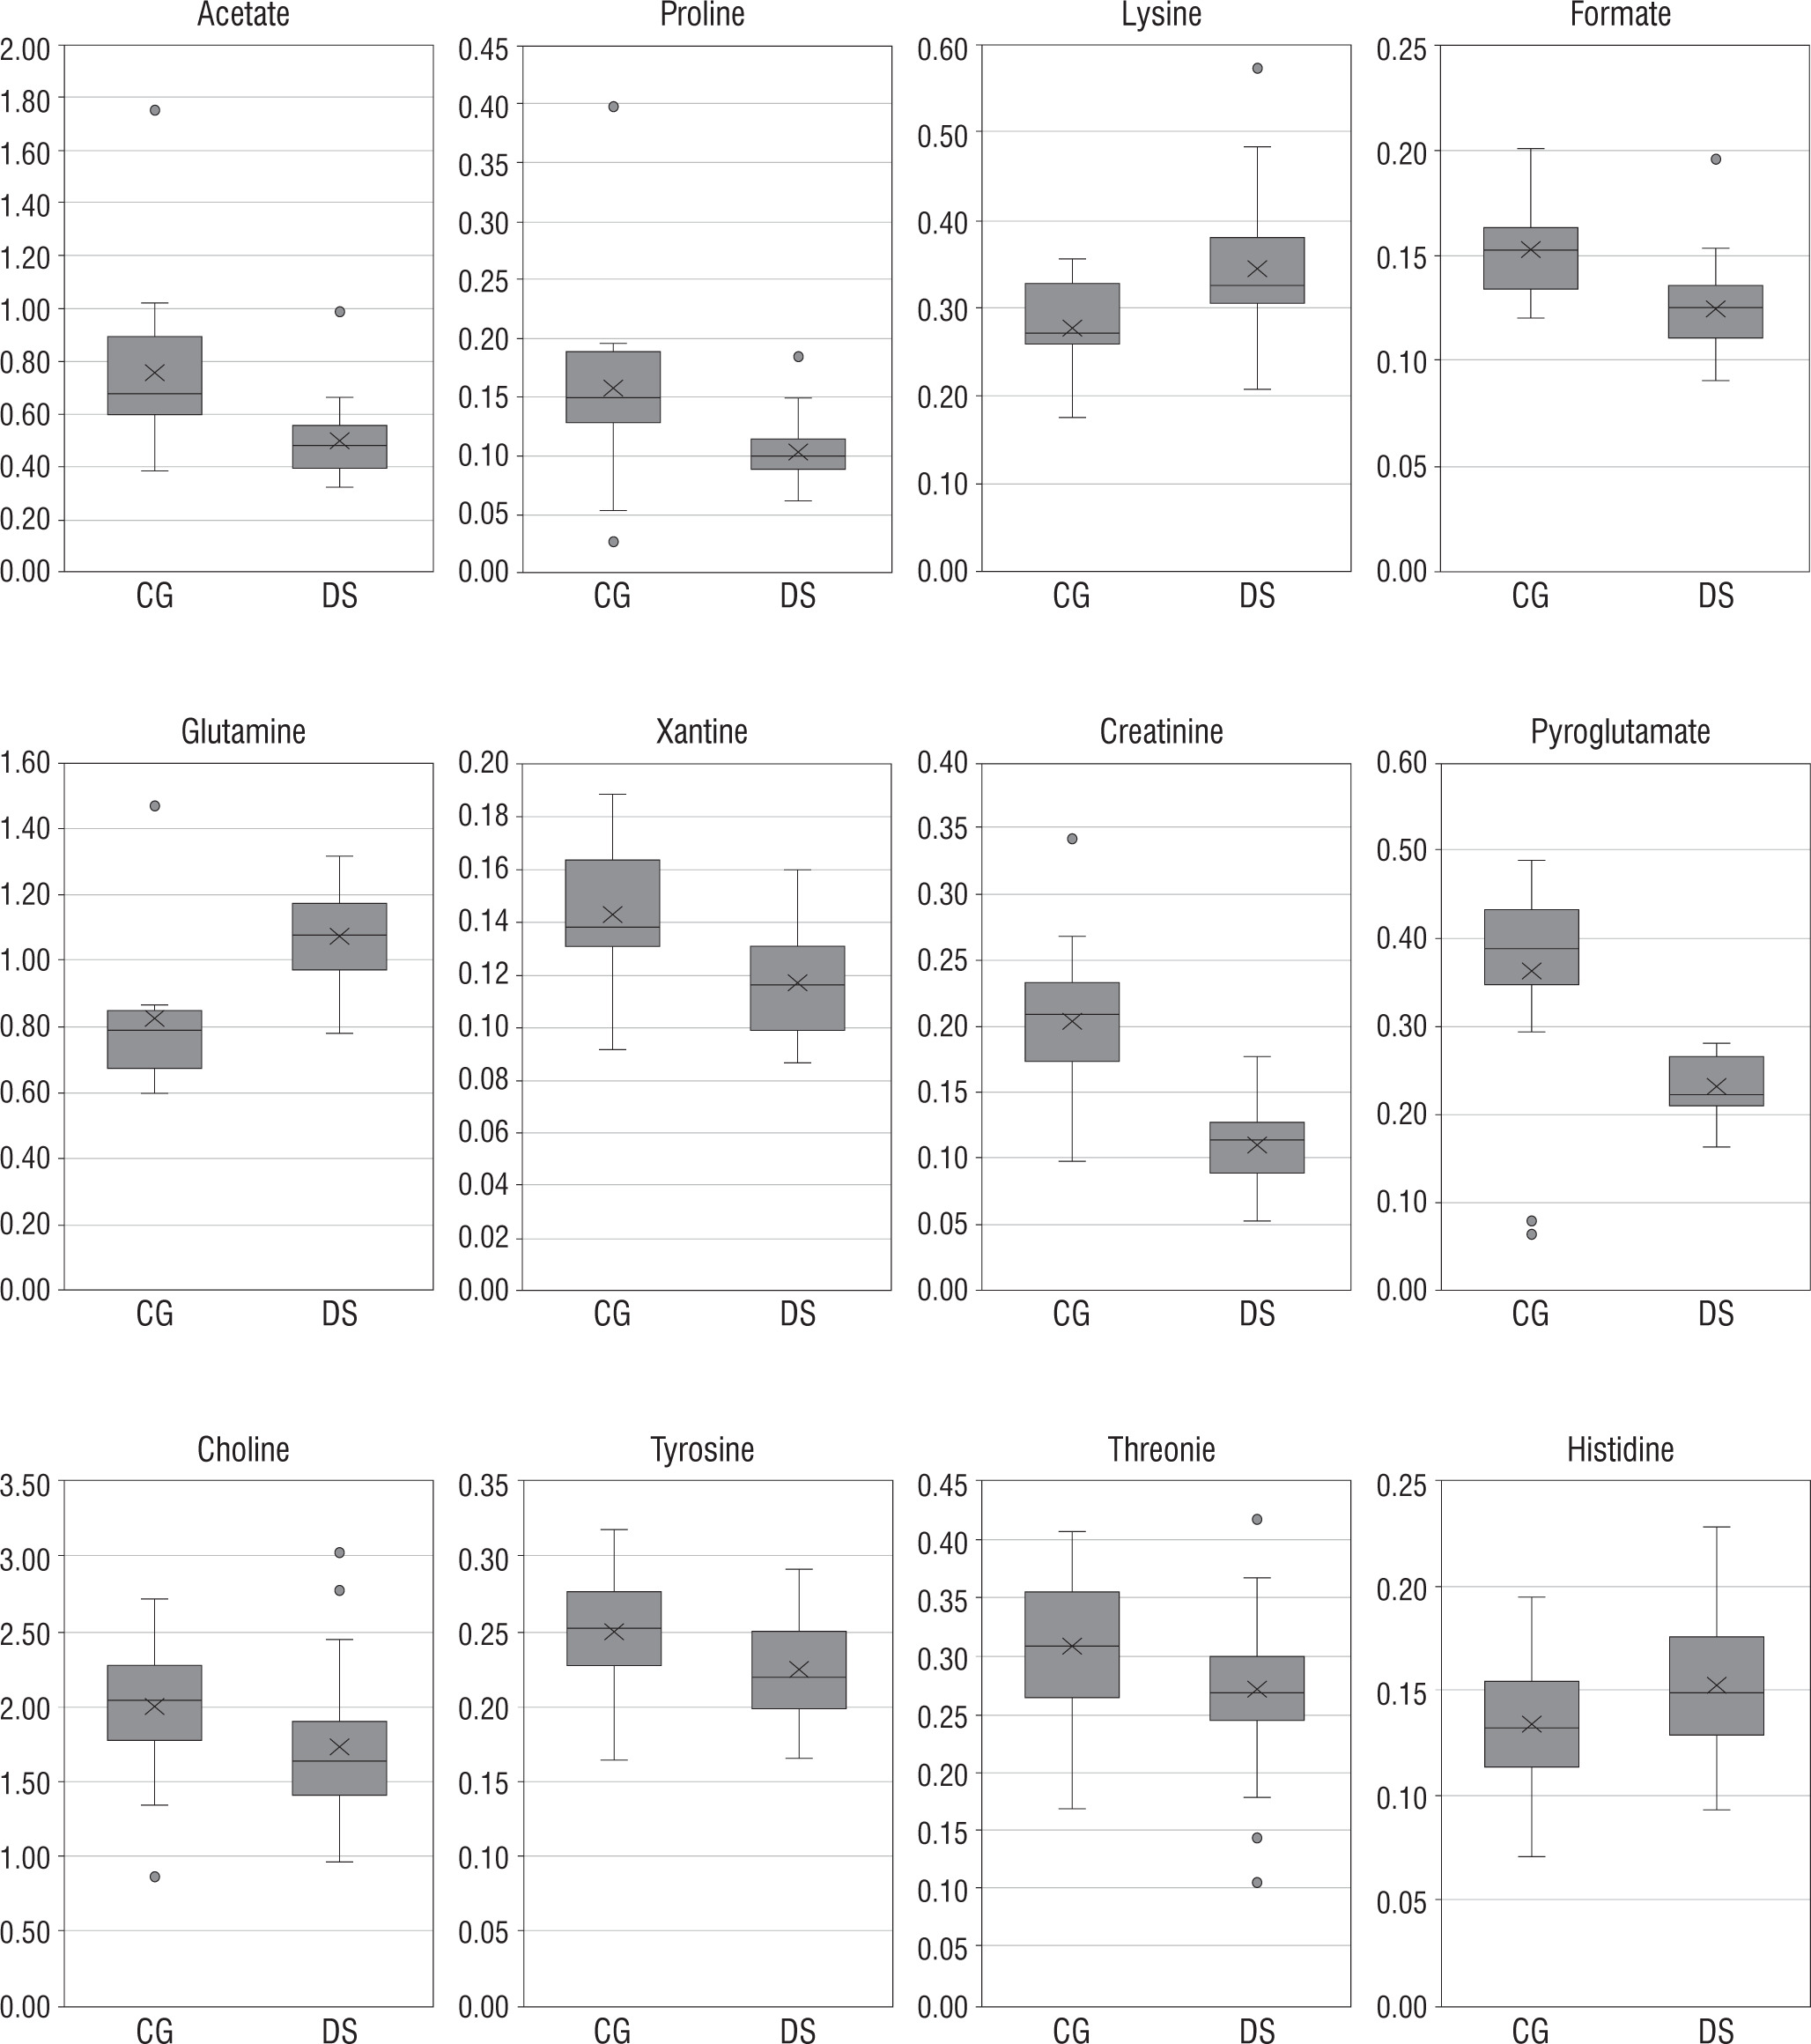

Metabolites relative concentration and statistical analysis
For each metabolite, relative concentration and standard deviation were obtained. Statistical analysis was performed to obtain statistically important metabolites. Two groups were compared – Study Group (DS; 39 samples) and the Control Group (CG; 20 samples) (Table VI). The results showed that 12 metabolites were statistically important according to p-value (acetate, choline, creatinine, formate, glutamine, histidine, lysine, proline, pyroglutamate, threonine, tyrosine, and xanthine), while only 8 metabolites were statistically important according to FDR results, where choline, tyrosine, threonine, and histidine didn’t pass the Benjamini-Hochberg procedure
Discussion
The findings of this study provide an elucidative insight into the biochemical and metabolic parameters that might predispose children and young adults with DS to atherosclerosis and subsequent CVD.
BMI implications on health profiles
The DS group displayed a higher tendency towards overweight and obesity compared to the CG group, a trend linked to considerable health risks including cardiovascular and metabolic issues [27, 28]. The heightened prevalence of increased weight in the DS population points to their potential vulnerability to related health complications [29, 30]. In contrast, the CG group showed a more balanced BMI, possibly due to a mix of metabolic, genetic, and lifestyle factors [31]. It is critical to recognize that being underweight, although less common in both groups, can also lead to health issues [32]. To analyze adolescent body fat distribution more accurately, the study introduced the TMI metric [23]. This method suggests the DS group might be prone to dangerous fat distribution patterns, indicative of greater health risks including visceral fat accumulation. The findings emphasize the need for targeted interventions and monitoring strategies to counter potential health threats.
HDL-cholesterol and its cardiovascular implications
The DS group exhibited notably lower HDL cholesterol levels compared to their CG siblings, potentially increasing their risk of cardiac issues due to the associated higher likelihood of developing atherosclerosis, a precursor to CVD [33]. However, the HDL distribution was similar between the two groups, suggesting that both groups might still benefit from the cardiovascular protective features generally associated with optimal HDL properties. It’s important to consider not just the HDL concentration but also its functionality, which includes aspects like particle size and antioxidant enzymes, in assessing its cardioprotective potential [34, 35].
LDL-cholesterol: atherogenic risk
The DS group showed a significant increase in LDL levels compared to the CG group, which is worrisome given that LDL-cholesterol is a well-established indicator for cardiovascular risk and even slight elevations can substantially increase this risk over time [36, 37]. These elevated levels could mean a higher susceptibility to arterial plaque build-up and consequently, a greater risk of CVD [38]. The observed discrepancy prompts further exploration into the metabolic or genetic factors in individuals with DS that might be causing these higher LDL levels, indicating a potential predisposition to atherosclerotic developments [39].
Triglycerides: a borderline concern
While our study reveals an approaching significance in TG levels between the DS and CG. Elevated TG levels have been universally recognized as a marker for cardiovascular risk [40]. In the DS population, understanding the particular significance of these levels is crucial due to their unique metabolic and genetic profiles. A seminal paper by Capone et al. [39] highlighted the increased frequency of congenital heart disease among individuals with DS. With such a pre-existing predisposition, even borderline variations in TG levels can compound potential risks.
Balancing atherogenic and anti-atherogenic particles
The DS group exhibited significantly lower APO A1 levels compared to the CG group, which corroborates with the reduced HDL cholesterol findings and indicates a diminished defensive mechanism against atherosclerosis [41, 42]. Further, the DS group had a higher APO B/APO A1 ratio, revealing an increased predisposition to cardiovascular risks as this ratio serves as a recognized predictor of such risks [43]. Despite a distinct difference in the mean ratios between the groups, it was observed that a larger percentage of the DS group had ratios above the norm, highlighting a noticeable shift towards higher values and emphasizing the augmented risk of CVD in the DS group.
Other parameters
While TCH, APO B, HCY, and Lp(a) did not display pronounced differences between the two groups, a deeper analysis into their distributions can reveal nuanced disparities [44]. Even if average values appear similar, the proportion of individuals within or outside the recommended ranges can vary significantly between groups [45]. This underscores the importance of evaluating both overarching trends and individual data distributions to comprehensively understand cardiovascular health in the DS [46]. Such patterns hint at the potential for hidden cardiovascular risks, even when overall averages seem reassuring, emphasizing the need for a holistic assessment approach [47].
Interconnected metabolic relationships: insights from correlation patterns in study and control groups
In the DS group, homocysteine’s connection to body metrics hints at a relationship between body composition and metabolic implications for cardiovascular health. There is a notable complex relationship between the APO B/APO A1 ratio and various health markers, emphasizing the necessity for a comprehensive view of metabolic health. In the CG, age appears to significantly influence lipid metabolism, impacting various lipid and apolipoprotein markers and consequently cardiovascular risk assessment. The observed relationships between different lipid markers, such as the interplay between APO A1 and other markers, suggest a balanced lipid regulatory environment and reiterate LDL’s central role in cholesterol transport. Moreover, associations between HDL and factors like age and BMI necessitate further investigation into the effects of lifestyle or dietary habits on beneficial cholesterol. The connection between the APO B/APO A1 ratio and Lp(a) also indicates underlying lipid metabolic pathways deserving of further study.
Discussion on metabolomic analysis in the context of atherosclerosis and cardiovascular disease risk
Twelve out of 31 metabolites showed significant differences between the DS and CG groups, but applying the Benjamini-Hochberg procedure for FDR correction highlighted eight metabolites with physiological relevance, offering a deeper understanding of potential health implications. Acetate variations point to altered lipid metabolism, which is associated with the formation of atherosclerotic plaques and increased CVD risks [48, 49]. Creatinine fluctuations indicate that apart from kidney function, muscle metabolism and its impact on cardiac performance should be considered [50]. Format is linked with amino acid metabolism and hints at changes in methylation pathways that, when disrupted, can lead to vascular inflammation and early atherosclerosis. Glutamine, crucial for protein synthesis and cellular energy, suggests broader metabolic shifts potentially affecting vascular health and stress responses [51, 52]. Lysine is vital for collagen synthesis essential for arterial wall structure, and its deficiency could result in weaker arterial walls prone to plaque accumulation [53, 54]. Proline, also involved in collagen production, can affect vessel flexibility, with inconsistent levels potentially leading to hypertension and early atherosclerosis stages [55]. Pyroglutamate plays a role in glutamate metabolism, possibly influencing vascular tone and responsiveness. Xanthine oscillations reflect purine metabolism state, where increased uric acid levels are associated with higher risks of hypertension and vascular inflammation, raising CVD risks [4]. These insights suggest a complex interplay of various metabolic pathways influencing cardiovascular health in the DS group.
Oxidative stress and its implications in DS
Oxidative stress is a known contributor to the pathogenesis of atherosclerosis and CVD. Relevant to this discussion is our previous work where we demonstrated that individuals with DS exhibit higher levels of oxidative stress compared to their siblings without DS [22]. This increased oxidative stress in the DS population might be a significant factor contributing to their distinctive cardiovascular risk profile.
Conclusions
Individuals with DS demonstrate distinct cardiovascular risk profiles, marked by reduced HDL cholesterol and heightened LDL cholesterol levels, pointing to an increased susceptibility to atherosclerosis and CVD. Their metabolomic analysis further emphasizes potential metabolic imbalances that could predispose them to vascular complications. Moreover, a pronounced tendency towards elevated BMI and TMI in DS group signals additional health challenges. It can be concluded that individuals with DS might be at a greater risk of developing atherosclerosis compared to the CG.


