
Introduction
Colorectal cancer (CRC) is the second most common cancer among females in Poland and the third most common in males. Surgery is the main and most efficient form of CRC treatment. Unfortunately, despite a Poland-wide colonoscopy-based CRC screening program since 2000 [1], a significant percentage of CRC is diagnosed in the advanced and progressive stages of the disease. In this phase of the disease, a substantial proportion of the patients may be malnourished, and their nutritional status may deteriorate further during adjuvant chemotherapy, which can also be more toxic for patients with low lean and skeletal muscle mass [2, 3]. Moreover, symptoms that are common in patients with CRC, such as anorexia, diarrhoea, and constipation, may also affect patients’ nutritional status and their fluid balance. Malnourished patients are at higher risk of perioperative mortality, surgical and non-surgical complications, especially infections, and greater length of in-hospital stay [4]. These adverse outcomes result mainly from malnutrition-associated sarcopaenia, frailty, immobility, and impairment in the function of the immune system [5]. However, several studies have shown that nutritional interventions can help cancer patients to improve their nutritional status and, through this, decrease their risk of complications and prolong life, as well as improving their quality of life [5, 6]. Therefore, prior to undergoing surgery for cancer, every patient should be evaluated in relation to nutritional status. However, the standard parameters of nutritional status assessment, particularly body weight and body mass index (BMI), are not particularly useful in predicting in-hospital complications [7, 8]. Moreover, anthropometric parameters cannot identify a depletion in muscle mass that may be masked by a stable body weight or weight gain due to an increase in fat mass or swelling [3].
For the above reasons, it is important to evaluate the clinical usefulness of a novel and convenient method of nutritional status assessment that shows body composition. One such method, accepted by the European Group on Sarcopaenia in Older People, the Asian Working Group for Sarcopaenia, and the International Consensus for Cancer Cachexia guidelines, is to determine body composition using bioelectrical impedance analysis (BIA) [3, 9]. BIA offers the possibility of estimating patients’ weight, percentage of body fat, fat mass (FM), fat-free mass (FFM) (or lean mass), total body water, muscle mass, bone mass, visceral fat, basal metabolic rate (BMR), metabolic age, and physique rating. Analysis of body composition using BIA could help not only to assess the nutritional status of CRC patients but may also be useful in determining nutritional-related risk and qualification for nutritional support. Moreover, a few studies have found strong positive associations between CRC risk and low skeletal muscle mass [3, 10, 11], as well as obesity, particularly central adiposity, determined using BIA [12]. Conversely, although another paper found no association between the percentage of body fat calculated by BIA and colon adenoma prevalence, BMI, waist-hip ratio (WHR), and physical activity correlated with adenoma status [13].
To date, BIA has only been used in a few works concerning CRC patients [2, 3, 6, 10, 11, 13] and, moreover, none of the papers analysed changes in body composition after surgical treatment for CRC.
Aim
We performed a study aimed at analysing changes in body composition 3 months after surgical treatment for CRC, as well as estimating the prognostic value of preoperative BIA parameter evaluation in relation to the early adverse outcomes measured.
Material and methods
Patients
The study included 80 consecutive patients hospitalized due to CRC, who qualified for surgery. The only exclusion criterion was lack of informed consent to participate in the study.
During the first day of hospitalization in the Department of Surgery, a medical history was obtained from each of the inpatients enrolled to the study and a physical examination was performed that included assessment of anthropometric parameters of nutritional status.
Biochemical determinations
Blood samples were taken from the ulnar vein of the patients between 7 a.m. and 8 a.m. on the day of admission while they were in a fasting state. The following biochemical determinations were performed in the hospital’s diagnostic laboratory using standard methods: blood morphology with a detailed determination of white blood cell distribution (total lymphocyte count (TLC), neutrophils), total cholesterol (TC), triglycerides, glucose, albumin, C-reactive protein (CRP), and carcinoembryonic antigen (CEA).
Parameters of nutritional status assessment
A nutritional status assessment was performed for all the study participants. The following parameters were measured: Nutritional Risk Screening (NRS)-2002 (a score of 3 or more points in the questionnaire indicates a risk of malnutrition-related complications), Mini Nutritional Assessment (MNA), Patient-Generated Subjective Global Assessment (PG -SGA) (a score of more than 4 points in the questionnaire indicates a risk of malnutrition-related complications), height (cm), body weight (kg), waist circumference (WC, cm), hip circumference (HC, cm), mid-arm circumference (MAC, cm), mid-calf circumference (MCC, cm), triceps skinfold thickness (TSF, mm), subscapular skinfold thickness (SST, mm), and abdominal (suprailiac) skinfold thickness (AST, mm), as well as the handgrip strength of the predominant and non-predominant hands (not all the results are presented in the tables). All circumferences were measured using tape, skinfolds using a Harpenden MG-4800 skinfold manual calliper (produced by BATY, UK), and handgrip strength was assessed by an electronic dynamometer (manufactured by Kern, Germany).
Body composition was determined using whole-body BIA and a TANITA BC 420 MA device (TANITA Corporation, Japan). The following BIA parameters were analysed: fat mass (expressed as a percentage of total body weight and kg), visceral fat level (in the range 1–59, a level > 26 shows abdominal adiposity), FFM (kg), predicted muscle mass (PMM, kg) (which assesses both smooth and skeletal muscle mass), skeletal muscle mass (%, kg), bone mass (BM, kg), total body water (TBW, % and kg), BMI (kg/m2), basal metabolic rate (BMR, kcal), and metabolic age (MA, years).
The following secondary parameters were calculated based on the above-mentioned indices:
BMI range was calculated according to World Health Organization (WHO) categories (Underweight: < 18.5 kg/m2; Normal weight: 18.5 ≤ BMI < 25 kg/m2; Overweight: 25 ≤ BMI < 30 kg/m2; and Obese: BMI ≥ 30 kg/m2) [7];
the percentage of patients with obesity in relation to the BIA, taking a cut-off value for FM in males of > 25% and > 35% for females;
an “ideal weight” was calculated according to the Lorentz formula: for female patients, ideal weight = [height (cm) – 100] – {[height (cm) – 150]/2}; and for male patients, ideal weight = [height (cm) – 100] – {[height (cm) – 150]/4};
the quotient of actual (current) to ideal body mass × 100%;
waist-hip circumference ratio (WHR);
arm muscle area (AMA) according to the following formula: AMA = [MAC – (0.314 × TSF)]2/(4π);
arm fat area (AFA) according to the following formula: AFA = (MAC2/4π) – [MAC – (0.314 × TSF)]2/(4π);
brachial adipo-muscular ratio (BAMR) according to the following formula: BAMR = AFA/AMA;
percentage of skeletal muscle mass obtained from BIA in relation to body weight. The cut-off values for class I sarcopaenia chosen for this study were: < 37% for men and < 31.5% for women [9, 13, 14];
skeletal muscle index (SMI) calculated in accordance with the formula (SM/height2), where SM is skeletal muscle mass obtained in BIA expressed in kg; the chosen cut-off values for moderate sarcopaenia were: ≥ 10.76 kg/m2 for men and ≥ 6.76 kg/m2 for women [9, 13, 14];
blood albumin score in one of the following ranges: < 2.5 g/l; 2.5–3.0 g/l; 3.0–3.5 g/l; ≥ 3.5 g/l;
blood lymphocyte score depending on the count in the following ranges: < 800 G/l; 800–1200 G/l; 1200–1500 G/l; > 1500 G/l;
Geriatric Nutritional Risk Index (GNRI) according to the following formula: GNRI = 1.519 × blood albumin concentration (g/l) + 41.7 × actual body mass (kg)/ideal body mass (kg) [7];
instant nutritional assessment (INA) using a classification of 4 degrees of malnutrition: 1st degree = albumin ≥ 3.5 g/l and TLC ≥ 1.5 G/l; 2nd degree = albumin ≥ 3.5 g/l and TLC < 1.5 G/l; 3rd degree = albumin < 3.5 g/l and TLC ≥ 1.5 G/l; and 4th degree = albumin < 3.5 g/l and TLC < 1.5 G/l;
Onodera’s (Preoperative) Prognostic Nutritional Index (OPNI) according to the following formula: 10 × blood albumin concentration (g/l) + 0.005 × TLC (G/l);
COntrolling NUTritional status (CONUT) score as the sum of points established for the respective scores for albumin (0 = ≥ 3.5 g/l; 2 = 3.0–3.49; 4 = 2.50–2.99; 6 = < 2.50 g/l), TC (0 = ≥ 180; 1 = 140–179; 2 = 100–139; 3 = < 100 mg/dl), and TLC (0 = ≥ 1.6; 1 = 1.20–1.59; 2 = 0.80–1.19; 3 = < 0.8 G/l); i.e. CONUT score = serum albumin score + TC score + TLC score;
CONUT score undernutrition group: 0–4 = light; 5–8 = moderate, and 9–12 = severe;
the Glasgow Prognostic Score (GPS) was constructed as follows: patients with both elevated CRP (> 1.0 mg/dl) and low albumin (< 3.5 g/dl) were assigned as GPS 2; those with elevated CRP (> 1.0 mg/dl) or low albumin (< 3.5 g/dl) were assigned as GPS 1; and those with normal CRP (≤ 1.0 mg/dl) and normal albumin (≥ 3.5 g/dl) were assigned as GPS 0;
percentage of patients whose scores for nutritional risk parameters exceeded established values showing nutritional risk, i.e. ≥ 3 for NRS-2002, < 4 for PG-SGA, < 23.5 for MNA, < 45 for OPNI, 1 or 2 for GPS, and ≥ 5 for CONUT;
HLAN = [haemoglobin (g/l) × TLC (/l) × albumin (g/l)]/neutrophil (/l)/100;
HALP = [haemoglobin (g/l) × albumin (g/l) × TLC (G/l)]/platelet (G/l).
Performance status assessment
Patients’ functional status was assessed using standard questionnaires, such as: The Karnofsky Performance Scale, WHO/Eastern Cooperative Oncology Group (ECOG) Performance Status, the Barthel Index scoring form, Activities of Daily Living (ADL), and Instrumental Activities of Daily Living (IADL).
Outcomes measured
The following outcomes were measured: length of stay (LOS; duration of hospitalization (number of days hospitalized)); in-hospital all-cause mortality and non-scheduled readmission (second and subsequent hospitalizations) in the 14th day, 30th day, and at 1-year periods following discharge; all-type adverse outcomes; and surgical (e.g. wound infection, anastomotic leakage, fistula, etc.) and non-surgical (pneumonia, myocardial infarction, stroke) complications.
Bioethics
The investigation was conducted in compliance with the Declaration of Helsinki for medical research, after receiving permission from local Bioethical Committee – No. KB 595/2015.
Statistical analysis
Statistical analysis was conducted using licensed versions of statistical software Statistica (a data analysis software system), Dell, Inc. (2017), version 13.1. The normal distribution of the study variables was checked using the Shapiro-Wilk test. The results were mainly presented as the mean ± standard deviation or as n, %. The statistical significance of differences between groups was verified using Student’s t-test and χ2 test. The statistical significance level was set at a p-value < 0.05. Optimal cut-offs for the respective parameters of nutritional status assessment were determined for maximal Youden indices by plotting receiver operator curves (ROC) in predicting the outcomes measured. The patients were classified into 2 groups based on the cut-off values.
The odds ratio (OR) was defined as the odds that an outcome would occur with the association of a higher (above the cut-off value) blood albumin value, OPNI score, or PMM value, compared to the odds of the outcome occurring in patients with values for these parameters that were below the established cut-off values, and it was calculated according to the following formula: [exposed cases × unexposed non-cases]/[exposed non-cases × unexposed cases], where: exposed cases is the number of subjects with the measured outcome and a variable value in the interval analysed (e.g. patients with postoperative adverse outcome occurrence having a higher value of the parameters analysed); unexposed non-cases is the number of subjects without the measured outcome having a lower value of the parameters analysed upon admission; exposed non-cases is the number of subjects without the measured outcome and with a higher value of the parameter analysed; and unexposed cases is the number of subjects with the measured outcome and a variable value in the lower interval analysed.
Results
Just over half the studied patients undergoing surgery had a tumour located in the rectum (Table I). Moreover, half the patients had advanced CRC, in relation both to clinical (III and IV degree) and histopathological staging (C or D class of the Astler-Coller classification) and required neoadjuvant radiotherapy (36%) and/or adjuvant chemotherapy (54%). Postoperative complications appeared in 23% of patients (Table I). Despite a high advancement in CRC and some parameters (NRS-2002, GNRI, and OPNI) showing increased nutritional risk in the patients studied (Table I), 54% of the individuals were in the BMI ranges 25 kg/m2 ≤ BMI < 30 kg/m2 and 29% BMI ≥ 30 kg/m2. The percentage of obese patients was greater (56% in the whole group) when obesity was defined as being > 25% (males) and > 35% (females) of fat mass [14, 15] determined by BIA (Table II). However, moderate sarcopaenia was diagnosed in 21% and 29% of all the patients, depending on its definition (low SMI or low percentage of skeletal muscle mass, respectively). Only 69% of the individuals studied had normal handgrip strength (> 20 kg for females and > 30 kg for males). However, it was surprising that differences in clinical characteristics and parameters of nutritional risk and nutritional status assessment between patients grouped in relation to the degree of clinical advancement of CRC were not statistically significant, with the exception of the need for neoadjuvant radiotherapy and adjuvant chemotherapy (Table I), as well as SMI and percentage of skeletal muscle mass, which were significantly lower in patients with the most advanced cancer (Table II).
Table I
Clinical and nutritional characteristics of the patients studied in relation to the clinical advancement of colorectal cancer
[i] Data are presented as number, % of all events. CEA – carcinoembryonic antigen, CONUT – CONtrolling NUTritional status, CRP – C-reactive protein, GNRI – Geriatric Nutritional Risk Index, GPS – Glasgow Prognostic Score, HLAN – [haemoglobin (g/l) × lymphocyte (/l) × albumin (g/l)]/neutrophil (/l)/100, HALP – [haemoglobin × albumin × lymphocyte]/platelet, INA – instant nutritional assessment, MNA – Mini Nutritional Assessment, NLR – neutrophil-lymphocyte ratio, NRS-2002 – Nutritional Risk Screening 2002, OPNI – Onodera’s (Preoperative) Prognostic Nutritional Index, PG-SGA – Patient-Generated Subjective Global Assessment, PLR – platelet-lymphocyte ratio. Statistical significance of difference: *p < 0.05 between columns 1 and 2, 3, 4; +p < 0.05 between columns 2 and 3, 4; #p < 0.05 between columns 3 and 4.
Table II
Parameters of anthropometric measures and bioelectrical impedance analysis in the patients studied in relation to the clinical advancement of colorectal cancer
[i] Data are presented as the number, n, % of all events. BMI – body mass index, SMI – skeletal mass index, WHR – waist-hip circumference ratio, WtHR – waist circumference to height ratio. Statistical significance of difference: *p < 0.05 between columns 1 and 2, 3, 4; +p < 0.05 between columns 2 and 3, 4; #p < 0.05 between columns 3 and 4.
Of the patients studied, 64 (80%) attended the control visit 3 months after surgery for CRC (Table III). None of the patients died during the 3-month period, and the main reason for patients missing the control visit was their feeling too much discomfort and being too weak to leave home. Among patients who came for the control visit, a significant decrease was observed in NRS-2002 score, current body weight, current-ideal body mass ratio, BMI, suprailiac skinfold thickness, fat mass, and visceral fat score. The average percentage of skeletal muscle mass and total water content had increased. The percentage of patients with obesity (defined as an increased percentage of FM) and with moderate sarcopaenia defined as a decrease in percentage of skeletal muscle mass of < 37% for males and < 31.5% for females [14, 15] had decreased significantly (Table III).
Table III
Parameters of nutritional risk assessment, anthropometric measures, and bioelectrical impedance analysis in the patients studied before and 3 months after surgery
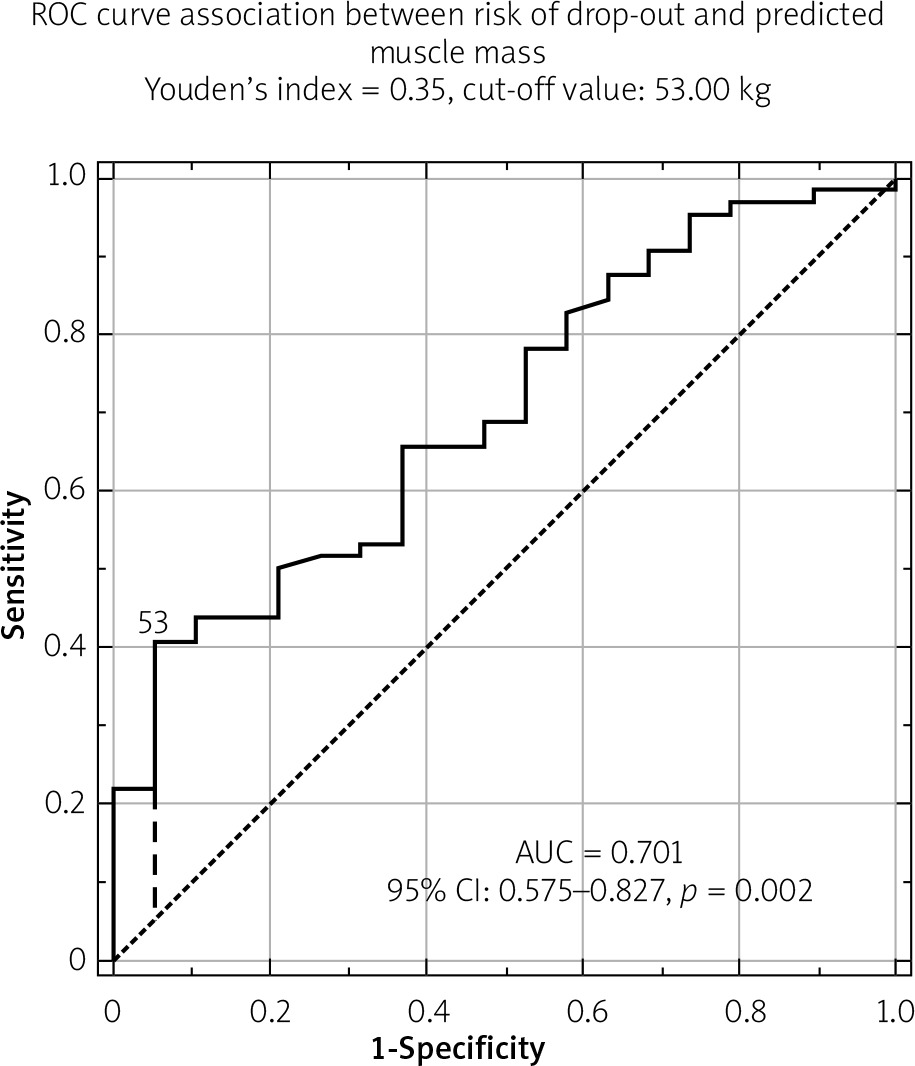
The only statistically significant differences between patients who came for the control visit and those who dropped out were as follows: average initial skeletal muscle mass (kg) determined by BIA (respectively, 49.64 ±11.15 kg vs. 41.87 ±8.15 kg; p = 0.01), preoperative SMI value (respectively, 17.38 ±2.68 kg/m2 vs. 14.58 ±2.51 kg/m2; p = 0.001), the percentage of patients with preoperative sarcopaenia defined both as a gender-dependent SMI cut-off value (respectively, 14% vs. 45%; p = 0.003), and the percentage of skeletal muscle mass (respectively, 22% vs. 45%; p = 0.043). The ROC curve for preoperative predicted muscle mass (PMM), expressed as the sum of skeletal and smooth muscle mass, as predictive of control visit non-attendance, is presented in Figure 1. Based on the obtained cut-off value, we found that a preoperative PMM of < 53 kg was significantly more prevalent in patients who dropped out during the follow-up than among those who came for the control visit (45% vs. 20%; p = 0.028). The 2 patient groups did not differ in their preoperative score for the Karnofsky, ECOG, Barthel, ADL, or IADL measures. All the patients discharged after surgery due to CRC were still living after 3 months, which was confirmed by a telephone call.
Figure 1
ROC curve for association between risk of being unable to attend the control visit and predicted muscle mass
We also compared the values of the parameters measured between patients with and without adverse outcomes, and those undergoing or not undergoing neoadjuvant radiotherapy and/or adjuvant chemotherapy. However, we did not find significant differences in the BIA parameters between these groups, including the percentage changes (deltas) in the values of the BIA parameters measured after the 3-month follow-up (data not presented). We also failed to identify cut-off values for BIA parameters predictive of adverse outcome occurrence using ROC analysis (data not presented). Of the parameters studied, whether anthropometric or biochemical, only higher blood albumin concentration (≥ 3.92 g/l) and a high OPNI score (≥ 39.21) were statistically significant variables associated with a reduced risk of postoperative complications; for these parameters, the ROC area under the curve (AUC) ± 95% CI were, respectively, 0.717 ±0.575–0.859, p = 0.0027 and 0.718 ±0.576–0.860, p = 0.026.
Discussion
In our study performed on a group of consecutive patients undergoing surgery due to CRC, we found that only stage IV CRC affected the patients’ nutritional risk and status, and the majority of subjects were normally nourished or overnourished (Table I). Also, in our study approximately 30% of patients had a BMI ≥ 30 kg/m2 (the obesity criterion according to the WHO’s ranges), whereas, on the basis of BIA, preoperative obesity was present in 57% of the patients, including 50% of the patients with metastatic CRC. Obesity is recognized as a risk factor for CRC [12, 13], although it is perhaps surprising to have such a high prevalence of obesity in patients with metastatic CRC. The obesity prevalence in our patients with CRC was also higher than that reported in the recent WOBASZ 2013-2014 Polish epidemiological study [16].
Compared to the patients with less advanced disease, individuals with metastatic CRC also had the lowest preoperative SMI and percentage of skeletal muscle mass (Table II). Generally, depending on its definition, low SMI or low percentage of skeletal muscle mass, moderate sarcopaenia was diagnosed in 21% and 29%, respectively, of all the patients studied. This percentage was greater than that reported by Park et al. [11], who, among 1270 subjects aged 40 years or older evaluated with first-time screening colonoscopy at Seoul National University Boramae Health Care Centre, found a deficiency of skeletal muscle mass in 10.9% of the patients investigated. Park et al. [11] suggested recognizing the association of sarcopaenia with a higher risk of advanced colorectal neoplasia and advanced adenoma. In the study by Park et al. [11], an association between sarcopaenia and the advancement of CRC remained statistically significant after adjustment for confounders (OR = 2.347, 95% CI: 1.311–4.202; p = 0.004). This observation was confirmed by Jung et al. [10] in a cross-sectional study on 81,885 examinees who underwent colonoscopy as part of a health check-up. Diagnoses of sarcopaenia and obesity in patients with CRC, as performed in our study, are important because these conditions are linked with a poorer response to treatment and lower survival rates in advanced cancers [17]. It is worth underlining that sarcopaenia is also associated with cachexia development, and obesity may mask this process [17].
In our study, 23% of the studied patients showed adverse outcomes during the postoperative period. In spite of the known effect of nutritional status on the course of postoperative patients, we did not confirm the prognostic importance of BIA parameters among the patients studied in the prediction of the outcomes measured (Table III). Of the numerous parameters determined, only higher blood albumin concentration and OPNI value were significantly associated with risk of all-type postoperative complications. These data corroborate reports of other authors who found that low blood albumin concentration is the most important factor for an unfavourable course after surgery performed for various reasons, including CRC [4, 17–26].
In our study, only 80% of the patients were able to come to the control visit 3 months after surgery. Among those patients who attended, we found a significant decrease in fat mass and an increase in muscle mass during this period (Table III). However, it was not preoperative lower functional status but low (< 53 kg) preoperative mass of all muscles (PMM) that was the only significant variable predicting patients’ dropping out from follow-up, with long-term postoperative weakness making it impossible to attend the 3-month control visit (Figure 1). This preoperative PMM value concerned 45% of the individuals with CRC undergoing surgery. We did not find a similar observation in the works available. However, in several studies, performance status and handgrip strength were recognized as independent risk factors for the occurrence of postoperative adverse outcomes, such as physical disability, frailty, poor quality of life, and death [9, 14, 15].
Our study has some limitations. First, body composition was determined using whole- body BIA, which provides a small overestimation of FFM in CRC patients [2, 3, 17]. However, it seems that this shortcoming may be acceptable because we used the same device, and thus this error was consistent [2] with all our study patients for both examinations. Moreover, each of our patients acted as his or her own control. Second, our study was performed on a relatively small patient sample. However, this is similar to other investigations, such as the study by Ræder et al. [3], which was performed with 43 patients with CRC. Third, in our study, we had a drop-out rate of 20% due to some patients not being able to attend the control visit 3 months later. However, a comparison of BIA parameters was possible in 64 patients and was carried out using the paired Student’s t-test, in which every patient acted as his or her own control. In this way, the comparison performed can be recognized as reliable.
Conclusions
A significant proportion of the patients with CRC undergoing surgery were overweight or obese, which may mask the sarcopaenia that presented in more than 20% of them. This suggests the need for body composition analysis during preoperative evaluation of patients’ nutritional status, although we did not confirm the predictive power of BIA parameters in relation to the occurrence of the outcomes measured. Three months after surgery due to CRC, favourable changes in body composition determined using BIA were observed, despite the weight depletion noted. The changes were not associated with the risk of postoperative complications, local CRC advancement, or the need for neoadjuvant radiotherapy or adjuvant chemotherapy. Blood albumin concentration and a high OPNI score were the only variables associated with a reduced risk of postoperative complications. Following surgery for CRC, patients should be given recommendations regarding proper nutrition and an increase in physical activity to prevent cancer cachexia and sarcopaenia progression, because deterioration in physical performance during the 3 months after surgery was observed in 20% of the patients studied.