
Introduction
Variceal hemorrhage is characterized by bleeding from gastroesophageal varices. Varices are dilated submucosal veins caused by portal hypertension. Portal hypertension can result from many causes, the most common of which is liver cirrhosis. In cirrhosis, damaged liver architecture creates resistance to intrahepatic blood flow and subsequently elevates portal pressures. These elevated pressures translate into the formation of portosystemic collaterals, which are known as varices. Larger varices have a higher tendency to bleed [1]. Bleeding from the varices is associated with a high 30-day mortality rate, ranging from 15% to 20% [2]. Other than size, there are several factors that predict bleeding risk from varices. These include location, size, appearance, clinical features, and pressure across varices.
Acute kidney injury (AKI) results from several factors, most commonly from pre-renal or acute tubular necrosis (ATN) [3]. Pre-renal injury results from intravascular volume depletion from any cause, which includes bleeding of any type. In the setting of cirrhosis, there is a reduction in effective arterial blood volume (EABV) [4]. The combination of reduced intravascular volume with low EABV in cirrhosis can precipitate acute renal damage. Some studies have shown that people with variceal hemorrhage and AKI have poor short-term outcomes [4].
Aim
In this article we analyze the National Inpatient Sample to find an effect on outcomes from AKI in patients who present with variceal hemorrhage.
Material and methods
Study design and data source
This is a retrospective cohort study performed on patients admitted with variceal hemorrhages to acute care hospitals in the USA between the years 2016 and 2018. We queried the National Inpatient Sample, which is the largest publicly available, all-payer inpatient database [5]. The National Inpatient Sample for the years 2016 to 2018 contains data of more than 21 million hospital stays, collected from 48 states plus the District of Columbia, which makes it representative of more than 97% of the US population.
The National Inpatient Sample consists of 20% of the stratified sample of all discharges from more than 4000 non-federal acute care hospitals in the USA. These 20% discharges are then weighted (weight = total number of discharges from all acute care hospital in the United States divided by the number of discharges included in the 20% sample) to make it representative of the national population. The data contains both hospital- and patient-level information, which includes demographics (patient age, gender, zip code, and income), hospital teaching status, ownership, geographic location, and bed size. The dataset contains one principal discharge diagnosis, 39 secondary diagnoses, and up to 25 procedure codes.
Study population
Using NIS, we collected the longitudinal data from the years 2016 to 2018. All patients with primary diagnosis of variceal hemorrhage were included using the International Classification of Disease, 10th revision (ICD-10 codes). These selected variceal hemorrhage patients (ICD-10: I8501, I8511) were further divided into 2 sub-groups based on the presence or absence of AKI as the primary or secondary diagnosis (ICD-10 N170, N171, N172, N178, N179). Patients aged below 18 years were excluded from the study.
Study variables
The variable of interest was defined by patient and hospital level. The patient’s demographics extracted directly from the NIS included age, gender, race, ethnicity, zip code, and insurance status. Hospital level characteristics included in the study were hospital location, bed size, and teaching versus non-teaching status. To remove the effect of confounding variables some of the variables that potentially affected outcome was included in the multivariable analysis. These were the Charlson comorbidity index, coronary artery disease, congestive heart failure history, history of smoking, hyperlipidemia, myocardial infarction, diabetes, and hypertension. All these variables were identified from their respective ICD 10 codes.
Study outcomes
The primary outcome was in-hospital all-cause mortality in variceal hemorrhage patients who concurrently had acute renal failure in comparison to variceal hemorrhage patients with no AKI. Secondary outcomes measured were morbidity, including the rate of hemorrhagic/hypovolemic shock, intensive care unit admission rate, need for blood transfusion and need for dialysis, length of stay, and total hospital charges. All these outcomes were identified using ICD-10 codes. Because there are no ICD-10 code for ICU admission, patients who required mechanical ventilation, central line placement, and pressors during their hospital stay were grouped under intensive care admission.
Statistical analysis
Discharge level weights released from the HCUP were used to estimate the total number of patients admitted with principal diagnosis of acute variceal hemorrhage. Analysis was performed using STATA, version 16.1. We used the χ2 test to determine the difference between categorical variables, and the t-test was done to find the difference between continuous variables. Two different methods were used to adjust for confounders. First, multivariate regression analysis was performed to adjust for potential confounders and obtain adjusted odd ratios (ORs). Patient- and hospital-level variables were included in the multivariate regression model, as well as co-morbidities including coronary artery disease, congestive heart failure, history of smoking, hyperlipidemia, myocardial infarction, diabetes, and hypertension. These variables were added into multivariate regression analysis based on significant association seen on univariate analysis with a cut-off p-value of 0.2. Logistic regression was used for categorical outcomes (in-hospital mortality, shock, ICU admission, blood transfusion, need for dialysis), and linear regression was performed for continuous outcomes (length of stay and total hospital charges). In the second method, we used propensity score to match variceal hemorrhage patients with AKI versus those without. Variables including age, gender, race, household income, zip code, insurance status, hospital teaching status, hospital region, bed size, and Charlson comorbidity index were used to create a multivariate regression model to estimate the propensity score for AKI in variceal hemorrhage patients. Treatment weights were obtained using a double robust method, followed by a generalized linear model to match cases with controls [6].
Results
Patient characteristics
Of the total 21,362,502 hospitalizations between the years 2016 and 2018, 124,430 patients with acute variceal hemorrhage were included in the study (Figure 1). Twenty-six percent (32,315) of the patient population with variceal hemorrhage had AKI. The mean age of patients with AKI was 58 years. 69% of the patients with AKI were males. Most of the patients with variceal hemorrhage and concurrent AKI were white (63.4%), had higher Charlson comorbidity index, belonged to the low seriocomic group, were treated in large urban teaching hospitals, and were insured by Medicare. Similar trends were seen in variceal hemorrhage patients without AKI. Smoking history was found in 21% of the patient population. More than 30% of the cohort had a history of diabetes and/or hypertension. Baseline characteristics of patients are summarized in Table I.
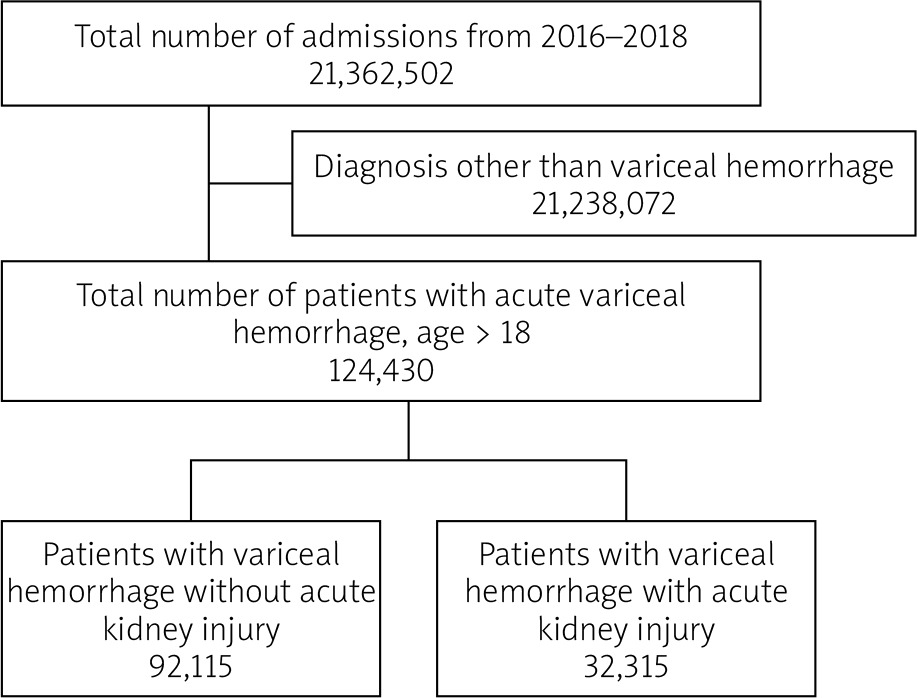
Table I
Baseline characteristics of the study population
[i] AKI – acute kidney injury. *Median household income for the patient’s Zip Code: 1st Quartile: $1–$42,999, $1–43,999, $1–45,999 for NIS 2016, 2017, 2018, respectively. 2nd quartile: $43,000–$53,999, $44,000–$55,999, $46,000–$58,999 for NIS 2016, 2017, and 2018, respectively. 3rd quartile: $54,000–$70,999, $56,000–$73,999, $59,000–$78,999 for NIS 2016, 2017, and 2018, respectively. 4th quartile: > $71,000, > 74,000, > 79,000 for NIS 2016, 2017, and 2018, respectively. **Northeast: includes ME, NH, VT, MA, RI, CT, NY, NJ, and PA. Midwest: includes OH, IN, IL, MI, WI, MN, IA, MO, ND, SD, NE, and KS. South: DE, MD, DC, VA, WV, NC, SC, GA, FL, KY, TN, AL, MS, AR, LA, OK, and TX. West: MT, ID, WY, CO, NM, AZ, UT, NV, WA, OR, CA, AK, and HI.
Intensive care admission
Patients with AKI required ICU care more often than patients with normal renal function 36.6% vs. 13.2% (Table II). On multivariate regression analysis it was found that patients with AKI had greater chance of ICU admission (AOR = 4.76, 95% CI: 4.42–5.13, p < 0.01). Similar results were seen on propensity-matched analysis (AOR = 11.8, 95% CI: 2.39–58.56, p < 0.01) (Tables III and IV).
Table II
Outcomes of patients admitted with variceal hemorrhage: unadjusted analysis
Table III
Outcomes of the propensity-matched adjusted analysis
Table IV
Outcomes of multivariate regression adjusted analysis
Hemorrhagic/hypovolemic shock
13.3% of patients admitted with variceal hemorrhage who had AKI went into shock, as compared to 3.82% of those without AKI (Table II). On adjusted multivariate regression analysis patients with AKI had a 3-fold increased chance of shock compared to those without AKI (AOR = 3.41, 95% CI: 3.07–3.79, p < 0.01). On propensity-matched analysis, patients with AKI also showed a higher likelihood of shock (AOR = 5.66, 95% CI: 1.27–25.10, p = 0.02) (Table III and IV).
Blood transfusion
Thirty-four percent of patients with acute renal failure required blood transfusion in comparison to 32.7% of variceal hemorrhage patients without AKI (Table II). The presence of AKI showed increased odds of blood transfusion both on multivariate logistic regression and propensity-matched analysis (AOR = 1.24, 95% CI: 1.15–1.32, p < 0.01, AOR = 2.30, 95% CI: 0.53–9.79, p = 0.26, respectively) (Tables III and IV).
Need for dialysis
Patients admitted with variceal hemorrhage, who developed acute renal failure, required dialysis in 1.60% (1991) of cases compared to 1.14% of variceal hemorrhage patients who did not develop AKI during admission, and these patients underwent dialysis either due to pre-existing end-stage renal disease or progression of chronic renal failure (Table II). On multivariate logistic regression and propensity-matched analysis variceal hemorrhage patients with AKI had similar odds of dialysis requirement compared to the patients who did not have new renal failure (AOR = 1.27, 95% CI: 0.67–2.42, p = 0.45, AOR = 1.11, 95% CI: 0.84–1.63, p = 0.36, respectively) (Tables III and IV).
Length of stay
The mean length of stay for variceal hemorrhage patients was 6.4 days, whereas it was 9.31 days for patients with AKI and 5 days for patients who did not develop acute renal failure. After adjusting for confounders, multivariate logistic analysis showed increased mean LOS for patients with AKI (mean adjusted LOS = 3.87, 95% CI: 3.57–4.18, p < 0.01). Similar results were obtained after propensity matching (adjusted LOS = 2.39, 95% CI: 0.79–4.01, p < 0.01) (Tables III and IV).
Total hospital charges
Mean total hospital charges for patients with variceal hemorrhage were $87,637. Patients with AKI had significantly higher charges $157,763 vs. $62,701 for patients without AKI (Table II). The presence of AKI was associated with significantly higher adjusted mean total hospital charges obtained both in multivariate regression analysis and in propensity matching. The mean adjusted total charge difference was $77,394, 95% CI: $70,466–$84,321, p < 0.01) (72,348$, 95% CI: $44,690–$100,006, p < 0.01, respectively) (Tables III and IV).
Independent predictors of mortality
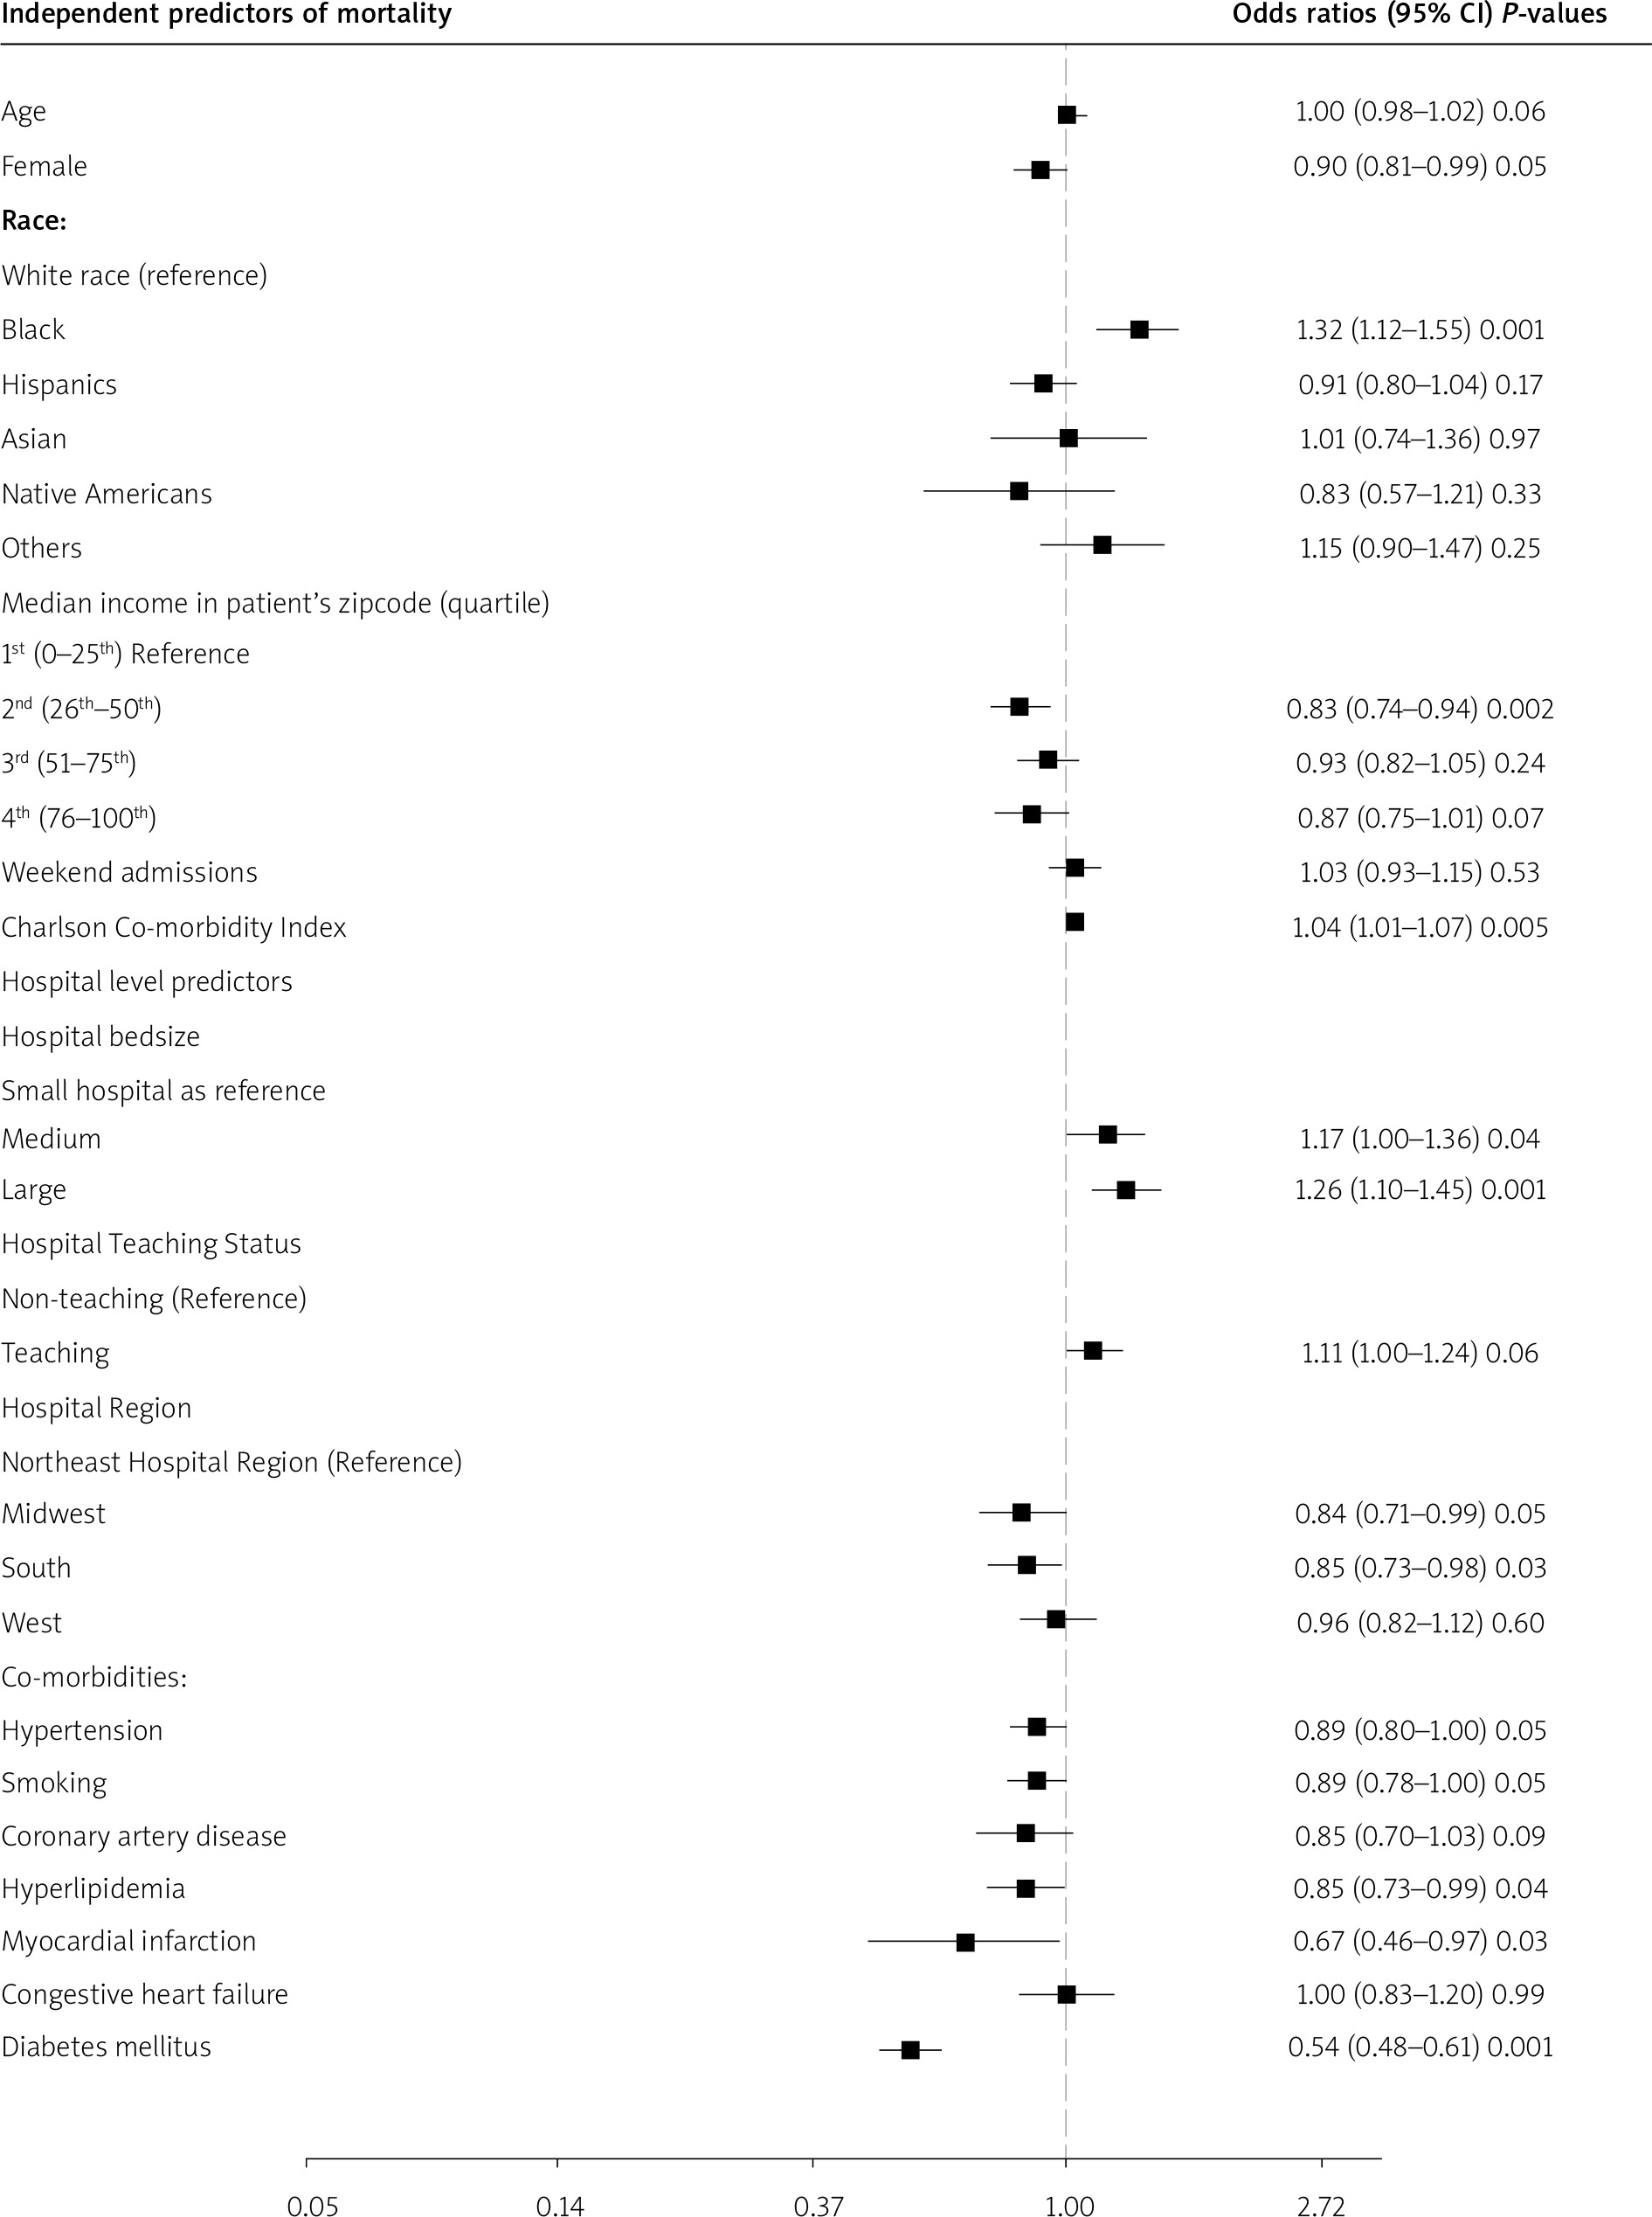
We performed multivariate logistic regression to determine the association of various variables with mortality in patients with variceal hemorrhage. We investigated the patient- and hospital-level predictors and determined that with increasing score on the Charlson comorbidity index the odds of inpatient mortality increase (AOR = 1.04, 95% CI: 1.01–1.07, p = 0.005). Odds of mortality were also higher among patients who were African Americans, when compared with Caucasians (AOR = 1.32, 95% CI: 1.12–1.55, p = 0.001). Hospitals with more beds also had higher odds of mortality (AOR = 1.26, 95% CI: 1.10–1.45, p = 0.001). Lower odds of mortality are seen in patients with history of hyperlipidemia (AOR = 0.85, 95% CI: 0.72–0.99, p = 0.04), myocardial infarction (AOR = 0.66, 95% CI: 0.46–0.97, p = 0.03), diabetes (AOR = 0.54, 95% CI: 0.48–0.61, p = 0.001), and hypertension (AOR = 0.89, 95% CI: 0.80–0.99, p = 0.05) (Figure 2).
Discussion
Analysis of the National Inpatient Sample has the potential benefit of recognizing hospital disease burden and factors affecting outcomes. In this article we analyzed the effect of AKI in patients admitted with variceal hemorrhage. Previous studies have reported poor outcomes in patients with cirrhosis and AKI [7, 8]. Other studies have also shown adverse effects specifically in patients with variceal bleeding [4, 9]. Our analysis surveyed recent information from the NIS database to evaluate similar effects of AKI with regard to inpatient mortality, hospital length of stay, and total cost.
We observed that inpatient mortality is significantly higher in patients with AKI. In a systematic review done by Tariq et al. it was seen that hospital mortality was 6-fold higher among patients with AKI [10]. Our analysis reports approximately 8-folds higher odds. As discussed above, the potential risk of development of AKI is high in patients with cirrhosis, which in turn contributes to mortality. This effect has been described in another NIS study by Karagozian et al., which showed higher odds of mortality in cirrhotic patients with AKI [7]. Hsieh et al. utilized the ICA-AKI criteria to study prognosis in cirrhotic patients and concluded that 6-week mortality was significantly higher in patients with AKI and variceal bleeding. This study also noted that stages of AKI predicted 3-month survival [9]. These findings prompt us to recognize the effects of impaired renal function earlier and treat it appropriately in this at-risk cohort.
Several factors can contribute to mortality in patients with AKI. Our analysis shows that patients with increasing comorbidities are at higher risk of adverse outcomes. The Charlson comorbidity index evaluates 1-year mortality in patients based on their range of comorbidities [11]. We observe that for every 1-point increase on the index the odds of mortality are higher in patients with AKI, suggesting that additional comorbidities contribute to the overall mortality and adverse outcomes. Hsieh et al. observed that greater severity of bleeding and advanced liver disease was associated with worse outcomes [9]. Cardenas et al. also observed similar findings. In this cohort of cirrhotic patients, 11% of the bleeding episodes were complicated by renal failure, and they were not reversible in 60% of the patients. Unfortunately, with our study design, which is limited by ICD-10 codes, severity of diseases could not be analyzed. However, we were able to analyze ICU admissions, and as is evident, patients with AKI had higher odds of requiring intensive care.
It is known that bleeding can predispose to infections [12]. Cardenas et al. found that these infections can predispose to renal failure as well without any evidence of septic shock. 34% of SBP patients had AKI in a study by Karagozian et al. [7]. Likewise, in our analysis 3% of the patient population had SBP (spontaneous bacterial peritonitis) and 55% of those had AKI. This can be explained by the circulatory failure caused by infections and the lower EABV in cirrhotic patients, as mentioned earlier [4, 13].
AKI with variceal hemorrhage has a significant economic impact, as shown by its effect on hospital length of stay and total charge in our analysis. Our study shows an increase of 4 days in patients with AKI compared to those without. This is similar to the data from Brigham and Women’s Hospital in Boston, MA, which shows that there was a 3.5-day increase in hospital length of stay in patients with increasing creatinine. This increase was defined as serum creatinine ≥ 0.5 mg/dl between 2 consecutive values. An increase in this cut-off resulted in higher length of stay [14]. Similarly, a study by Chertow et al. showed that the mean adjusted cost increase for patients with 0.5 mg/dl cut-off was $7499. In our study the total charge for patients with AKI was $77,394 more than for patients with no AKI. Karagozian et al. also analyzed the NIS database but for the years prior to 2012, showing that there was incremental increase in cost throughout the years [7].
The strength of our study is that it identifies a large sample size which significantly improves the power of the study; however, it also has several limitations by virtue of its design. Firstly, the patient population is defined by obtaining ICD-10 codes. Assigning ICD-10 codes to a particular disease presentation is not uniform for all providers. Therefore, it is possible that not all diagnoses are captured, either due to low-level code or a problem not coded at all. Also, the severity of AKI cannot be discerned from ICD-10 codes. Secondly, lab values and treatment modalities cannot be analyzed because they are not part of the NIS database. This would have had significant utility in identifying whether different treatment measures improve outcomes. And finally, because NIS captures hospital data, we do not have information on ambulatory data or data from urgent care and emergency department visits.
Patients with variceal hemorrhage are at risk of kidney injury. This in turn complicates their in-hospital stay and results in increased inpatient mortality, length of stay, and total charge. Our study shows that patients hospitalized for variceal hemorrhage and who also have AKI are at risk of higher odds of inpatient mortality, prolonged length of stay, and significant increase in health care costs. Steps to promptly recognize and prevent this entity are needed. Clinicians should be aware of, and equipped to manage, this disease process before and as it arises.