


Introduction
Liver cirrhosis (LC) decompensation is characterized by the development of ascites, gastrointestinal bleeding, hepatic encephalopathy, kidney dysfunction, and infectious complications, dramatically affecting the disease course and patients' survival [1]. Malnutrition and sarcopenia as its main clinical manifestation are serious LC complications associated with a high risk of decompensation and death [2, 3]. The prevalence of malnutrition in LC varies from 13.3% to 85% depending on the aetiology and the severity of the underlying disease, and the methods of assessment of nutritional status [4]. In real clinical practice, altered nutritional status is often underestimated. Fluid retention, ascites, and obesity may hide malnutrition. The nutritional assessment tools used in clinical trials have some limitations in practical application, and diagnostic agreement between different assessment tools is low [5].
The Patient-Generated Subjective Global Assessment (PG-SGA) was created by Faith Ottery in 1996 on the basis of Subjective Global Assessment (SGA) for nutritional assessment of cancer patients and was further improved [6, 7]. The PG-SGA enables the screening of malnutrition, identification of risk factors, assessment of a patient’s nutritional status, and definition of nutritional triage recommendations. The PG-SGA consists of patient-administered blocks (weight loss, food intake, symptoms, activity, and function) and professional worksheets (calculation of percentage weight loss, disease and its relation to nutritional requirements, metabolic demand, and a nutritionally oriented physical exam). The global PG-SGA category rating takes into account weight loss, nutrient intake, nutrition impact symptoms, functioning, and physical exam. An additive numerical PG-SGA score is used to define specific nutritional interventions. Today, the PG-SGA is considered a reference method for the assessment of malnutrition in cancer patients [7]. This tool was also validated in intensive care unit patients, and ischemic stroke and chronic kidney disease patients [8–10]. The diagnostic and prognostic value of PG-SGA in LC patients remains unclear.
Aim
To determine the validity and prognostic value of PG-SGA as a nutrition assessment tool in LC patients.
Material and methods
Methodology
In 2019–2021, 161 LC patients, including 58 women and 103 men (mean age: 55.2 ±11.6 years), hospitalized at Vinnytsia City Clinical Hospital No. 1, were enrolled in the prospective study, with follow-up continuing until June 2022. All patients were informed of the purpose of the study and provided their written consent. The Bioethics Committee of the National Pirogov Memorial Medical University, Vinnytsya (Protocol No. 8 of 17.10.2019) found that the study did not contradict the basic bioethical standards of the Helsinki Declaration, the Council of Europe Convention on Human Rights and Biomedicine (1977), WHO regulations, and Ukrainian law. LC of class A, B, and C Child-Turcotte-Pugh (CTP) was diagnosed in 23, 57, and 81 patients, respectively. Viral (HBV, HCV), alcohol-related, and viral-alcohol-related LC aetiology was confirmed in 27, 96, and 38 patients, respectively. The mean Model for End-Stage Liver Disease (MELD) score was 26.1 ±9.86. The median follow-up was 489 (interquartile range: 293–639) days. During this time, 50 (31.1%) patients died as a result of LC complications.
PG-SGA, Controlling Nutritional Status Score (CONUT), handgrip strength, and skeletal muscle index (SMI) were used to assess the nutritional status of patients. PG-SGA allocates patients to 3 categories: well-nourished (Stage A), moderate/suspected malnutrition (Stage B), and severely malnourished (Stage C). The triage based on the PG-SGA numeric score includes the following: no intervention required at this time (0–1); patient and family education by dietitian, nurse, or other clinician with pharmacological intervention as indicated by the symptom survey and lab values as appropriate (2–3); requires intervention by a dietitian, in conjunction with a nurse or physician as indicated by symptoms (4–8); and indicates a critical need for improved symptom management and/or nutrient intervention options (≥ 9). The Ukrainian PG-SGA version was used in the study, which was created on the basis of the original v4.3.20 PG-SGA (available at http://pt-global.org), translated and cross-culturally adapted according to the International Society for Pharmacoeconomics and Outcomes Research recommendations [11].
The CONUT scale based on albumin, total serum cholesterol, and blood lymphocyte counts assigns patients to 4 groups: normal nutritional state (0–1 point), mild malnutrition state (2–4 points), moderate malnutrition state (5–8 points), and severe malnutrition state (≥ 9 points) [12]. Handgrip strength was measured 3 times on a non-dominant hand with the best value taken for analysis. Handgrip strength < 27 kg in men and < 16 kg in women was considered as dynapenia [13]. SMI was assessed using computed tomography as the muscle cross-sectional area measured at the L3 level and normalized to height [14]. Reference SMI values for the Ukrainian population were earlier determined [15]. SMI ≤ 52.2 and ≤ 39.3 cm2/m2 were considered as sarcopenia in men and women, respectively.
Statistical analysis
The data were processed using the SPSS22 software package (©SPSS Inc.). The mean (M), standard deviation (SD), standard error (m) of the mean, and interquartile range (P25–P75) were calculated. The parametric Student’s t-test and non-parametric Mann-Whitney U test were used to assess the intergroup difference. The Fisher test was used to compare the frequency of changes. Spearman’s Rank Order Correlation was used to determine the relationships between parameters. Diagnostic agreement between PG-SGA and CONUT was assessed using Cohen’s κ statistic. ROC analysis was used to assess the PG-SGA prognostic value. The survival of the patients was analysed using Kaplan-Meier analysis, and the survival curves were compared using a logrank test. The Cox regression method was used to determine mortality predictors. The results were presented as M ± SD, M ± m, and Me (P25–P75). The difference was considered statistically significant at p < 0.05.
Results
Nutritional status of patients with LC according to PG-SGA
According to the PG-SGA, 65 (40.4%) patients were well-nourished, 48 (29.8%) were moderately malnourished, and 48 (29.8%) were severely malnourished. The severity of LC was associated with the frequency and severity of malnutrition. Twenty-two (95.7%) CTP A patients, 32 (56.1%) CTP B patients, and 11 (13.6%) CTP C patients had a normal nutritional status. Moderate malnutrition occurred in 19 (33.3%) patients with CTP B and 29 (35.8%) patients with CTP C. Severe malnutrition occurred in 6 (10.5%) CTP B patients and 41 (50.6%) CTP C patients. The mean PG- SGA score in CTP A, B, and C patients was 3.35 ±2.99, 7.35 ±4.73, and 13.0 ±4.92 (p < 0.001), respectively. Thirty-eight (23.6%) of the LC patients required intervention by a dietitian or physician (PG-SGA 4–8 points), while 87 (54.0%) patients critically required improved symptom management and/or nutrient intervention options (PG-SGA ≥ 9 points).
Validity of the PG-SGA in LC patients
The PG-SGA categories corresponded with other nutritional parameters (Table I). The mean CONUT score in PG-SGA Stage B and Stage C was significantly higher than in PG-SGA Stage A patients. The numerical CONUT correlated with the numerical PG-SGA (r = 0.713, p < 0.001). Because the PG-SGA contains 3 categorical items and CONUT contains 4 categorical items, we determined agreement regarding moderate/severe malnutrition only. Among 96 patients with moderate/severe malnourished PG-SGA, 80 (83.3%) had a moderate or severe malnutrition state according to CONUT. Among 65 PG-SGA well-nourished patients, 54 (83.1%) had a normal nutritional state or mild malnutrition according to CONUT. Diagnostic concordance for cases of moderate/severe malnutrition was moderate (Cohen’s κ = 0.656, p < 0.001). The skeletal muscle mass and strength in PG-SGA Stage B and C patients were significantly reduced. Numerical PG-SGA was significantly correlated with SMI (r = –0.619 and –0.634, p < 0.001) and handgrip strength (r = –0.757, and –0.637, p < 0.001) in men and women, respectively. Sarcopenia and dynapenia were present in 42 (87.5%) and 32 (66.7%) severely malnourished patients, respectively.
Table I
Demographic and nutritional parameters according to PG-SGA
Association between malnutrition according to the PG-SGA and LC severity
Patients with altered nutritional status had more severe manifestations of liver failure and portal hypertension (Table II). The proportion of patients with overt ascites, hydrothorax, and hepatic encephalopathy among malnourished patients was significantly higher than in well-nourished patients. Severely malnourished patients had significantly higher serum bilirubin and creatinine, and lower serum albumin and platelet count than well-nourished patients. The numerical PG-SGA score correlated with CTP and MELD (r = 0.623, r = 0.543, respectively, p < 0.001). Moderate and severely malnourished patients tended to have a higher frequency of alcohol-related LC aetiology.
Table II
Aetiological and clinical LC parameters according to PG-SGA
Association between malnutrition according to the PG-SGA and mortality
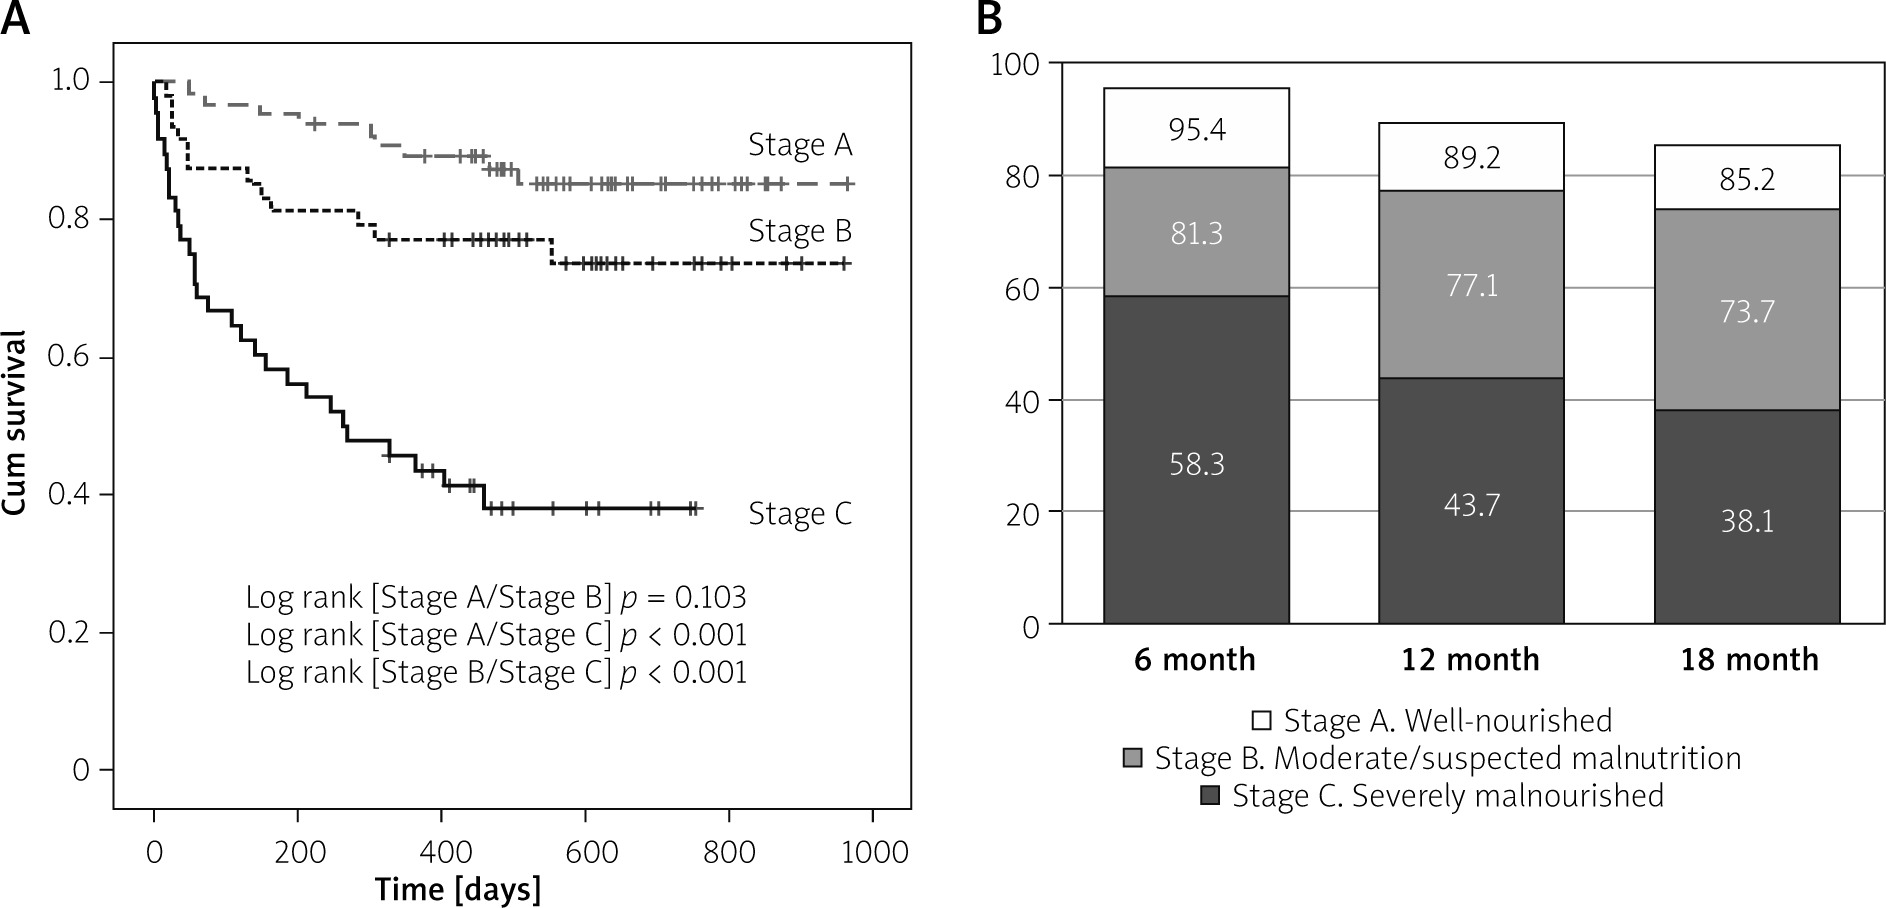
During the follow-up, 29 (60.4%) severely malnourished patients, 12 (25.0%) moderately malnourished patients, and 9 (13.8%) well-nourished patients died. The mean baseline PG-SGA score in deceased patients was higher than in survivors (13.5 ±5.28 vs. 7.81 ±5.12, p < 0.001). We examined the prognostic value of the PG-SGA using ROC analysis of liver-related mortality as an endpoint. The AUC of the PG-SGA-based mortality prediction was 0.775 (95% CI: 0.697–0.854, p < 0.001). The PG-SGA cut-off point for mortality by Youden’s criterion was ≥ 13 points (Se = 66.6%, Sp = 84.3%). Kaplan-Meier curves showed that the survival of severely malnourished patients was significantly lower than that of moderately malnourished and well-nourished patients (Figure 1). The mean survival time of severely malnourished patients was 370 ±46.4 days vs. 864 ±31.8 days for well-nourished patients (p < 0.001).
Figure 1
Kaplan-Meier analysis for survival according to PG-SGA category: A – Survival function. B – Cumulative proportion surviving according to PG-SGA
The Cox proportional-hazards model was used to determine mortality predictors. In the univariate analysis, hydrothorax, overt hepatic encephalopathy, ascites, hyperbilirubinemia, hypoalbuminemia, thrombocytopenia, prolonged prothrombin time, and severe malnutrition were significantly associated with mortality (Table III). In the multivariate analysis, only hepatic encephalopathy, hypoalbuminemia, and severe malnutrition were independent mortality predictors.
Table III
Cox regression analysis for mortality
Discussion
Altered nutritional status is a key clinical sign and common LC complication, manifested by a body composition change, depletion of fat and muscle tissue, osteodystrophy, diminished physical and mental function, and impaired clinical outcome of the disease [16]. The development of malnutrition in LC patients is associated with many processes. Nausea, early satiety because of meteorism and ascites, salt restriction and protein restriction for hepatic encephalopathy, loss of appetite, and taste change lead to inadequate dietary intake. Portal hypertension, portosystemic shunting, bile acid deficiency, and intestinal bacterial overgrowth lead to malabsorption. Low physical activity, hypermetabolic state, macro- and micronutrient deficiency, and systemic inflammation contribute to metabolic disturbances [17, 18]. Malnutrition is associated with LC deterioration, a higher frequency of infections, increased length of hospital stay and costs, and reduced pre- and post-transplant survival [3, 19–22].
Despite many nutritional screening and assessment tools, such as clinical scales and anthropometric, biochemical, and imaging methods, the objective diagnosis of malnutrition in patients with LC remains a challenging issue [18]. Some tools are characterized by assessment variability and insufficient reproducibility, some are time-consuming and require experienced specialists, some are expensive, and some have not been validated in LC [23]. In this study, we focused on the PG-SGA because it is a simple, rapid, and low-cost bedside method of nutritional status assessment. The PG-SGA covers all malnutrition domains, such as change of body weight, food intake, symptoms limiting food intake, impaired activity and functional status, the impact of underlying disease, the patient’s metabolic demands, and objective signs of altered body composition. The first part (short form) of the PG-SGA, completed by the patient, can be used as a screening tool, while the second part, completed by a healthcare professional, can be used as a tool for assessment, monitoring, and triaging patients to nutrition intervention groups [7].
In our study, 59.6% of patients were moderately or severely malnourished according to PG-SGA categories. 54.0% of patients critically required improved symptom management or nutrient intervention according to triage based on the PG-SGA numeric score. A high frequency of malnutrition in our cohort was probably associated with decompensated LC. A significant prevalence of malnutrition in similar cohorts was demonstrated in other studies that used SGA [24], MUST, and NRS 2002 [2] as assessment tools.
We showed that nutritional status assessment using PG-SGA was consistent with other assessment tools. The CONUT score is a reliable tool that reflects protein synthesis disorders, caloric deficit, and impaired immune defences [25]. The diagnostic and prognostic value of CONUT for patients with end-stage liver disease was previously confirmed [26]. In our study, the overall agreement between PG-SGA and CONUT in malnutrition assessment was moderate, as both tools were able to reveal the same patients. Previously, Fruchtenicht et al. [27] demonstrated that in patients with gastrointestinal cancer, PG-SGA categories correlated with other laboratory tools such as the Neutrophil/Lymphocyte Ratio and Onodera’s Prognostic Nutritional Index.
Reduced skeletal muscle mass and function is a major malnutrition manifestation [16]. The cross-sectional area of skeletal muscles at the L3 level is the most accurate and reproducible method of sarcopenia assessment [28]. In our study, 58.3% of patients with stage B PG-SGA and 87.5% of patients with stage C PG-SGA had a reduced SMI, and 29.2% and 66.7% of the aforementioned patients had reduced handgrip strength, respectively. The numerical PG-SGA was negatively correlated with SMI and handgrip strength. Recently, Zambrano et al. [29] also demonstrated that LC outpatients with reduced skeletal muscle mass and strength had a higher PG-SGA score. In our study, a quarter of well-nourished patients had reduced SMI. Probably, loss of muscle mass in end-stage liver diseases is caused not only by malnutrition. The discrepancy between energy needs and intake, altered protein metabolism, hyperammonemia, reduced levels of circulating branched-chain amino acids, imbalance of myokines, systemic inflammation, and low physical activity can be other independent factors of sarcopenia in LC [16, 28].
Prognosis evaluation is critically important for LC patients. Traditional prognostic tools, i.e. CTP and MELD, use clinical and laboratory parameters of LC severity but do not take into account the nutritional status of patients. We aimed to determine whether the PG-SGA could predict outcomes. Our data show that numerical PG-SGA has good diagnostic accuracy for predicting death (AUC 0.775, p < 0.001), and the mortality cut-off was PG-SGA ≥ 13. In the Kaplan-Meier analysis, the short-term survival of severely malnourished patients was significantly lower than that of moderately malnourished and well-nourished patients. The cumulative proportion surviving at month 12 of PG-SGA Stage C patients was 43.7% versus 77.1% and 89.2% of PG-SGA Stage B and A, respectively.
Malnourished patients presented more severe signs of portal hypertension and liver dysfunction. The proportion of patients with overt ascites, hepatic encephalopathy, and hydrothorax was higher among the severely malnourished. The mean MELD and CTP scores in severely malnourished patients were significantly higher than in moderately malnourished and well-nourished patients. Cox regression analysis was used to find out what exactly caused a poor prognosis: malnutrition per se, or other LC complications accumulated in patients with malnutrition. In the multivariate analysis, only hypoalbuminemia, hepatic encephalopathy, and severe malnutrition (HR = 2.39, p = 0.016) were independent predictors of death. Several recent studies, using PG-SGA, have demonstrated comparable mortality risk in severely malnourished patients with gastric cancer [30] and hepatocellular carcinoma [31].
Conclusions
The PG-SGA is a reliable tool for nutritional assessment and can predict survival in LC patients. It is a simple, fast, and low-cost tool already translated into more than 10 languages. Although malnutrition is a potentially reversible condition, an adequate assessment of nutritional status using PG-SGA and specific nutritional interventions could improve the prognosis of patients.