
Introduction
The anti-angiogenic therapy binding the vascular endothelial growth factor-A (VEGF-A) was tested for treating many tumor types. AVASTIN was successfully approved in colon cancer, lung cancer [1], renal cancer [2], second-line treatment of glioblastoma [3], ovarian cancer [4], and cervical cancer [5]. Additionally, many biomarker programs focused on plasma and tumor markers attempted to identify the predictive biomarker across different tumor types [6]. Moreover, most of that analysis was retrospective and based on predefined cut-off selection levels, with the exception of the ovarian cancer study to test the biomarker combinations [7, 8].
Existing data in biomarker programs have some limitations; for example, a list of predefined measured biomarkers. Some authors [6] claim feasibility in replicating existing results due to assessments of the same panel of biomarkers across different tumor types. Therefore, the lack of large biomarker programs in the same indications does not allow their validation in independent data cohorts. Moreover, single biomarkers at data-driven levels might not sufficiently identify the predictive value of complex angiogenesis processes. The mentioned authors [6] proposed the integration of markers into panels to achieve predictive scores.
The prospective biomarker program in the AVAGAST phase III gastric tumor study is one of the largest in terms of collected samples of plasma and tumor biomarkers. The previous exploratory analysis revealed plasma VEGF-A and tumor neuropilin-1 as predictive biomarker candidates [9] at their median cut-off selection. However, the panel of tested biomarkers consists of plasma circulating VEGF-A, tumor marker VEGF-A expression, VEGFR-1, VEGFR-2 receptors, and neuropilin-1 and could be a source of the further research in identifying the potential predictive biomarker scores.
Aim
The main hypothesis of this retrospective exploratory biomarker analysis is the identification of dichotomization levels based on optimal selection driven by the predictive value of single biomarkers. The outcome of interest optimization might unveil additional treatment benefits. Furthermore, testing the biomarker pairs at their optimal cut-off selection might provide predictive score candidates. Importantly, the AVAGAST study, with its large biomarker scale program, allows the implementation of resampling methods to adjust those results. In the literature of prognostic biomarkers, there are methods adjusting the p-value of a generated hypothesis based on multi-testing approaches. One of those is the 2-fold cross-validation methodology proposed by Faraggi and Simon [10].
Material and methods
The study design was described in detail [11] for this phase III study – “multinational, randomized, placebo-controlled trial designed to evaluate the efficacy of adding bevacizumab to capecitabine-cisplatin in the first-line treatment of advanced gastric cancer”. Details of the sample collection and its assessment were also described elsewhere [9]. The AVAGAST biomarker program was one of the largest prospective programs with a high rate of collected samples and prospectively designed study. Patients included in the prospective biomarker gastric cancer study program contained 712 plasma samples and 727 tumor samples, which is 92% and 94%, respectively, of the overall randomized population.
Statistical analysis
This analysis is divided into three steps. Firstly, the optimal selection of single biomarkers is estimated by maximizing the outcome of the predictive value utilizing the main efficacy endpoints: overall survival and progression-free survival during the first-line treatment. The Cox proportional hazard models with randomized treatment group, dichotomized biomarker, and the interaction of treatment with the dichotomized biomarker were optimized for the smallest interaction p-value of the Wald test. Using this model, in the range of 20th to 80th percentile, each of the biomarker values was used to dichotomize biomarkers and the interaction.
In the second step, the revealed optimum levels of each biomarker using forest plots resulted in the identification of promising groups, showing the maximum benefit of the experimental versus placebo arm. Based on those results, biomarker pairs were identified and followed by quadrant analysis of their combinations, which led to the identification of the new biomarker scores. The results of the newly identified subgroup might be biased due to the multiple testing in identifying the optimal cut-off selection at dichotomization.
Lastly, the new candidate’s binary predictive biomarker scores were adjusted for the interaction of the biomarker with treatment utilizing 500 resampling 2-fold cross-validation. The adjusted p-value was calculated as an average of all 500 values resulting from the proposed method by the authors [10] in the predictive biomarker setting.
Results
Comparison of results at the median and optimal cut-off
Continuous biomarker candidates were analysed, and their cut-off selection at the optimal level was determined using the multi-testing approach. The outcome of interest was the minimization of the interaction p-value of the Wald-test based on the overall survival and progression-free survival.
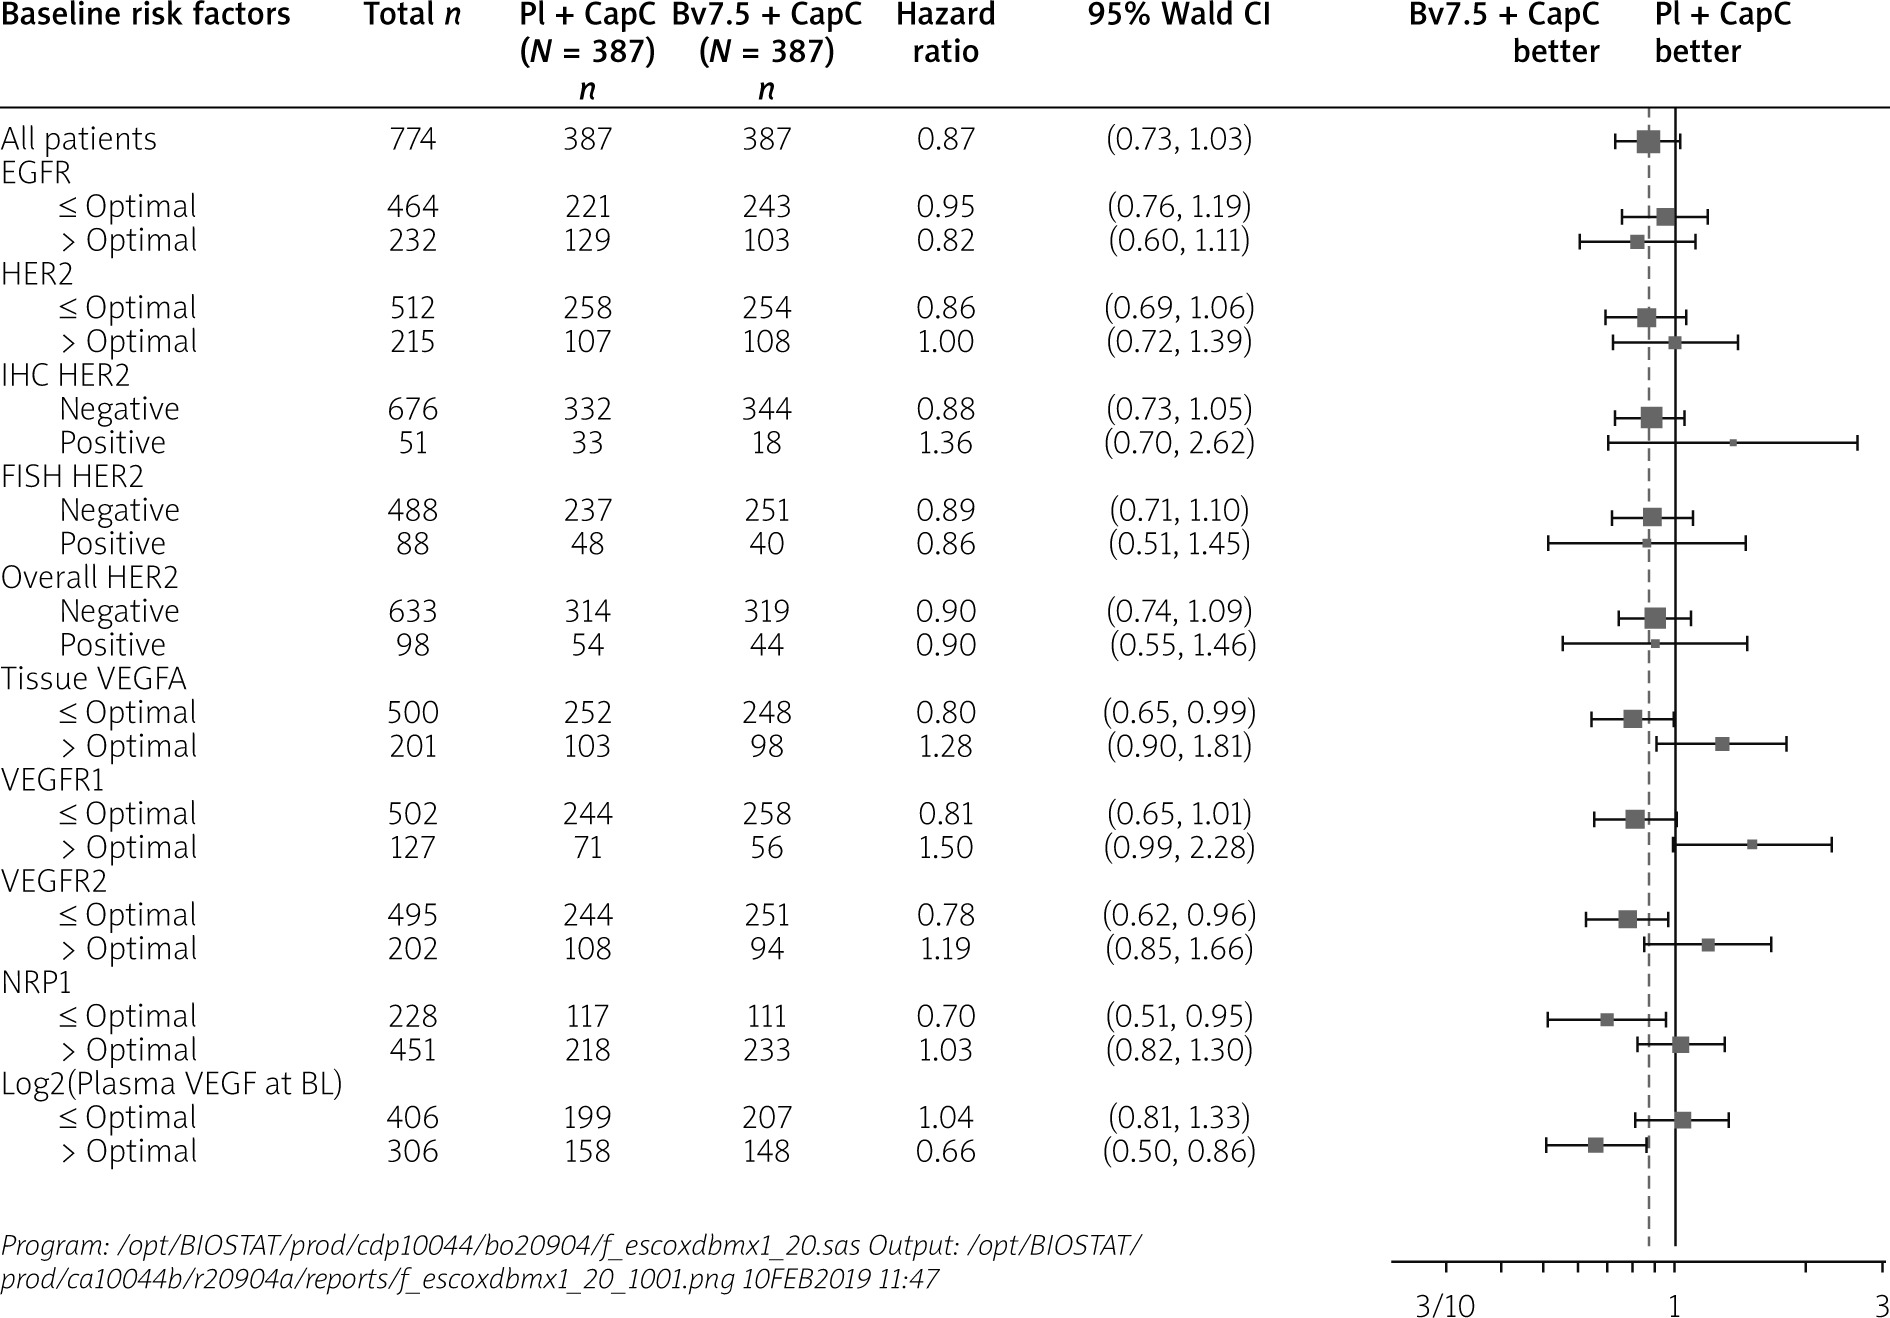
The Forest plots of hazard ratios for overall survival are shown in Figure 1 at their optimal selection levels. Those results unveiled greater sensitivity for the low VEGF-A (HR = 0.80; 95% CI: 0.65 to 0.99), low VEGF-R1 (HR = 0.81; 95% CI: 0.65 to 1.01), low VEGF-R2 (HR = 0.78; 95% CI: 0.62 to 0.96), low NRP1 HR (HR = 0.70; 95% CI: 0.51 to 0.95), and high baseline plasma VEGF-A (HR = 0.66; 95% CI: 0.5 to 0.86). Observed improvements in comparison to median cut-off selection based on Van Cutsem et al., 2012 are subject to the optimal selection of the dichotomization levels. In comparison to the dichotomization measures of biomarkers at their median level, a general trend could be observed in favour of the bevacizumab arm, especially for Tissue VEGF-A, VEGFR2, where the HR and the confidence intervals are below one. Previously identified potential biomarker candidates [9] – plasma VEGF-A and tumor Neuropilin-1 – improve their hazard ratios. However, the overall survival analysis at optimal selection also provides new insights into the negative biomarker population. It is important to note that the observed hazard ratio for VEGFR1 biomarker above the median cut-off selection was estimated at 0.98 with 305 patients in the subgroups, whereas in the group above the optimally selected cut-off level the hazard ratio was estimated at 1.5 for a subgroup of 127 patients. It might be important in defining the biomarker scores, where the subpopulation based on the optimal selection level might unveil the non-responder groups.
Figure 1
Forest plot of hazard ratios for overall survival dichotomized by the optimal cut-off level at baseline
EGFR – epidermal growth factor receptor, NRP1 – neuropilin-1, VEGFA – vascular endothelial growth factor-A, VEGFR1 – VEGF receptor-1, VEGFR2 – VEGF receptor-2.
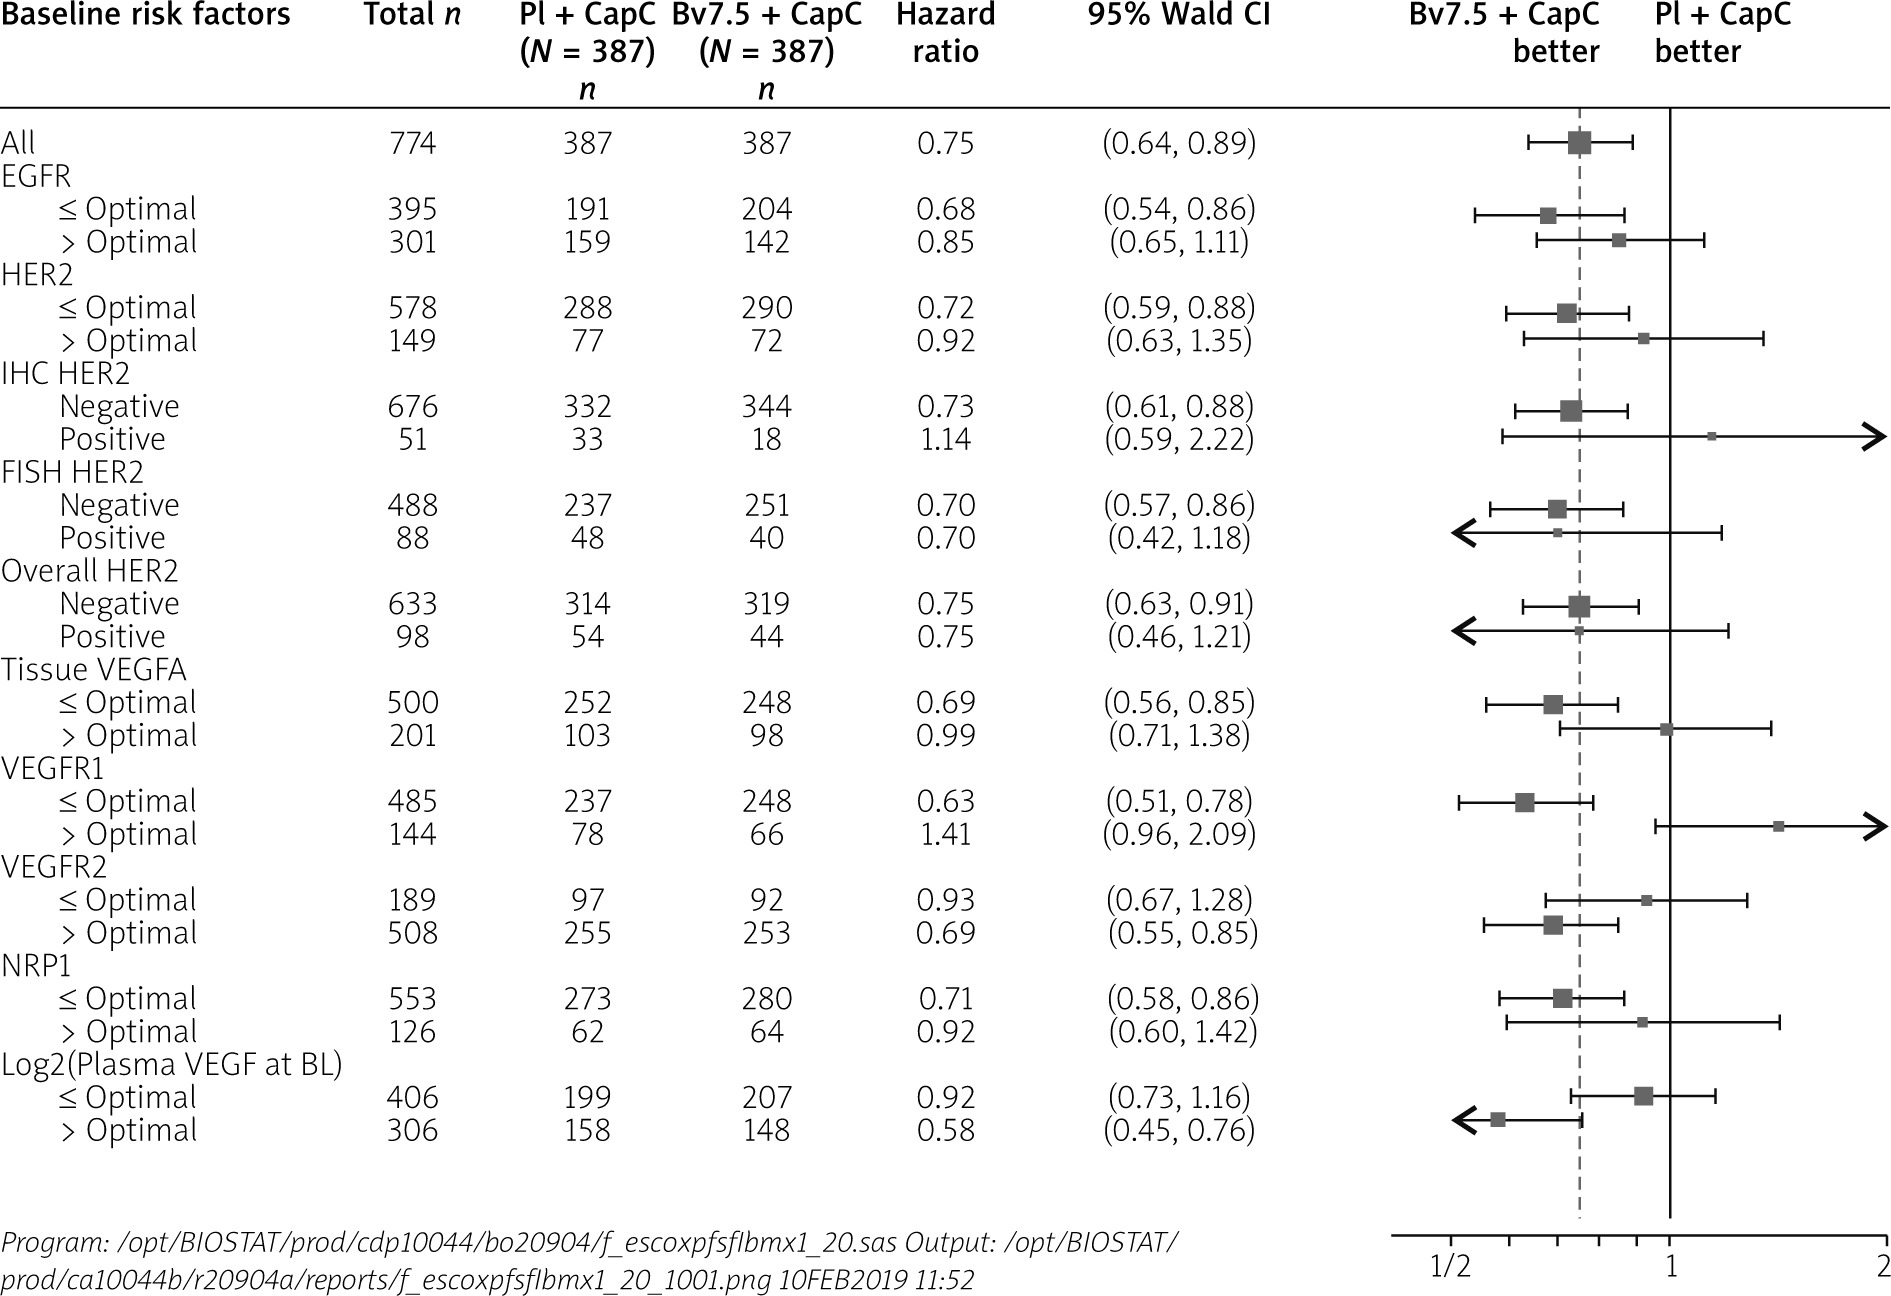
The progression-free survival during the first-line treatment results in comparison to the median cut-off selection provides more favourable optimal selections for the bevacizumab arm, as shown in the figure below.
Forest plots of hazard ratios for progression-free survival for the first-line treatment are presented (Figure 2) at their optimal selection levels. Those results unveiled more favourable measures among pre-specified biomarkers, e.g.: low VEGF-A (HR = 0.69; 95% CI: 0.56 to 0.85), low VEGF-R1 (HR = 0.63; 95% CI: 0.51 to 0.78), high VEGF-R2 (HR = 0.69; 95% CI: 0.55 to 0.85), low NRP1 HR (HR = 0.71; 95% CI: 0.58 to 0.86), and high baseline plasma VEGF-A (HR = 0.58; 95% CI: 0.45 to 0.76). Similarly to the overall survival, the improvements were observed in comparison to median-based results [9]. However, in both cases, those results need to be assessed cautiously and might require further prospective validation or adjustment of those results. The same trend was observed for the tissue VEGFR1 when compared to the median-based selected dichotomization. The observed hazard ratio above median level was estimated at 0.89 for a subgroup of 305 patients, and increased to 1.41 for a subgroup of patients above the optimally selected cut-off in the group of 144 patients. Finally, it should be noted that its optimal selection confirmed a trend and the potential of tumor expression markers as predictive biomarkers candidates.
Comparison of biomarker pairs at their optimal cut-off selection in quadrant analysis
The authors [9] in the main biomarker analysis for AVAGAST did not test the association of biomarker pairs. Individual biomarkers were only tested for association of their quartiles. Based on the second step of this analysis, the combination of dichotomized biomarkers in quadrant analysis was performed to generate the hypothesis of additional synergies of clinical benefit and improve the understanding of the angiogenesis process. Based on the results (Figures 1 and 2), the most promising tumor expression biomarkers were analysed further in quadrant analysis for both endpoints. For example, the progression-free survival during first-line therapy provides insights into the treatment benefit of bevacizumab when combining the biomarker information at their optimal selection levels.
The analysis of the tissue biomarker pair: low VEGFR1 and negative IHC HER2 shows an advantage of the bevacizumab arm among 448 patients (HR = 0.63; 95% CI: 0.50 to 0.78) – unadjusted results. Bevacizumab treatment demonstrates improvement of efficacy for progression-free survival in patients of this biomarker score. As indicated already above, the combination of selected biomarkers seems to have the strongest negative effect for IHC HER2 positive at HR = 1.22 and above the optimal selection of VEGFR1 at HR = 1.41 (Figure 3).
Figure 3
Forest plot for progression-free survival during the first line for tissue biomarker pairs VEGFR1 at optimal selection cut-off point and the negative IHC HER2
Baseline risk factors Pl + CapC (N = 387) Bv7.5 + CapC (N = 387) Hazard ratio 95% Wald CI Bv7.5 + CapC better Pl + CapC CI better
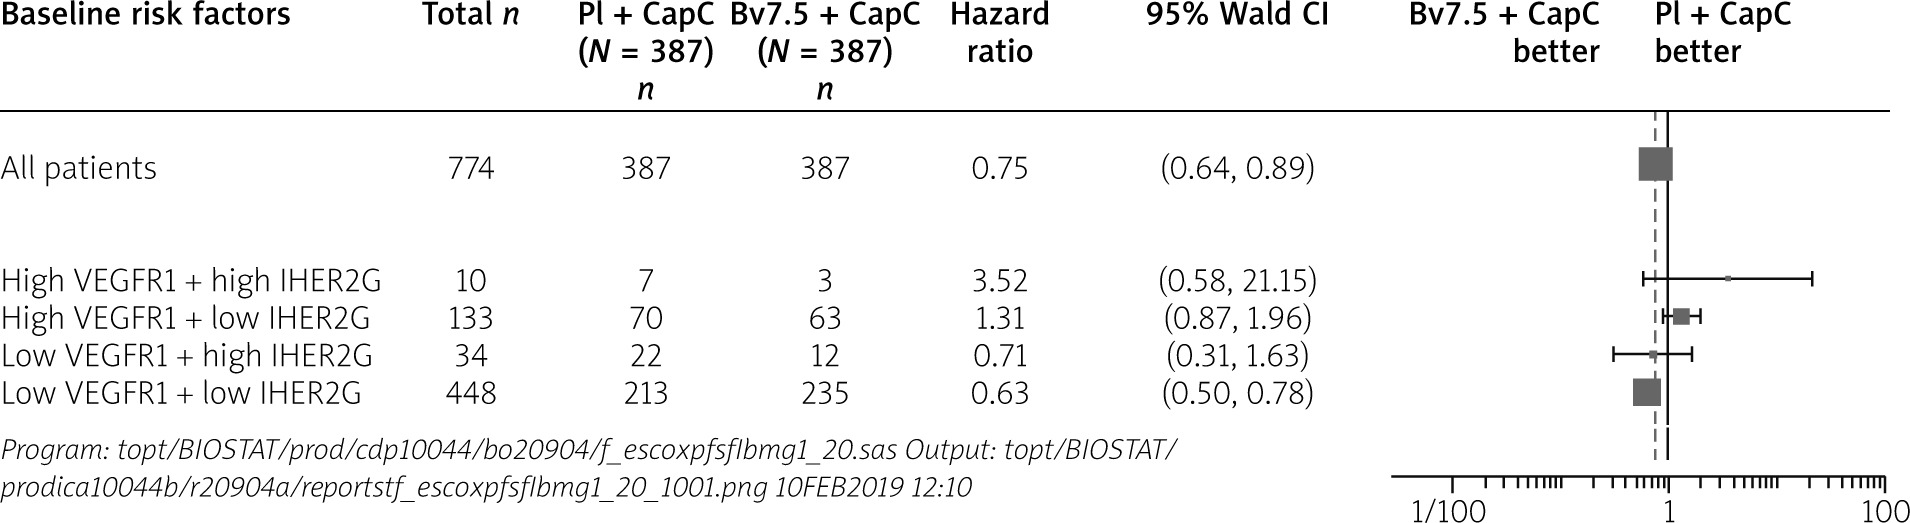
Among others, this pair of biomarkers was used further to construct the new biomarker score: low VEGFR1 and negative IHC HER2. It should be noted that new quadrant dichotomization selects 448 out of 774 of the randomized patients. Hence, the combination of optimally selected levels in those combinations discriminates a substantial part of the randomized patient between the bevacizumab-treated patients and a lack of this effect in the control-arm-treated patients. The unadjusted Wald-test of the interaction of the above score was significant. Therefore, it required further assessment.
In the last step, the new biomarker score was adjusted. The procedure of 500 times resampling of 2-fold cross-validation was used on the Wald-test to adjust the interaction p-value and provided the average of 0.0147094 from the estimated p-values. Therefore, the new biomarker score of low VEGFR1 and negative IHC HER2 was classified as significant after the adjustment. However, it also required a check for the bias of selected biomarker evaluable population patients.
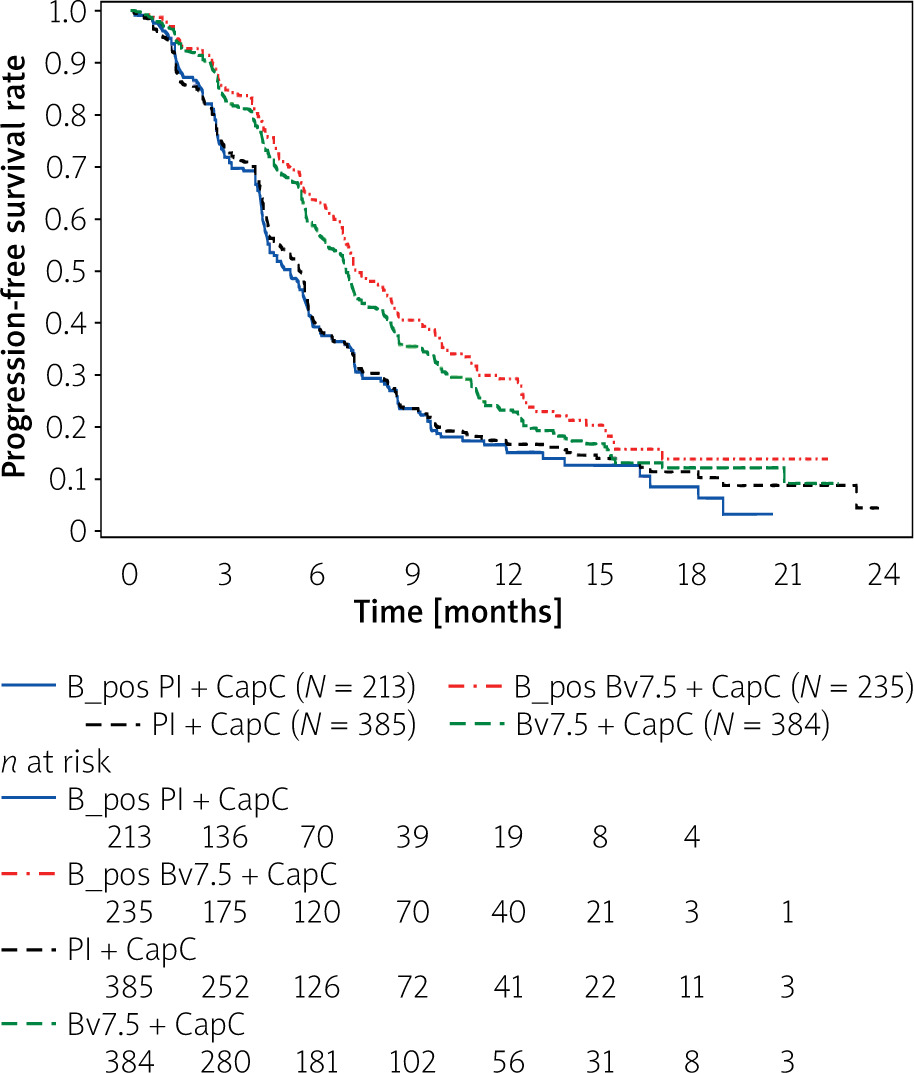
The above KM curves shown in Figure 4 show that the placebo arms denoted as B_pos Pl + CapC and Pl + CapC represent similar progression-free survival during the first line therapy. On the contrary, the survival benefit for the experimental arm provides the improvements between the ITT and the new biomarker-positive population low VEGFR1 and negative IHC HER2. The predefined biomarkers or their scores might result in a new subpopulation definition and extrapolation to the general population. Therefore, it is crucial to conduct this analysis and confirm that the efficacy improvement is not caused by the selected sub-population and the identified biomarker score.
Figure 4
Kaplan-Meier curve of new biomarker score noted as B_pos population versus the ITT population
Program: /opt/BIOSTAT/prod/cdp10044/bo20904/feratepfsfl1bep_20.sas Output: /opt/BIOSTAT/prod/ca10044b/r20904a/reports/f eratepfsfl1bep_20_1001.png 10FEB2019 12:11
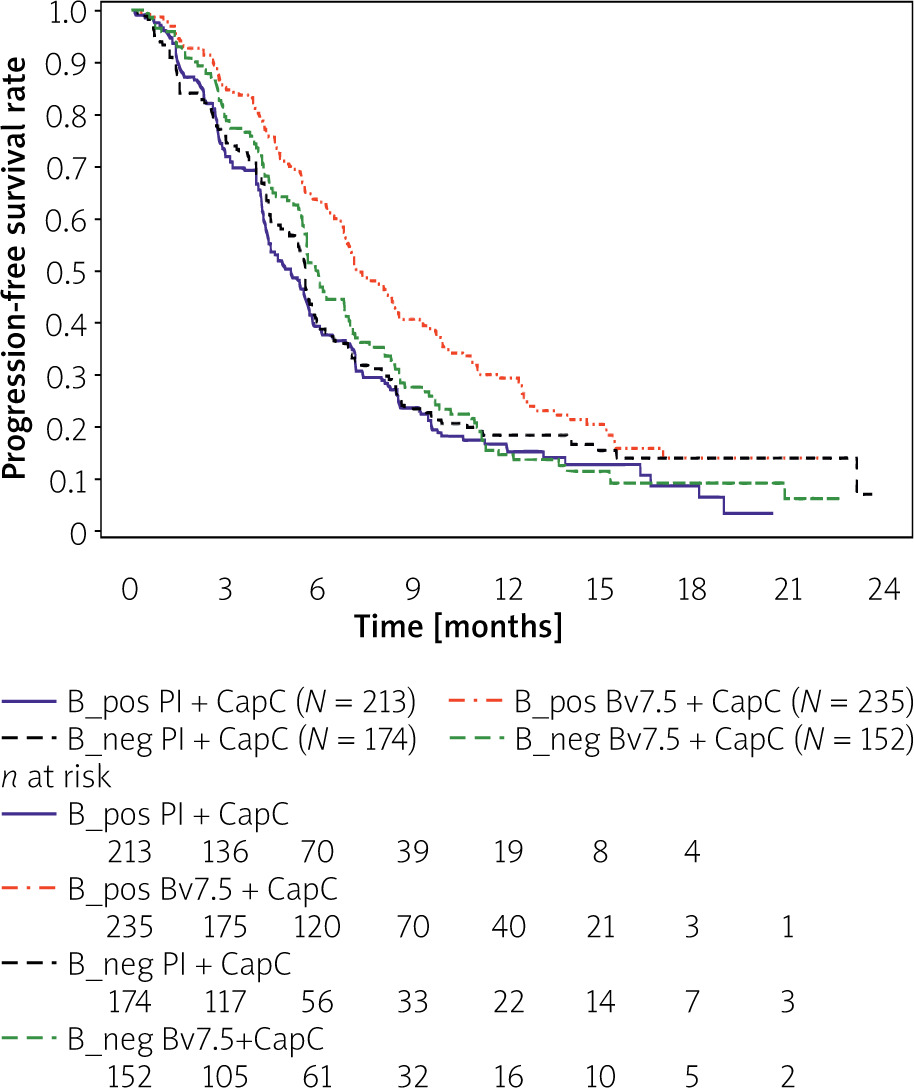
The predictive biomarkers could also be classified as qualitative or quantitative. To distinguish it, the additional analysis of the survival of positive and negative scores is required. The plot (Figure 5) shows both negative population Kaplan Meier curves denoted as B_neg Pl + CapC and B_neg Bv7.5 + CapC, which are located between the 2 positive biomarker curves: B_pos Pl + CapC and B_pos Bv7.5 + CapC.
Discussion
The results of these analyses provided new insights and hypotheses of a predictive biomarker candidate for the PFS – first line in patients with advanced gastric cancer treated with bevacizumab. The optimally selected cut-off values unveiled not only the subgroup of responders but also potential non-responders. Personalization of medicine aims to tailor the medication to patients based on the biomarkers’ make up, in this case by identifying two optimally selected biomarkers as a predictive candidate score. The subgroup of non-responders excluded from the group of treated patients boosted the PFS survival curve, as shown in Figure 5, indicating the quantitative type of the biomarker score.
The AVAGAST study had a mandatory biomarker program and collected over 92% of plasma and 94% of tumor samples at baseline, allowing a comprehensive analysis [9]. Moreover, those baseline biomarkers were carefully selected as potential candidates for planned analysis and generating of new hypotheses of the gastric disease and the tested active drug AVASTIN. The above results appeared to identify new biomarker pairs, the low VEGFR1 and negative IHC HER2, as a new predictive biomarker score candidate. The results of the interaction test were adjusted using the proposed method specific for the optimally selected biomarker baseline values. The main limitation of the optimally selected value is the multiplicity problem usually paired with the lack of an independent patient cohort in the process of validation of the generated hypothesis; specifically, the predictive biomarkers that are based on the study as a medical experiment with active and control arm, which requires conducting of a prospective clinical trial with a specific study design.
The adjustment of the generated hypothesis aims to overcome of the limitations of multiplicity, in selecting the responders and non-responders, by employing the cross-validation, proposed by [10] and additionally using random resampling of the existing cohort. The main feature of 2-flod cross-validation is assessment of the optimally selected values on the randomly chosen patients that were not involved in the process of optimal selection and dichotomization of the new biomarker scores. It reduces the bias of selecting the optimal cut-off, as resampling generates in each iteration randomly a “substitute” of the independent cohort from the rest of the patients, where the optimally selected value is applied. The final adjusted value is provided by averaging the results from the 500 resampling iterations. Therefore, the proposed resampling method might serve as an estimate of predictive biomarkers or biomarker score selection for prospective studies when using the optimal selected cut-off points. Moreover, providing the new scores as a combination of the single pre-planned biomarkers might unleash new insights into the biology of the disease and tested active treatment.
The other limitation of this analysis is the limited sample size to detect the interaction test in a given cohort as the phase III studies are usually powered to measure the main treatment effect. Simulations [12] show that it might be an important factor in detecting predictive biomarkers. On the other hand, simulations [13] show that using the clinical model with defined baseline covariates allows us to gain power in detecting the interaction effects.
It should be noted that the biomarker pair’s candidate was estimated on the progression-free survival during first-line therapy but was not found to be significant after adjustment on the overall survival, which was the primary efficacy endpoint. However, the exploratory analysis [9] suggested additional predictive activity among the non-Asian population, especially for the VEGFA. The above identified predictive score is significant regardless of patient origin, which might be important from the patient selection perspective.
Conclusions
The biomarker scores based on their combination might provide new insights into the treatment response. As mentioned earlier, one of the limitations is the existence of this patient cohort of the large phase III program. On the other hand, the analysed biomarkers were already preselected for this disease and treatment to generate potentially new hypotheses. The optimal cut-off selection points by definition aim to identify subpopulations that maximize the benefit to patients from the given treatment, but it carries the multiplicity problem. Therefore, adjustment of such results without the independent cohort is required. These biomarker score candidates are quantitative and for the selected subgroup present longer first-line PFS in comparison to the negative biomarker subgroup. The proposed analysis combined the above two ideas and additionally utilized the nested cross-validation method in the assessment of the predictive biomarker score.