


Introduction
Physical activity (PA) refers to any movement produced by skeletal muscles that results in energy expenditure [1]. The role of PA in maintaining health is well documented in scientific literature. It has positive effects on all anatomical systems, including the musculoskeletal, cardiorespiratory, visceral, and nervous systems. These benefits extend beyond physical performance to also include mental health improvements [2]. Conversely, a lack of PA leads to obesity, which is strongly associated with elevated blood pressure, cardiovascular issues, and low cardiorespiratory fitness—all of which are determinants of all-cause mortality in adulthood [3,4]. PA is the primary tool recommended to prevent and combat obesity. According to the World Health Organization and other entities, about 80% of young people do not engage in the minimum recommended PA [5,6]. This trend is also observed in Poland [7].
PA is an element of lifestyle that develops in childhood and is influenced by parental practices [8]. Parents can affect their children’s PA behaviors in various ways, including setting an example of an active lifestyle and supporting and promoting engagement in PA [9]. Well-identified parenting practices related to child PA include encouragement, support, and modeling [10,11]. Most research has focused on recognizing specific parental PA practices that ensure children want to participate in and engage in PA. Behaviors shaped in childhood and reinforced by parents are likely to persist into adulthood [12]. However, findings across studies are inconsistent [7,9,13]. Especially little is known about the similarities in PA patterns between parents and their adult children. Various methodologies, such as factor analysis, principal components analysis, or latent class analysis, have been used to identify relationships between subtypes of parent-child PA practices. Psychosocial, generational, and environmental correlates have also been studied [12,14].
Limited research has shown that imitating the behavior of a role model influences the PA of young adults [15]. Some studies suggest that current parental PA may influence adolescent PA [16]. Other authors have reported potential associations between parents’ and children’s PA, but these findings are not common [17]. To date, there is a lack of studies using a cophylogenetic approach, which allows a direct comparison of the component parts of PA by comparing cluster trees and cophenetic statistics [18]. Furthermore, there are no studies on the direct relationship between PA behaviors in adult children imitating their parents’ behaviors and their body mass condition.
Aim of the work
The main aim of the study was to examine the concordance of parent-child PA and inactivity patterns across a comprehensive set of domains, including leisure time, domestic and gardening (yard) activities, work-related activities, transport-related activities, and sitting time, and their potential association with adult children’s weight status. Specifically, the study aimed to: (1) analyze the quantitative differences in the volume of PA, both as a whole and in its individual components, (2) explore the concordance between parents’ and adult children’s PA patterns, (3) examine the potential relationship between children’s PA patterns that reflect their parents’ PA and their weight.
Material and methods
Sample size calculation
The main statistical approach conducted in this study was cophylogenetic tanglegrams and cluster analyses. Since there is no suitable power analysis for clustering methods, the rule recommended by Dalmaijer et al. [19] was applied. It is recommended to have a minimum of 30 participants per anticipated subgroup. Four clusters in each pairwise comparison (parent-child with sex variation) were assumed. Thus, a minimum of 120 males and 120 females were required. Ultimately, data from 288 participants (both parents and children) were analyzed.
Study design
Examinations were conducted in 2023 at the Wroclaw University of Health and Sport Sciences. Full details of the study design were published elsewhere [18]. Despite involving other participants, the research procedure remained the same as previously published. In brief, students were asked to complete an online survey and invite their parents to complete the same PA questionnaires. In this study, data from both parents and children were used. Additionally, parents self-reported their body height and weight, while the children’s measurements were taken personally by the author.
Participants
The study design and data collection is presented in Figure 1. Participants included 288 healthy individuals, comprising 46 mother-daughter pairs, 36 mother-son pairs, 33 father-daughter pairs, and 29 father-son pairs. The children were first-year students in the Faculty of Physical Education and Sport and Physiotherapy in 2023 at the Wroclaw University of Health and Sport Sciences. The proportions of males and females represented the true population in these fields of study.
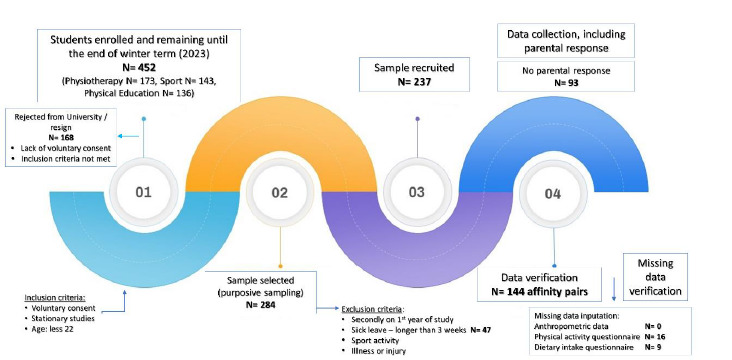
Preliminary inclusion criteria included students attending classroom courses who were under 22 years of age. The exclusion criteria included those participating in regulated sporting activities through the university and athletes with sport-classes or a mastery level class. A total of 237 students were accepted to participate in the examinations. For this work, the main inclusion criterion was the attendance of one of the parents (the more physically active parent). Finally, data from 144 students linked with their parents were included in the analyses.
Data collection
Data were collected using the Family Lifestyle Patterns (FAST-PAT23) local project, which evaluates various aspects including PA, dietary behaviors, attitudes toward a healthy lifestyle, and socio-economic determinants of family lifestyle. Closed-question questionnaires were administered using online Google forms immediately after an academic lecture (Human Anatomy taught by the author). Recruitment, data collection, and data entry were conducted by the author of this article. After completing the questionnaires, the students were successively examined (anthropometric measurements and body composition) over four consecutive weeks in March 2023 according to a set schedule. The study collected extensive information on the lifestyle of the students’ families surveyed; however, this work did not analyze variables related to economic and social status.
Measurements
PA of the students and their parents was assessed using the Polish version of the International Physical Activity Questionnaire (IPAQ), long-form. The questionnaire used in this work was prepared on Google forms in accordance with the guidelines for the document. The questionnaire consisted of 11 items assessing PA, divided into four domains: school or work, transport, housework/gardening, and leisure time activity levels. The twelfth item measured time spent sitting. The information related to PA can be transformed into Metabolic Energy Turnover (MET) in MET-min/week. In this study, results calculated for overall IPAQ scores, main domains (total vigorous, total moderate, and total walking activity), main domains (domestic-yard domain, transport domain, leisure time domain, work domain), and sitting time were used in the analyses.
Anthropometric measurements were conducted in the Biokinetics Research Laboratory (part of the Central Research Laboratory) of Wroclaw University of Health and Sport Sciences. This facility has Quality Management System Certificates PN-EN ISO 9001: 2009 (Certificate Reg. No.: PW-48606-10E) and PN-EN ISO 9001:2015 (Certificate Reg. No.: PW-15105-22X). Two body height measurements were taken with an accuracy of 0.1 cm using an anthropometer (GPM Anthropological Instruments). Body weight was measured with a body composition analyzer using the InBody230 tool (InBody Co., Ltd., Cerritos, CA, USA). Body mass index (BMI) was calculated using the formula:
Based on BMI values, participants were separated into three categories: lower mass (BMI<22.0), average mass (22.0<BMI<24.0) and exceeded (BMI>24.0).
Handling and imputation of missing data
Although there were no missing data in the anthropometric and body composition measurements, there were missing data on the IPAQ (n=16). Since cluster analysis requires there to be no missing data, all measurements were preprocessed by applying multiple imputations. In this study, the propensity for a data point to be missing was completely random, known as missing completely at random (MCAR). There was no relationship between whether a data point was missing and any other values in the data set. Imputation was conducted in the R language using RStudio software v. 2022.7.1.554 (RStudio Team (2022). RStudio: Integrated Development Environment for R. RStudio, PBC, Boston, MA, USA URL http://www.rstudio.com/ (accessed on 30 March 2023)) with the package mice (v.3.14.0).
Statistics
Before conducting the statistical analysis, the distribution of the data was assessed. The Shapiro-Wilk test was used to evaluate the normality of data distribution, and the Brown-Forsyth test was applied to assess the equality of variances between groups. Variables identified as non-normally distributed were transformed to achieve a normal distribution. To transform data with zero values into a more normal distribution, the Yeo-Johnson power transformation was used. Separate transformations were performed for parents and children, but for the entire group of participants without sex separation. The R package car was used for these transformations.
Statistical characteristics for continuous variables were presented as means, medians, and 95% confidence intervals (CI). To compare all outcomes between groups, a one-way analysis of variance (ANOVA) was conducted, using combined family affinity categories (e.g., son-of-father, father-of-son, etc.) as levels (eight combinations were registered). Bonferroni post-hoc tests were used for detailed comparisons.
Patterns of PA behavior between parents and children were studied using tanglegrams and cophenetic statistics (derived from a cophylogenetic approach). To assess similarities and conformity/concordance between parent-child patterns, tanglegrams were drawn, and cophenetic statistics were calculated. Distances between variables were characterized by mean, standard deviation, minimum, maximum, and range values. The Mantel test was used to assess correlations between two distance matrices, with p-values calculated. For single dendrograms, Baker’s Gamma correlations (rBG) were calculated [20].
To facilitate the selection of common items, specific functions implemented in the R language were used. These functions plot two trees side by side, highlighting edges unique to each tree in red, while common edges are shown in black. This visual representation aids in decision-making. Additionally, the functions perform a global comparison of two or more dendrograms, printing the names of unique edges. By eliminating unique edges, the most common edges can be identified. Items repeatedly identified by these two functions were found to be the most common for all family pairs.
To study the potential relationship between identified PA patterns reflecting parental PA and BMI, two variants of regression analyses were conducted. In the first variant, BMI results were treated as continuous data, and the effect of independent variables (PA patterns) on BMI was examined with multiple simple regression. In the second variant, BMI was categorized into three groups: lower mass, normal mass, and overweight. In this case, BMI results represent an ascending ordinal scale. The appropriate modeling approach for ordinal outcomes is ordinal logistic regression. In this study, proportional odds logistic regression was used, which is the most commonly adopted approach.
The significance level for all statistical tests and procedures was set at an α-value of 0.05. Calculations were conducted using Statistica 13.5 (StatSoft Poland 2023, Cracow, Poland) and RStudio v.2024.04.2+764 (R Core Team (2022). R Foundation for Statistical Computing, Vienna, Austria. URL: https://www.R-project.org/).
Results
Statistical characteristics of anthropometric and PA measurements with ANOVA results for comparisons between parents and separately in children are presented in Tables 1 and 2. Results of the post-hoc comparisons with Bonferroni correction are included in the text in brackets.
Table 1
Descriptive statistics (M, SD, 95%CI) of adult children: data of the adult children (sons and daughters) of their parents (fathers and mothers)
Table 2
Descriptive statistics (M, SD, 95% CI) of parents: data of the parents (fathers and mothers) of their adult children (sons and daughters)
Within the group of children, boys were significantly taller and heavier than girls (p<0.001). However, only sons of mothers differed in BMI from daughters of mothers (p=0.004) and fathers (p=0.009). Sons of mothers had the highest PA (transformed IPAQ value) compared to the rest of the groups. The differences were significant when compared to the daughters of mothers (p<0.001) and daughters of fathers (p=0.034). However, there were no significant differences between boys, girls, and sons of fathers when compared to all daughters. The same trend was observed for leisure time and total vigorous activity (p<0.001 for all differences).
Within the group of parents, fathers (sons and daughters both) were significantly taller (p<0.001) and heavier (p<0.001 for fathers of sons compared to all mothers; p=0.013 for fathers of daughters compared to mothers of sons; p=0.007 for fathers of daughters compared to mothers of daughters). Fathers of daughters had significantly higher IPAQ scores than mothers of sons (p=0.011) and mothers of daughters (p=0.005), with no difference from fathers of daughters. Fathers of sons significantly differed only from mothers of daughters (p=0.004). No other differences were significant.
Patterns of PA in family affinity comparisons
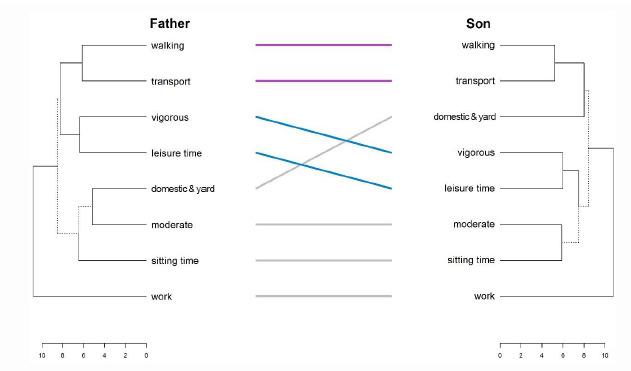
The tanglegram of the dendrograms generated based on PA load (domains and intensity) and inactivity (sitting time) between fathers and sons is shown in Figure 2. Fathers’ PA consists of three clusters: the 1st cluster contains walking and transport linked together, connected with vigorous activity in leisure time; the 2nd cluster contains domestic and yard activity with moderate intensity and inactivity, while the 3rd cluster is work activity alone. Sons’ PA is quite similar and also consists of three clusters: the 1st cluster contains walking and transport, which are closely related to the fathers’ activity, and domestic yard activity; the 2nd cluster contains vigorous activity in leisure time in one clade, as well as moderate activity and inactivity; the 3rd cluster is work activity alone. Great alignment between father-son structures of PA is confirmed by the entanglement coefficient (0.07), while strong associations are confirmed by cophenetic statistics. The average distances between fathers and sons were 7.49 (±1.40) and 7.50 (±1.37), respectively. Baker’s Gamma correlation coefficient for the two trees (also known as the Goodman-Kruskal gamma index) shows that the tree’s topology is congruent, and the medium relationship is significant (rBG=0.67, p=0.021).
Figure 2
Tanglegram of PA patterns in family pairs: fathers and sons
Notes: Primary dendrograms were untangled. Color lines highlight straight conformity between PA items.
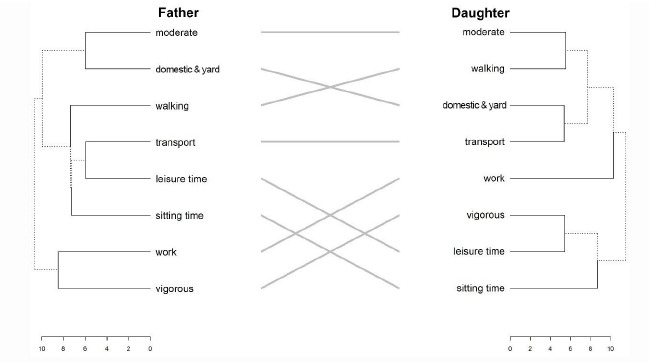
Comparing the tanglegram for fathers and daughters (Figure 3), incongruence is evident. The structure of the fathers’ PA is less ordered than that of the daughters and tends to produce long, chain-like clusters. In contrast, daughters have a more ordered structure of PA, with three clear clusters. The entanglement coefficient of 0.71 is much higher than in the father-son comparison. The average distances between fathers and daughters are longer compared to the father-son distances (8.03±1.26 and 7.96±1.64, respectively). The strength of associations between patterns was very low and statistically insignificant (rBG=0.03, p=0.32).
Figure 3
Tanglegram of PA patterns in family pairs: fathers and daughters
Notes: Primary dendrograms were untangled. Color lines highlight straight conformity between PA items.
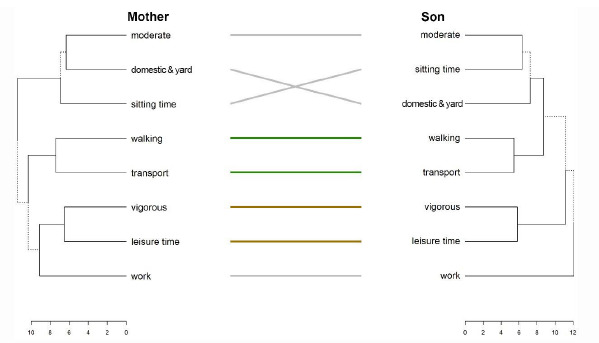
Comparing the tanglegram for mothers and sons (Figure 4), quite similar patterns in PA are observed. Both structures consist of three clusters. Except for the 1st cluster, which contains different items, the 2nd and 3rd clusters are similar, containing walking and transport, vigorous activity in leisure time, and the work domain. This similarity is confirmed by a very low entanglement coefficient of 0.03. The average distances between mothers and sons were 8.38±1.37 and 8.29±1.81, respectively. The high value of the standard deviation indicates more loose links in sons than in mothers. Baker’s Gamma correlation coefficient shows a small and not significant correlation between the trees (rBG=0.26, p=0.166).
Figure 4
Tanglegram of PA patterns in family pairs: mothers and sons Notes: Primary dendrograms were untangled. Color lines highlight straight conformity between PA items.
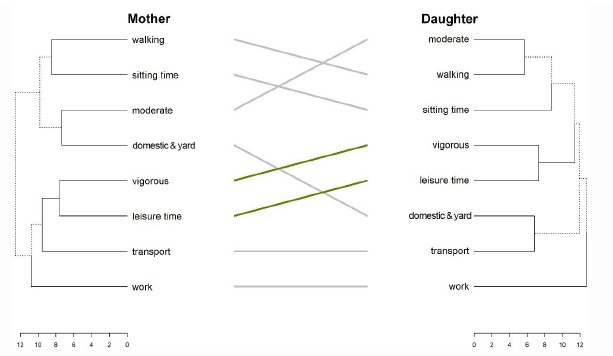
The last comparison is related to the PA patterns of mothers and daughters (Figure 5). The structure of mothers’ PA was more ordered, with two large clusters, each containing four items: the 1st cluster included walking activity and inactivity, as well as moderate activity linked to domestic and yard activities; the 2nd cluster included vigorous activity in leisure time, transport, and work activity. In contrast, the daughters’ structure produced long, chain-like clusters. However, there is a similarity to the mothers in vigorous activity during leisure time. The structures showed medium entanglement with a coefficient of 0.11. The average distances between mothers and daughters were long, measured at 9.53±1.12 and 9.43±1.78, respectively. The similarity between the two trees of hierarchical clustering was low, as confirmed by the small but significant value of Baker’s Gamma (rBG=0.16, p=0.012).
Specific dietary behaviors in relation to overweight
Using dedicated functions in R, the elements of PA most common to the affinity pairs were extracted. For sons, these elements were walking, transport domains, and vigorous intensity in leisure time. For daughters, these elements were vigorous activity in leisure time, work domain, and moderate activity. These PA patterns, common for both adult children and parents, were tested as potential determinants of BMI. Additionally, IPAQ overall scores and sitting time, representing inactivity, were included in the models. The results of the stepwise backward linear regression, identifying the two best predictors, are presented in Table 3.
Table 3
Determinants of BMI (scores) in adult sons in a stepwise backward linear regression
For adult sons, the most significant determinants of BMI were the overall IPAQ scores and vigorous activity. Higher overall PA was associated with a lower BMI (b=-0.04, p<0.001), while lower levels of vigorous PA were associated with an increased BMI (b=0.02, p=0.022). For adult daughters, the most significant determinant of BMI was the overall IPAQ scores. Higher levels of PA were associated with a lower BMI (b=0.02, p=0.015). Both models were statistically significant, although they had low accuracy, explaining 23% of BMI variation in sons (R2=0.23, p<0.001) and 6% of BMI variation in daughters (R2=0.06, p=0.015) (Table 3).
The final analysis assessed the likelihood of being in the lower mass (BMI<22), medium mass (22>BMI>24), and higher mass (BMI>24) categories. This analysis was conducted using proportional odds logistic regression. The results are presented in Table 4. For sons, the IPAQ score was the only significant variable affecting BMI status, while vigorous activity and leisure time were close to significance. Each additional score in IPAQ (in terms of energy expended in MET) was associated with approximately 4% lower odds of having a higher BMI status. For daughters, the model for the same BMI categories was less well-fitted compared to the sons’ model, as confirmed by lower values of all accuracy statistics. None of the variables were significantly associated with a higher likelihood of higher BMI status.
Table 4
Determinants of BMI (ranges) in adult sons in a proportional regression
Discussion
The main purpose of this work was to examine the concordance/conformity of parent-child PA and inactivity patterns and their potential association with adult children’s weight status. The main results of this study were: (1) there was incongruence in the quantitative results of PA between parents and their adult children, sons of mothers had the highest PA (overall scores, leisure time, and vigorous activity), while among parents, the highest PA was observed in fathers of daughters (in IPAQ scores and moderate activity); (2) tanglegrams identified the highest similarities between fathers and their sons and mothers and their sons (in walking intensity, transport domain, and vigorous activity in leisure time); (3) specific subtypes of PA patterns and the total load of PA were related to BMI, with stronger associations in the groups of sons; higher levels of activity, particularly vigorous activity, were associated with lower BMI and a reduced likelihood of increased body weight.
A wide array of quantitative and qualitative research has been conducted in relation to parental PA. However, much of the research focuses on mothers, the general population in North America, and parents of younger children [21]. Some studies have shown an inverse association between fathers and adolescents in moderate-to-vigorous physical activity (MVPA) and between mothers and adolescents in out-of-school and weekend MVPA [22]. From this perspective, this study aligns with these findings when considering the quantitative results. Moreover, the present study’s results are consistent with findings showing an inverse association in MVPA between mothers and daughters in different parental subpatterns of PA [23,24]. However, results across studies are generally inconsistent. The association between parents’ current PA practices and adolescents’ PA has also been observed in other studies [25,26]. This can be explained by adolescents imitating their parents’ behavior, influenced by parents’ encouragement and support in early childhood, including financial support. When focusing on family affinity, the father-child relationship tends to be stronger than the mother-child relationship and is more related to the load and intensity of PA rather than specific domains [27]. In this aspect, this work partially overlaps with these findings. The challenge, however, is the differing methodologies of benchmark studies, which complicate direct comparisons.
The novelty of this study lies in the analysis of the association between parents’ and adult children’s PA using a cophylogenetic approach with tanglegrams. Such an approach is not commonly found in research on lifestyle patterns, including PA. The close connections found in overall scores, leisure time, and vigorous activity subpatterns in sons (independent of the parent’s sex) can be explained by the greater ease with which boys mimic the patterns of their active parents [28]. In this research, the questionnaire was completed by the more active parent. Craig et al. [29] observed positive relationships between fathers and children, fathers and daughters, and mothers and children’s PA, but not between mothers and daughters. However, the influence of a parent’s gender on children’s PA levels is controversial in the literature [27].
In the case of boys, these patterns reproduced from parents are linked to weight levels and BMI status. However, the patterns are limited to total PA load (IPAQ score) and vigorous activity. There is a lack of studies assessing the relationship between identified common parent-child PA subpatterns and the children’s body mass condition. However, the parent’s PA load has been studied as a potential predictor of children’s obesity [30]. For example, parent inactivity has been found to be a strong and positive predictor of child inactivity, while parent activity was a somewhat weaker predictor of child vigorous activity and child obesity [31]. Interestingly, even in the case of overweight/obese mothers and fathers, children involved in a PA intervention program ≥ three times a week had a significantly lower prevalence of obesity (p<0.002) compared to children without a PA program (6.7%/4.2% vs. 14.9%/10.7%) [31].
A limitation of the study is the lack of a control group from the same environment and social range as the participants, but not involved in university studies related to physical education, sport, or physiotherapy. Another limitation is the absence of body composition analysis, particularly body fat composition. Although data for students were collected, data for the parents were not available, hence the analysis only included BMI. The next limitation is the fact that PA was not objectively measured and that the anthropometric data from parents were not collected in the laboratory. Similarly, the participants were students at a physical education, sports and physiotherapy university, which could also bias the results. The cross-sectional design, rather than longitudinal observations, also limits the results. Moreover, a non-probabilistic sample was selected, based on parents’ responses to the study invitation. Future analyses should also take into account the economic and social status of the students surveyed and the various elements of family lifestyle. In addition, efforts should be made to measure all groups (including parents of adult offspring) under laboratory conditions, rather than relying solely on self-reported data. Specifically, body composition should be measured, taking into account body fat, to calculate body mass status more precisely than by the use of BMI.
Conclusions
This study’s findings did not confirm that young adults whose parents had a high load of PA were more likely to be physically active. However, it was observed that there was a relationship between specific subtypes of PA between parents and their adult children, with sons primarily imitating their parents’ PA behaviors. Specifically, vigorous activity during leisure time and the form of transport to work or school were commonly shared between parents and sons. Interestingly, it does not matter whether the pattern is from fathers or mothers. These similar parent-son subtypes of PA may be related to adult sons’ BMI. Therefore, the promotion of PA in males should consider the family unit and not just the young adults in isolation. In contrast, the PA structure of daughters does not align with that of their parents. They exhibit an individual style, likely shaped by other factors. Further research in this area should focus on identifying the determinants, needs, and interests that differ from those of boys. When planning PA interventions, a counseling approach with parents to advocate for the use of various PA practices to motivate their children to participate in PA may prove effective.