
Introduction
Nonalcoholic steatohepatitis (NASH) is a form of chronic liver disease, which is marked by liver inflammation and results from accumulation of fat in the liver. It is a progressive form of a group of conditions called nonalcoholic fatty liver disease (NAFLD) [1]. There is a strong association between NASH and metabolic syndromes, particularly obesity and type 2 diabetes [2]. NASH can lead to multiple hepatic and cardiovascular complications, which in turn increase the overall mortality rate [3]. Notably, NASH is the commonest cause of chronic liver disease, but no definitive therapies exist for its management or cure.
The first-line treatment for NASH is risk factor modification, which includes management of underlying diabetes and obesity. Weight loss contributes to a reduction of fat and overall inflammation of the liver. Currently, several research studies are being conducted to study the effect of antidiabetic drugs on NASH [4, 5]. Glucagon-like peptide-1 (GLP-1) analogues, used in type 2 diabetes, have been postulated to play a role in the management of NASH [6]. However, definitive guidelines to direct this therapy are scarce.
Liraglutide is a U.S. Food and Drug Administration (FDA)-approved GLP-1 receptor agonist (GLP-1RA) used in the management of type 2 diabetes mellitus. It acts by glucose-dependent stimulation of insulin secretion, delaying gastric emptying, decreasing appetite, and reducing plasma glucagon concentrations [5]. Delayed gastric emptying and appetite suppression are the main proposed mechanisms responsible for the weight-lowering effects of GLP-1 [5]. In their native forms, GLP-1 analogues have a very short half-life and are metabolized within minutes by dipeptidyl peptidase-4 (DPP-4) enzyme and neutral endopeptidases (NEP) [7]. Therefore, amino acids in liraglutide are substituted and engineered to maximize its peak absorption to 11 h and absolute bioavailability of 55%, thus allowing for its once-daily subcutaneous dosing.
A study by Gao et al. involving rats showed that liraglutide has anti-oxidative and anti-inflammatory effects in the liver and can consequently reverse hepatic steatosis and insulin resistance [8]. Multiple randomized controlled trials (RCTs) have now been conducted to study the effects and monitor side events of this drug on human subjects.
Aim
Herein, we perform a meta-analysis to pool the results of similar RCTs available to date in order to report the effect of liraglutide on biochemical markers in patients with biopsy-proven NASH.
Material and methods
Literature search
We searched 4 databases: Web of Science, SCOPUS, Cochrane CENTRAL, and PubMed, from inception until October 2020. We followed this search strategy with no restriction on time or languages: liraglutide OR saxenda OR Saxena OR Victoza AND non-alcoholic steatohepatitis. We exported the search results into Endnote X8.0.1 (Build 1044), with the removal of duplicates automatically by computer.
Inclusion and exclusion criteria
A single investigator reviewed the title and abstracts of all citations identified by our search of the aforementioned 4 databases. The investigator also retrieved and reviewed the full-text versions for the preliminary studies shortlisted initially. The following exclusion and inclusion criteria were applied:
Inclusion criteria: We included only the RCTs that assessed the efficacy of liraglutide regardless of the dose and the mode of drug administration in patients with NASH. The primary outcomes were change in the biochemical markers: alanine aminotransferase (ALT) (IU/l), aspartate aminotransferase (AST) (IU/l), alkaline phosphatase (ALP) (IU/l), and γ-glutamyl transferase (GGT) (IU/l). The secondary outcomes included body mass index (BMI) (kg/m2), waist circumference (cm), total cholesterol (mmol/l), triglyceride (mmol/l), high-density lipoprotein (HDL) (mmol/l), low-density lipoprotein LDL (mmol/l), and glycated hemoglobin (HbA1c) (%).
Exclusion criteria: We excluded all non-randomized controlled clinical trials, studies that did not report data or measures for our selected outcomes, and studies with no available full-text forms.
Data extraction
Two authors (A.M. and W.A.) independently performed the screening steps and searched for the full-text files of all included studies, which met our selection criteria. A third author (F.I.) solved any deflection. The following data in 2 subgroups was extracted from the selected studies:
Baseline and demographic data of patients in each study, including age, sample size, sex, BMI, ALT, AST, GGT, total cholesterol, triglyceride, HDL, LDL, and HbA1c.
Data for analysis, including outcome values of ALT, AST, AP, GGT, BMI, waist circumference, total cholesterol, triglyceride, HDL, LDL, and HbA1c (%).
In addition to the previous 2 categories, we also extracted the data about the 7 domains assessing the risk of bias according to Cochrane’s risk of bias [9].
Quality assessment
We evaluated the quality of this systematic review and meta-analysis using the Grading of Recommendations Assessment, Development, and Evaluation (GRADE) guidelines. We included only the RCTs and excluded the observational evidence. According to the Cochrane risk of bias (ROB) tool for clinical trials, we performed the risk of bias (ROB) for the included studies. The tool depends on the following domains for assessment of the risk of bias: 1) proper randomization, 2) blinding allocation of the included patients into each group, 3) blinding of patients only (single-blinding), blinding of both personnel and participants (double-blinding), or not blinding at all, 4) attrition bias, 5) selection bias (outcomes reported matches with that of the protocol or not), 6) awareness of the outcome assessor (whether blinded or not), and 7) Other bias. The total risk of bias for the studies was also assessed.
Statistical analysis
We used Review Manager Software (RevMan version 5.4.1) to perform analysis under the inverse variance method. We expressed dichotomous outcomes using percentage and total, while continuous outcomes were described using mean difference (MD) and standard deviation (SD), relative to 95% confidence interval (CI). Two main tests indicate inconsistency among studies: the I-square test (I2) and the p-value of the χ2 test. The outcomes with I2 > 50%, p < 0.1 were considered heterogeneous, while outcomes with I2 < 50%, p > 0.1 were considered homogeneous, according to the Cochrane Handbook. Homogenous data were analysed using a fixed-effects model, while heterogeneous outcomes were analysed using the random-effects model.
This meta-analysis was performed according to the Preferred Reporting Items for Systematic Reviews and Meta-Analyses (PRISMA) [10] and the guidelines reported in the Cochrane Handbook for Systematic Reviews of Interventions [10, 11].
Results
Selection and characteristics of studies
The results of the literature search are shown in Figure 1. The search strategy yielded 45 relevant studies. Five studies met our inclusion criteria. A total of 180 patients were included in these 5 RCTs [12–16]. Of 180 patients, 89 received liraglutide in the treatment group, and 91 patients were assigned to the control group. The mean age of the treatment group was 56.2 ±9.18 years, while that of the control group was 57.7 ±9.26 years. The mean BMI of patients in the liraglutide group was 32.97 ±3.8, while that of the control group was 33.41 ±4. Table I shows a detailed summary of the baseline characteristics of the included studies along with the biochemical markers: ALT, AST, GGT, total cholesterol, triglyceride, HDL, LDL, and HbA1c.
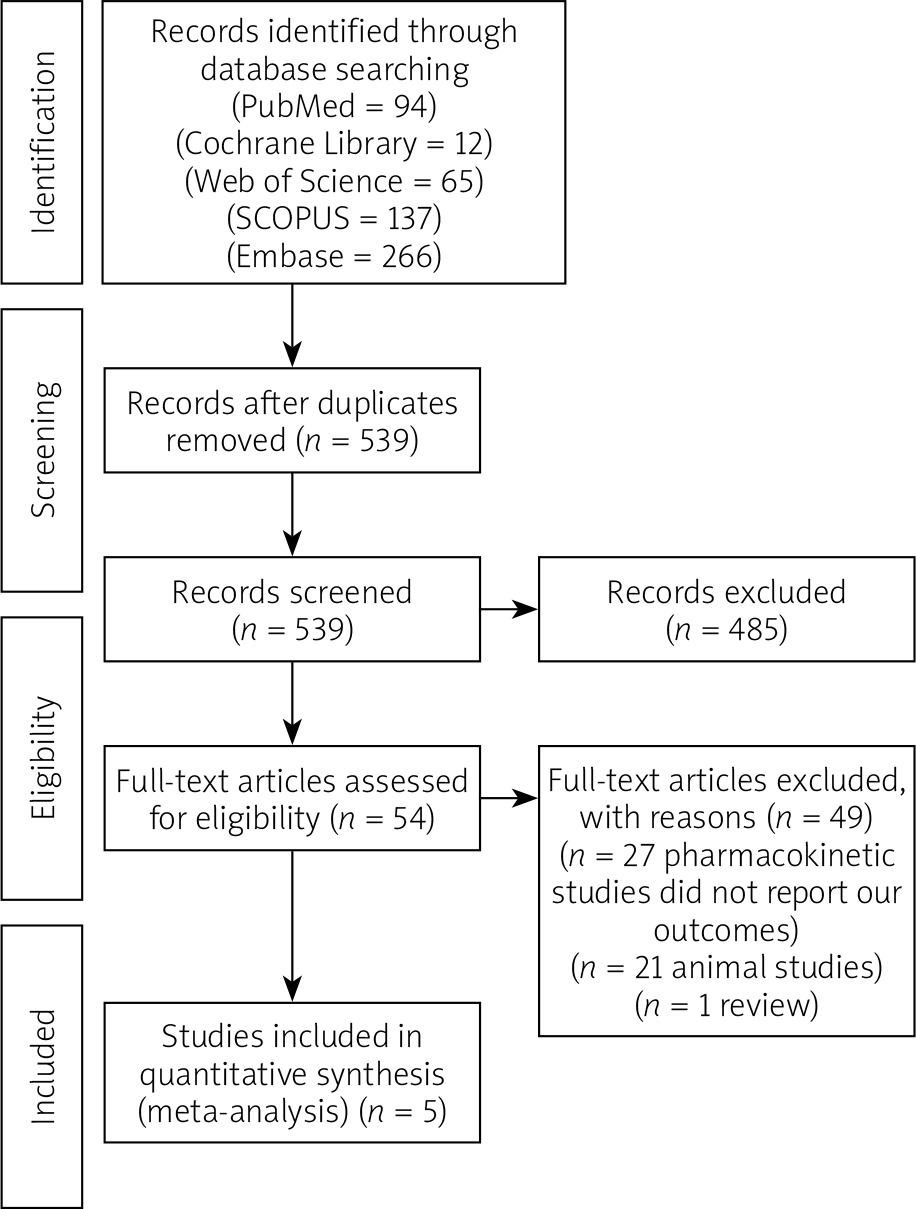
Table I
Summary of baseline characteristics of included studies
Bias assessment
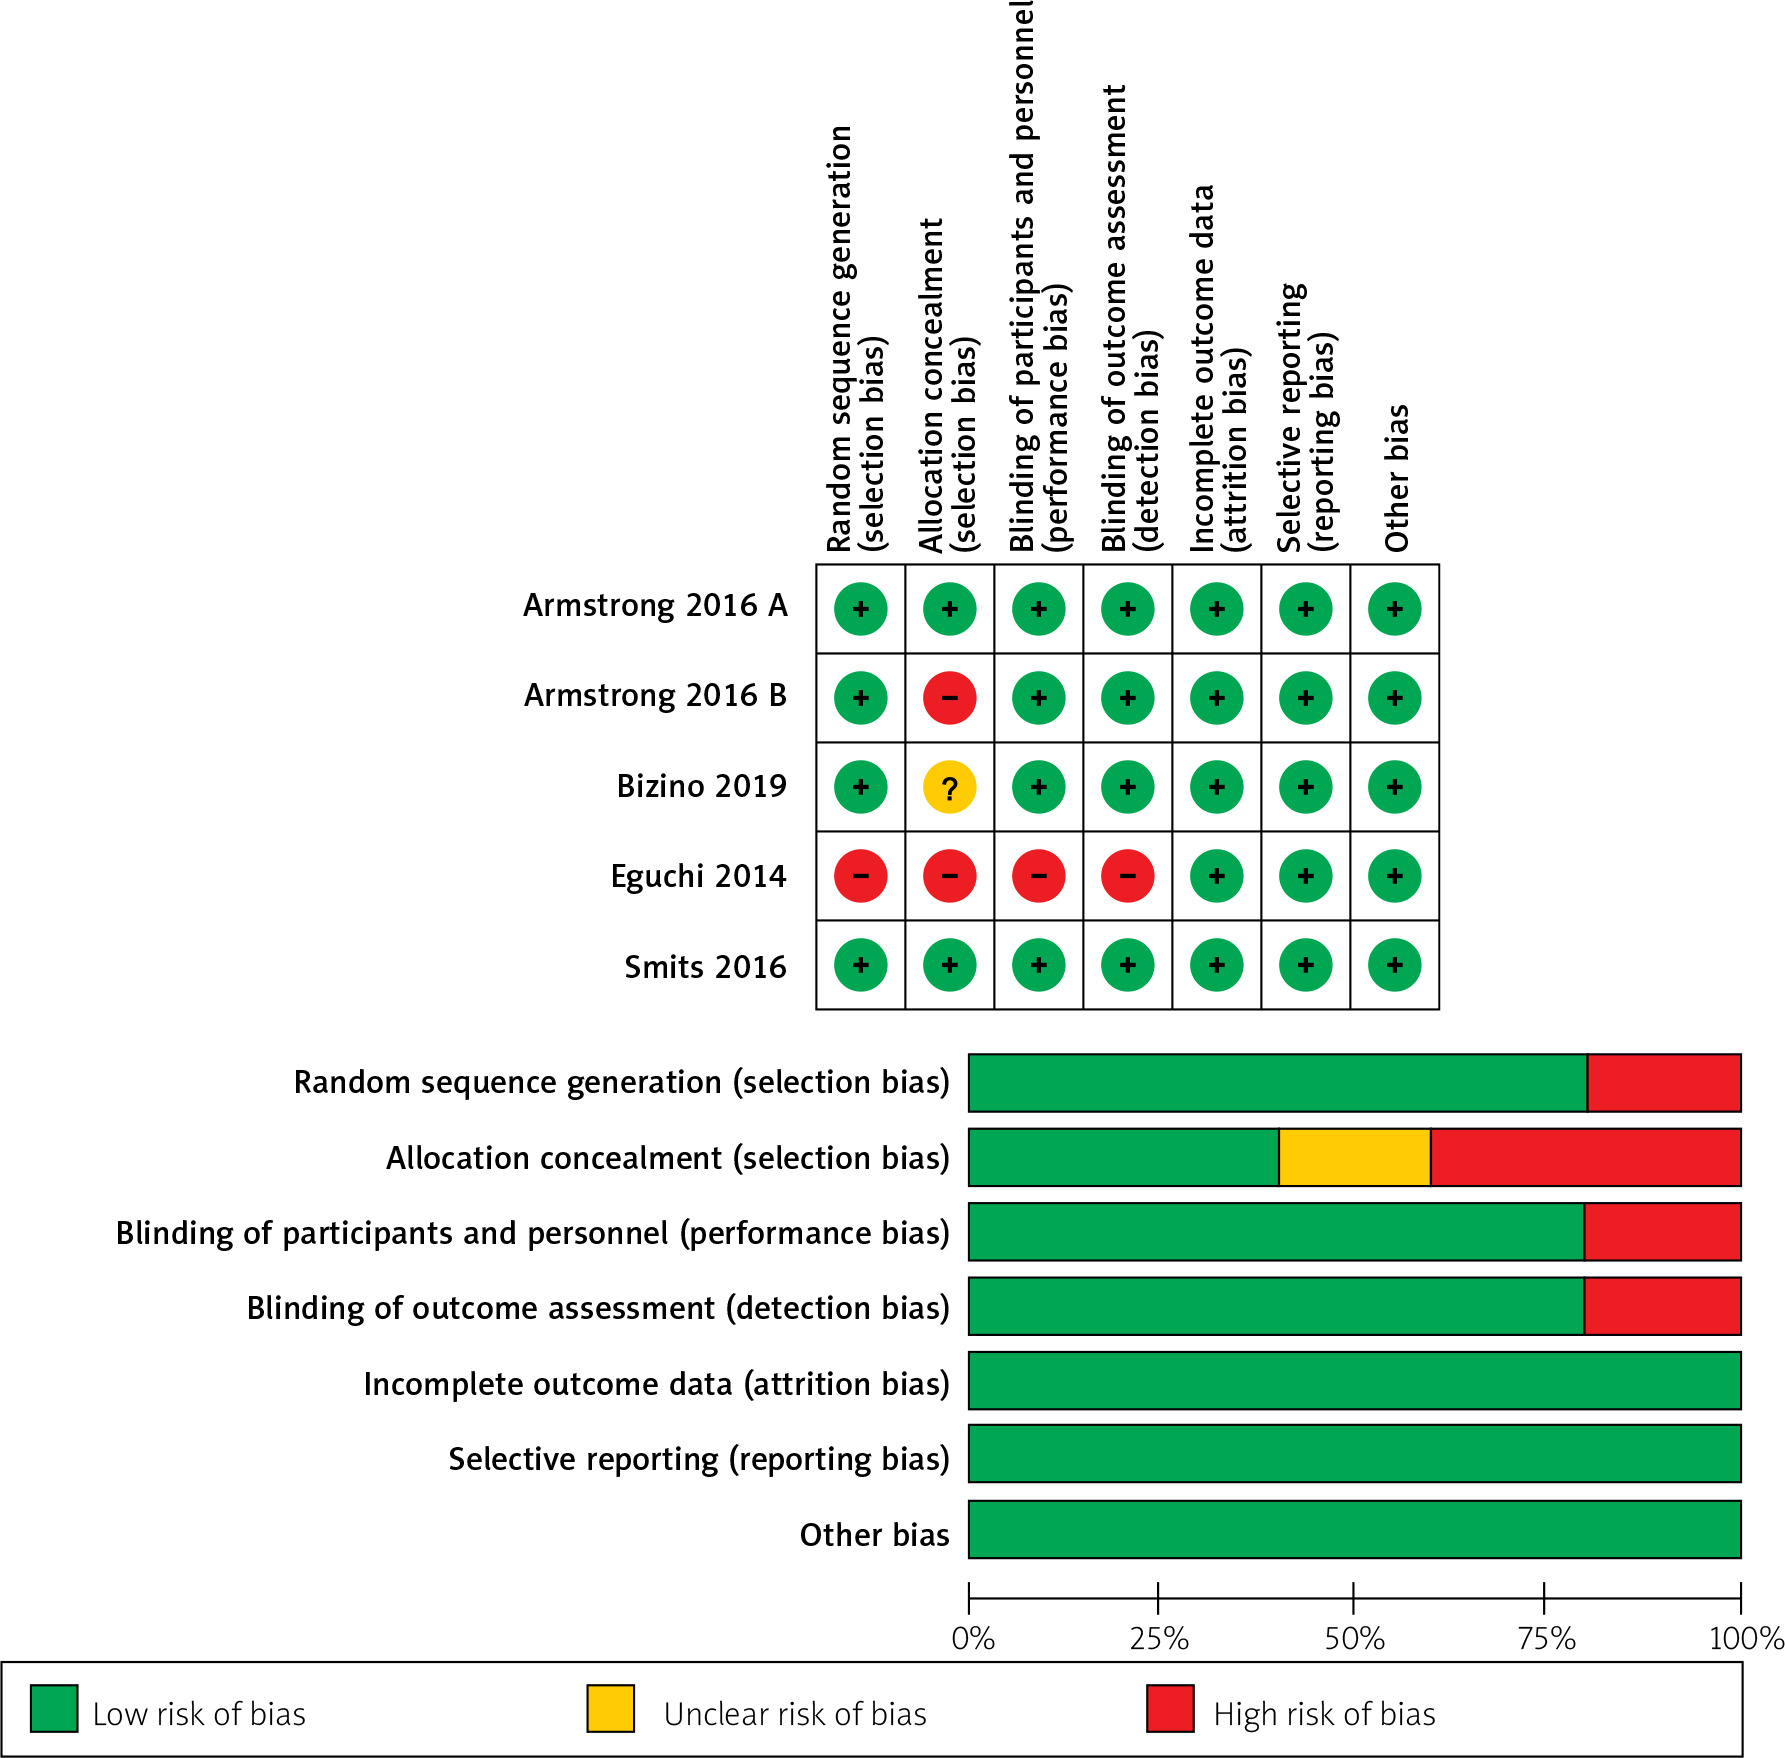
Cochrane’s bias assessment tool yielded an overall low risk of bias. All studies were at low risk of randomization, except Eguchi 2013 [12], which was marked as high risk of bias. For allocation concealment, 2 studies [13, 14] reported adequate allocation concealment; therefore, they were marked to have a low risk of bias. One study [15] did not report enough data about allocation concealment and was thus assigned an unclear risk of bias. Moreover, 2 studies [12, 16] reported inadequate allocation concealment. Most of the included studies were blinded. Only one study [12] did not report blindness of the participants and personnel, and it was therefore categorized as an “unclear” risk of bias. Four studies [13–16] were at low risk of blinding of outcome assessment. Eguchi 2013 [12] did not report blindness of outcome assessment, so it was categorized as a ‘’high” risk of bias. The remaining domains of the Cochrane tool were all at low risk of bias. A detailed illustration of the risk of bias of the included trials is summarized in Figure 2.
Outcomes
ALT (IU/l)
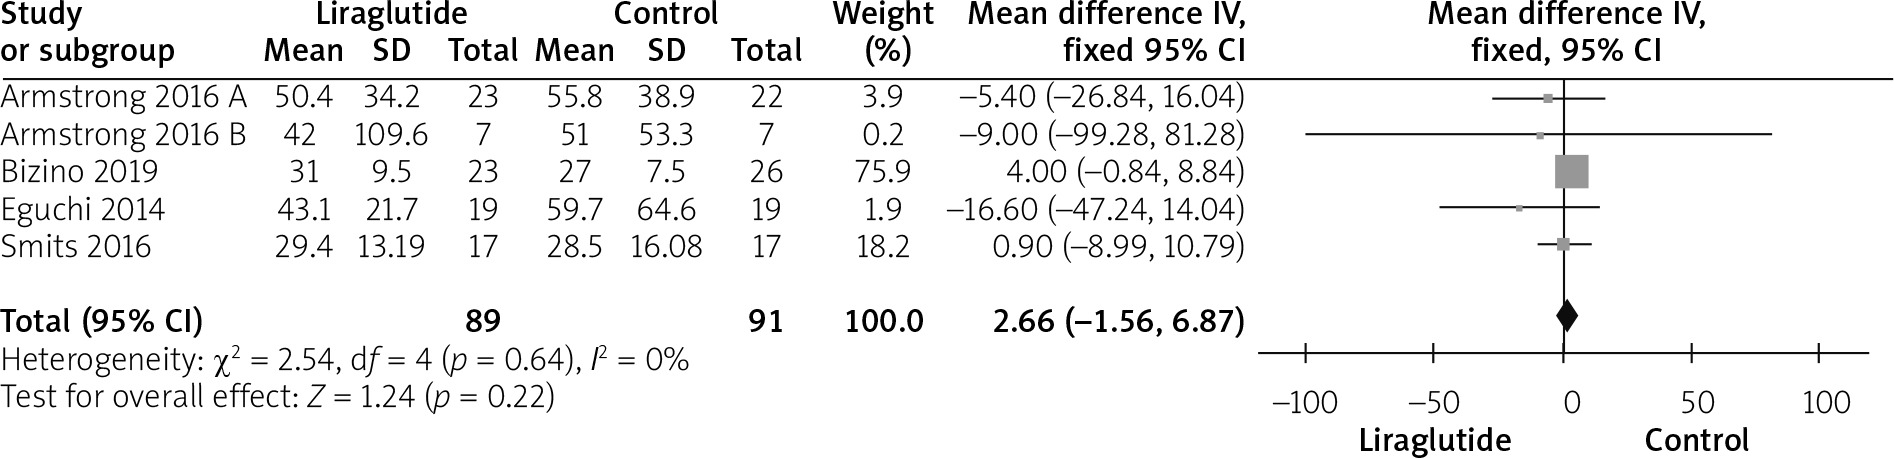
All studies [12–16] reported ALT outcomes. The overall mean difference showed no significant difference between both groups (MD = 2.66 (–1.56, 6.87), p = 0.22). Pooled analysis was homogeneous (p = 0.64; I2 = 0%), as shown in Figure 3.
AST (IU/l)
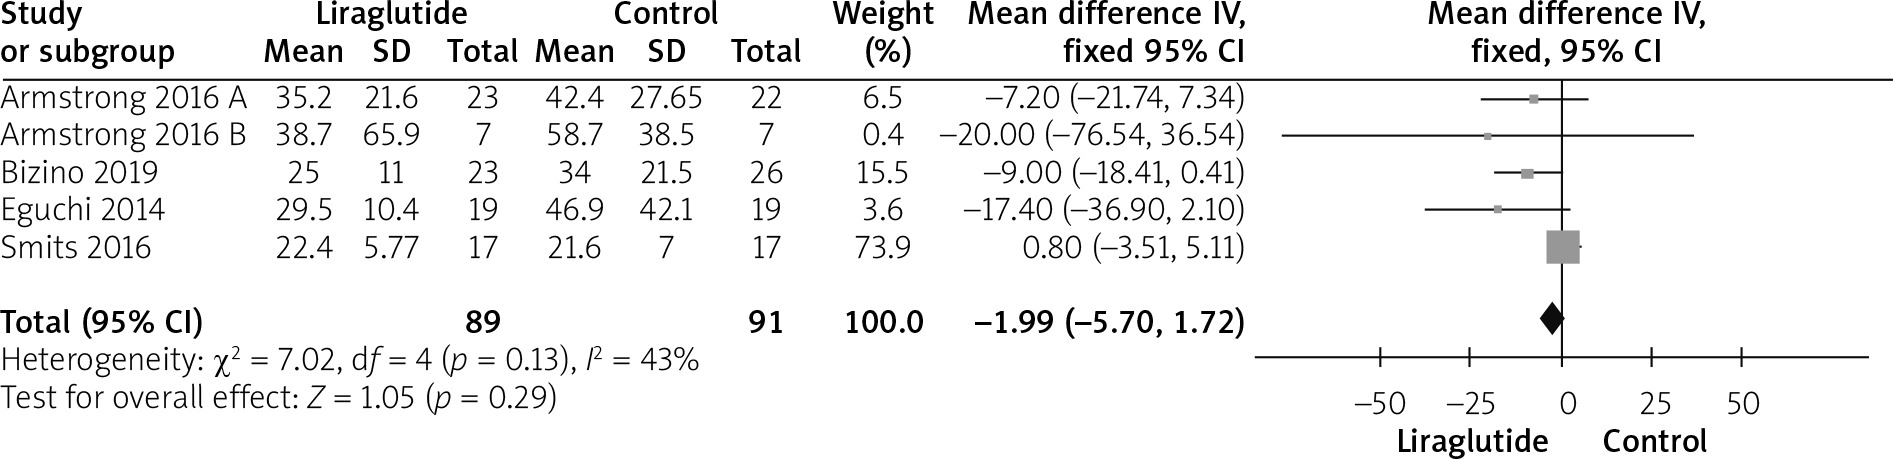
All studies [12–16] reported AST outcomes. The overall mean difference showed that there was no statistically significant variation between either group (MD = –1.99 (–5.70, 1.72)), p = 0.29). Data were homogeneous (p = 0.13; I2 = 43%), as shown in Figure 4.
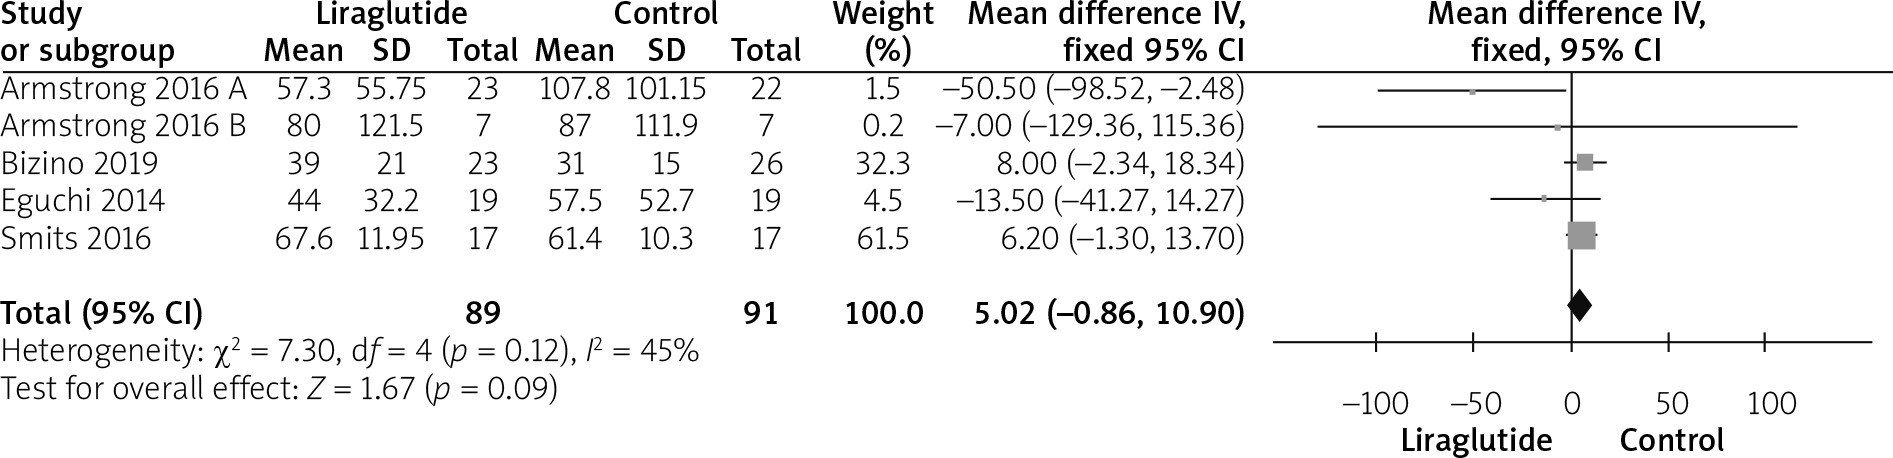
GGT (IU/l)
The GGT was reported by all studies [12–16]. The combined mean difference did not reveal a statistically significant difference between both groups (MD = 5.02 (–0.86, 10.90), p = 0.09). Pooled analysis was homogeneous (p = 0.12; I2 = 45%), as shown in Figure 5.
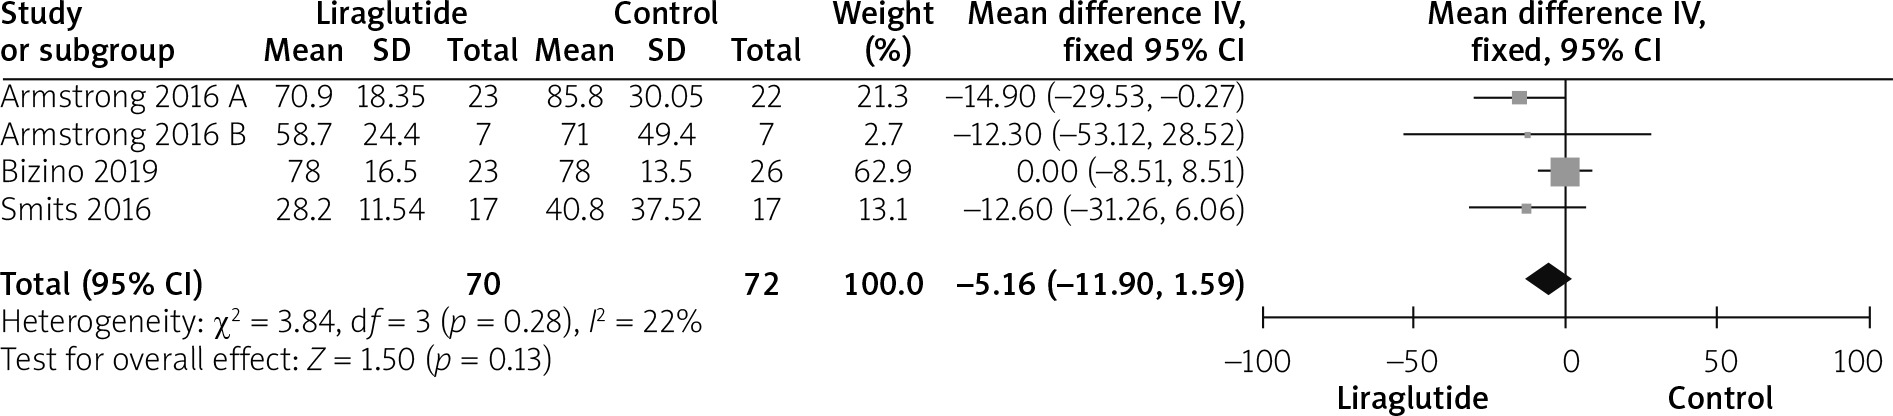
ALP (IU/l)
Four studies reported alkaline phosphatase outcomes [13–16]. The overall analysis did not show any statistically significant variation between both groups (MD = –5.16 (–11.90, 1.59), p = 0.13). Data were homogeneous (p = 0.28; I2 = 22%), as shown in Figure 6.
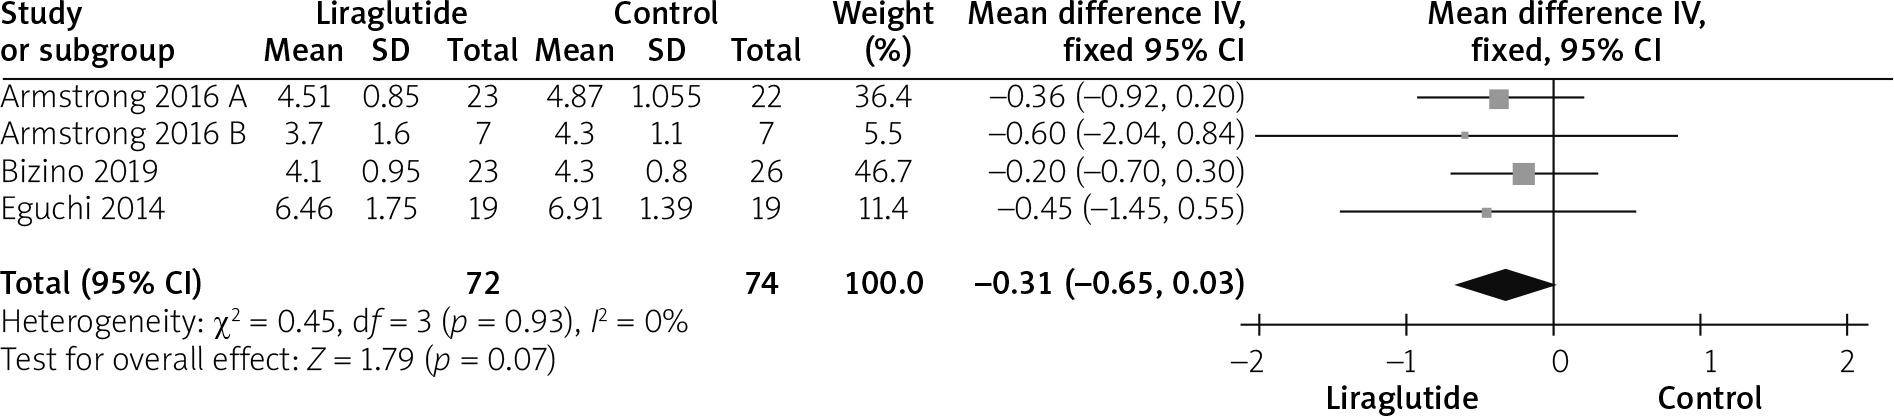
Total cholesterol (mmol/l)
Four studies [12, 14–16] reported the total cholesterol outcome. The overall mean difference showed no statistically significant difference between both groups (MD = –0.31 (–0.65, 0.03), p = 0.07). Pooled analysis was homogeneous (p = 0.93; I2 = 0%), as shown in Figure 7.
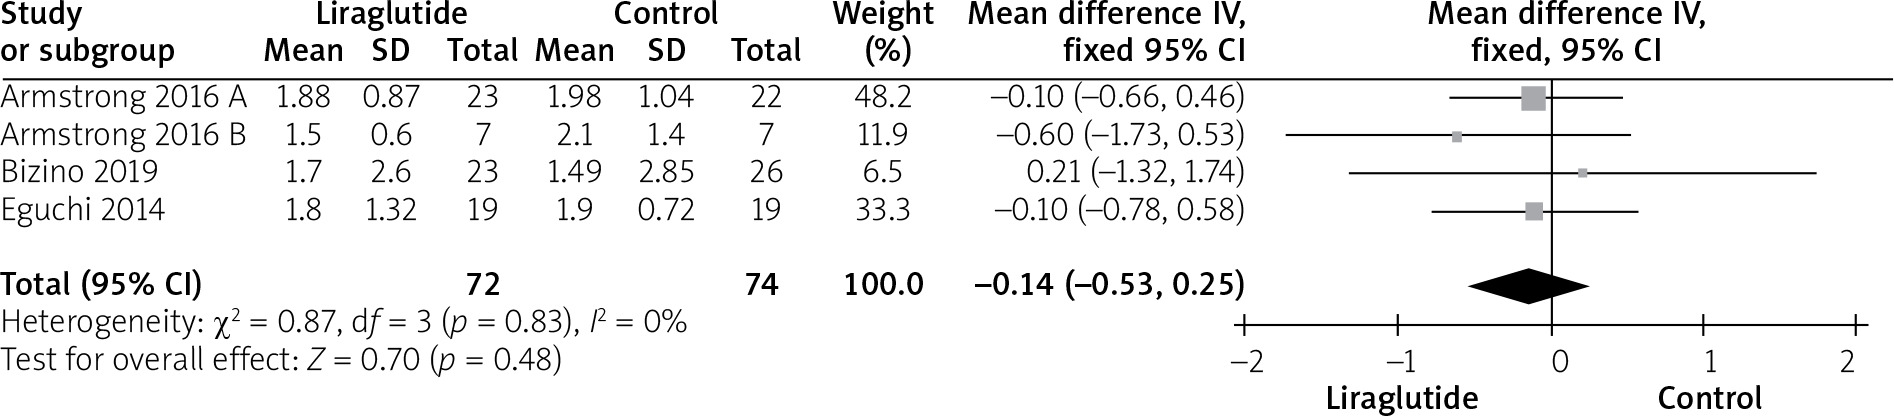
Triglyceride (mmol/l)
Four studies [12, 14–16] reported serum triglyceride levels. Pooled analysis showed no statistically significant difference between either group (MD = –0.14 (–0.53, 0.25), p = 0.48). Pooled analysis was homogeneous (p = 0.83; I2 = 0%), as shown in Figure 8.
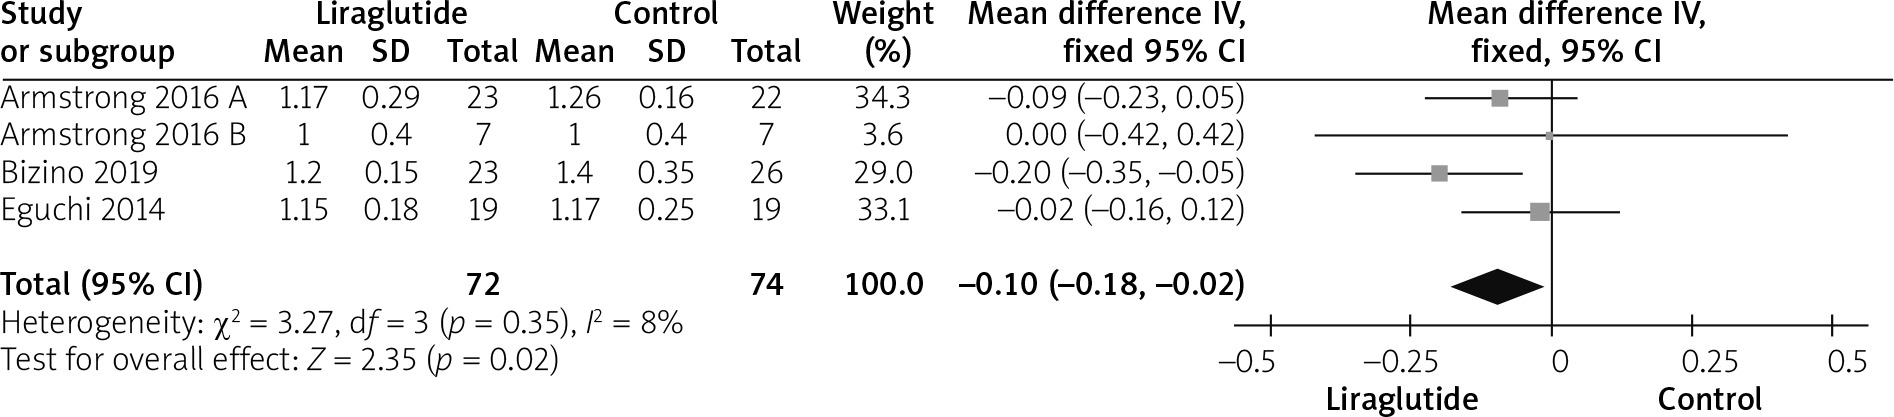
HDL (mmol/l)
Four studies [12, 14–16] reported HDL outcomes. The overall mean difference favoured the liraglutide group over the control group (MD = 0.10 (0.02, 0.18), p = 0.02). Data were homogeneous (p = 0.35; I2 = 8%), as shown in Figure 9.
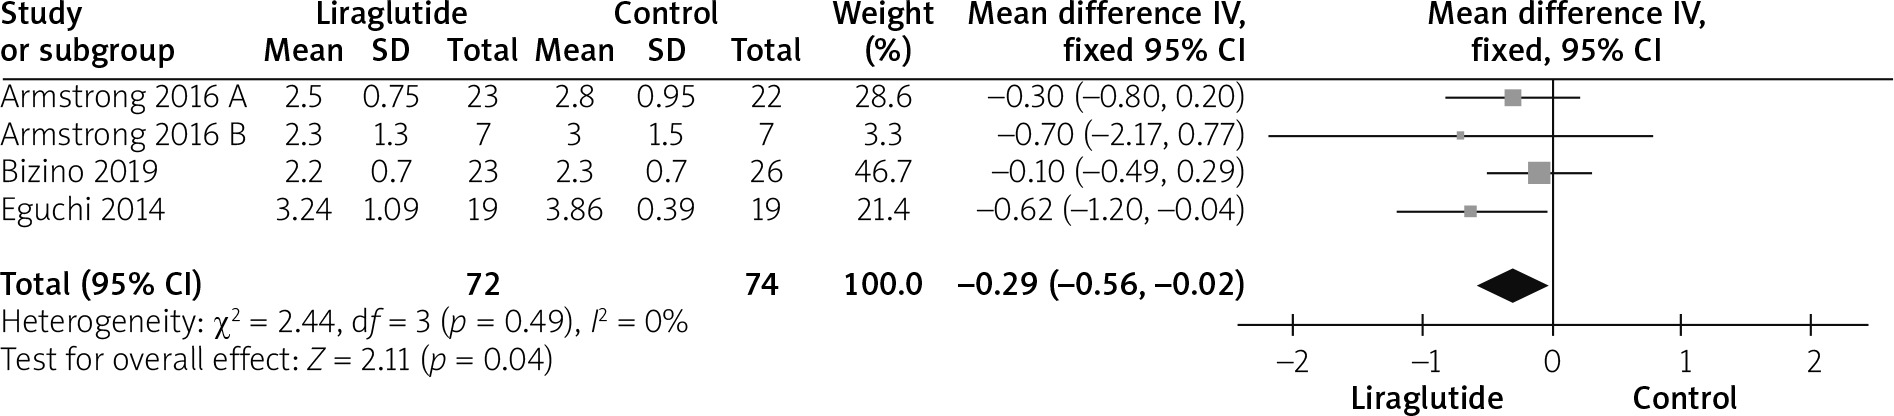
LDL (mmol/l)
Four studies [12, 14–16] reported the LDL outcomes. The liraglutide group showed statistically significant reduction in LDL (MD = –0.29 (–0.56, –0.02)), p = 0.04). Pooled analysis was homogeneous (p = 0.49; I2 = 0%), as shown in Figure 10.
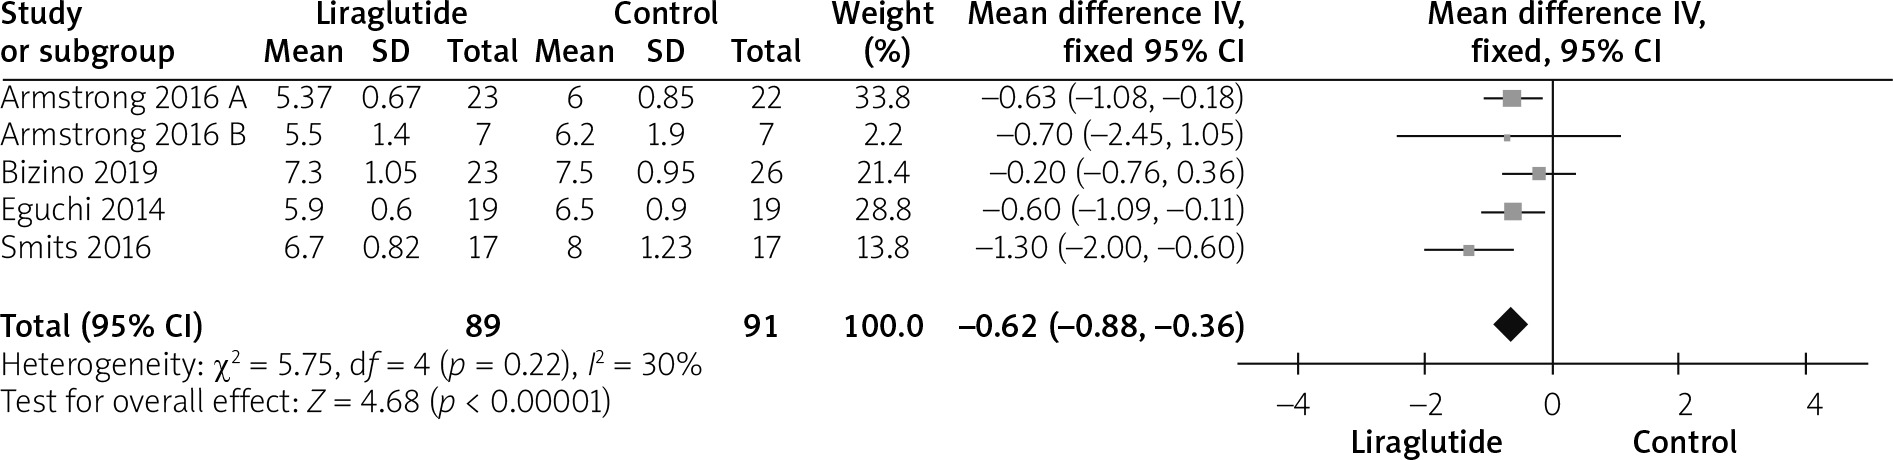
HbA1c (%)
The HbA1c were reported by all studies [12, 14–16]. The pooled analysis favoured the liraglutide group over the control group significantly (MD = –0.62 (–0.88, –0.36), p < 0.01). Pooled analysis was homogeneous (p = 0.22; I2 = 30%), as shown in Figure 11.
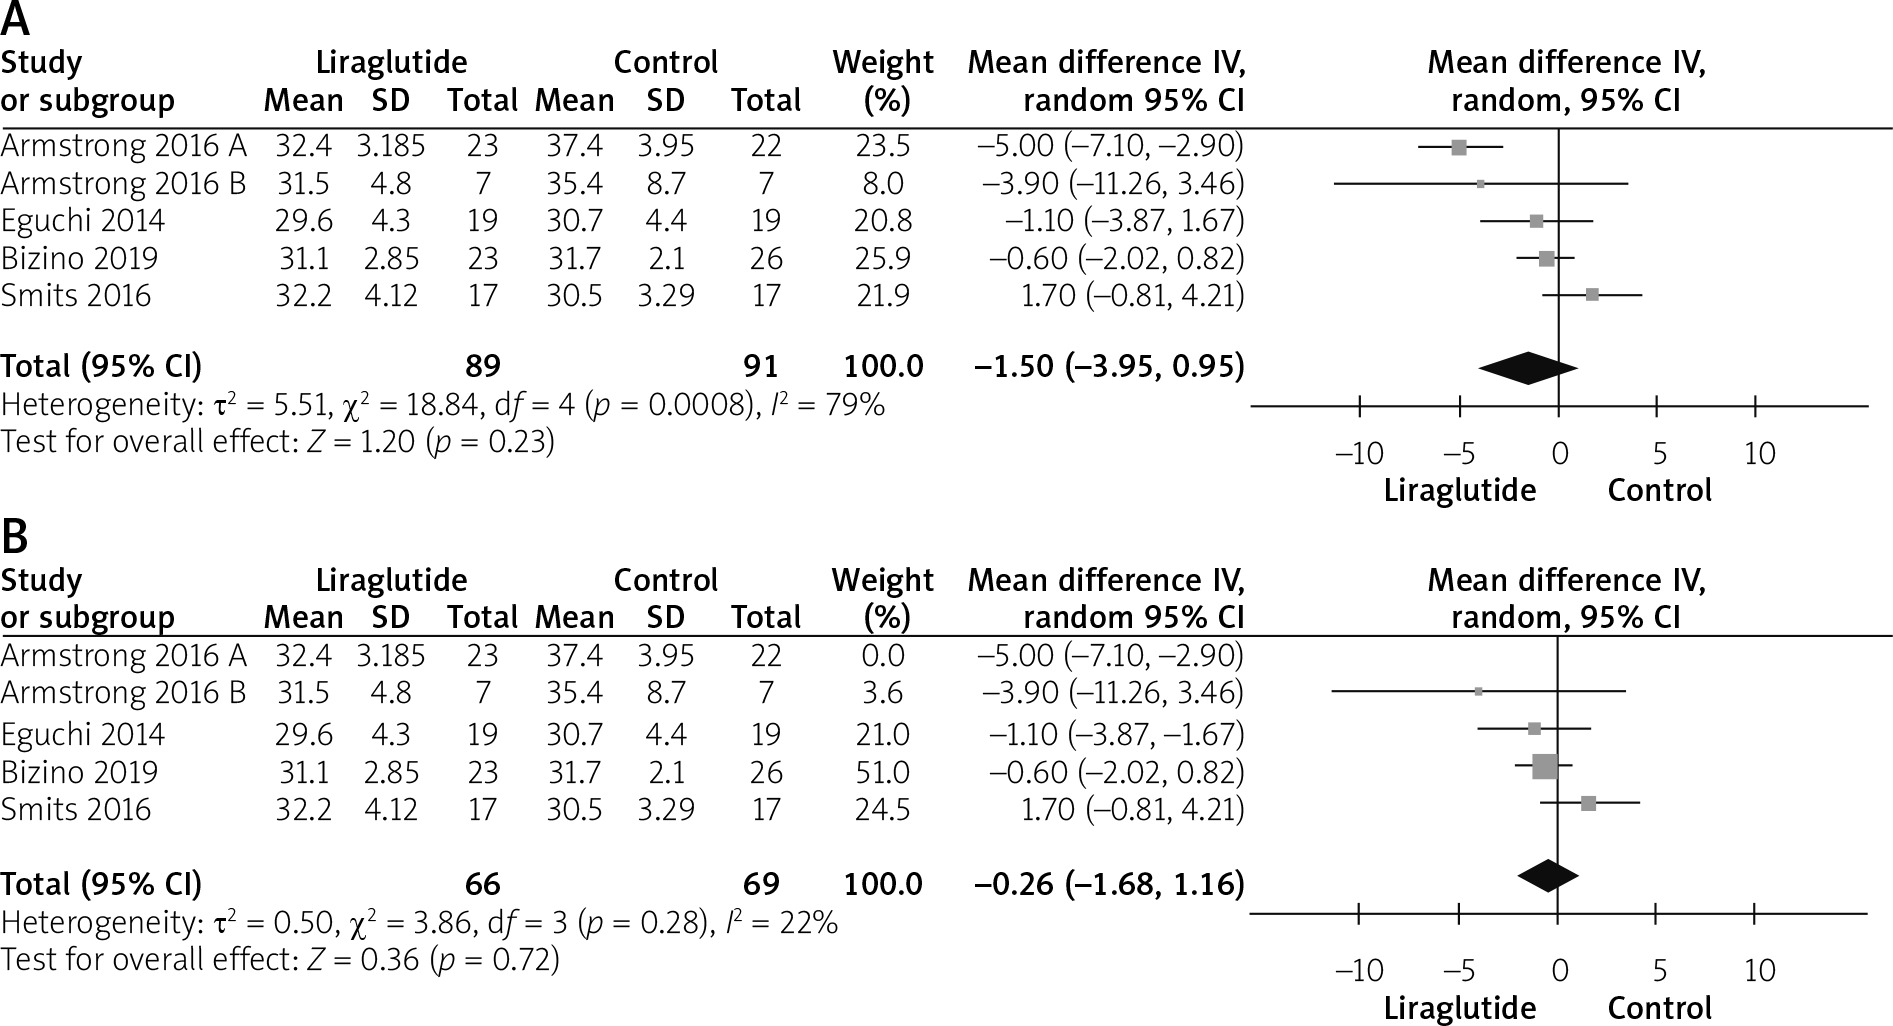
BMI (kg/m2)
BMIs were reported by all studies [12–16]. The overall mean difference did not reveal any statistically significant difference between both groups (MD = –1.50 (–3.95, 0.95), p = 0.23), as shown in Figure 12. Pooled analysis was heterogeneous (p = 0.08; I2 = 79%), as shown in Figure 12 A. We solved the heterogeneity by the exclusion of Armstrong 2016 A (2) (p = 0.28); I2 = 22%. However, the pooled analysis after exclusion still showed no statistically significant difference between either group (MD = –0.26 (–1.68, 1.16); p = 0.72). Figure 12 B illustrates the analysis after the exclusion of the study.
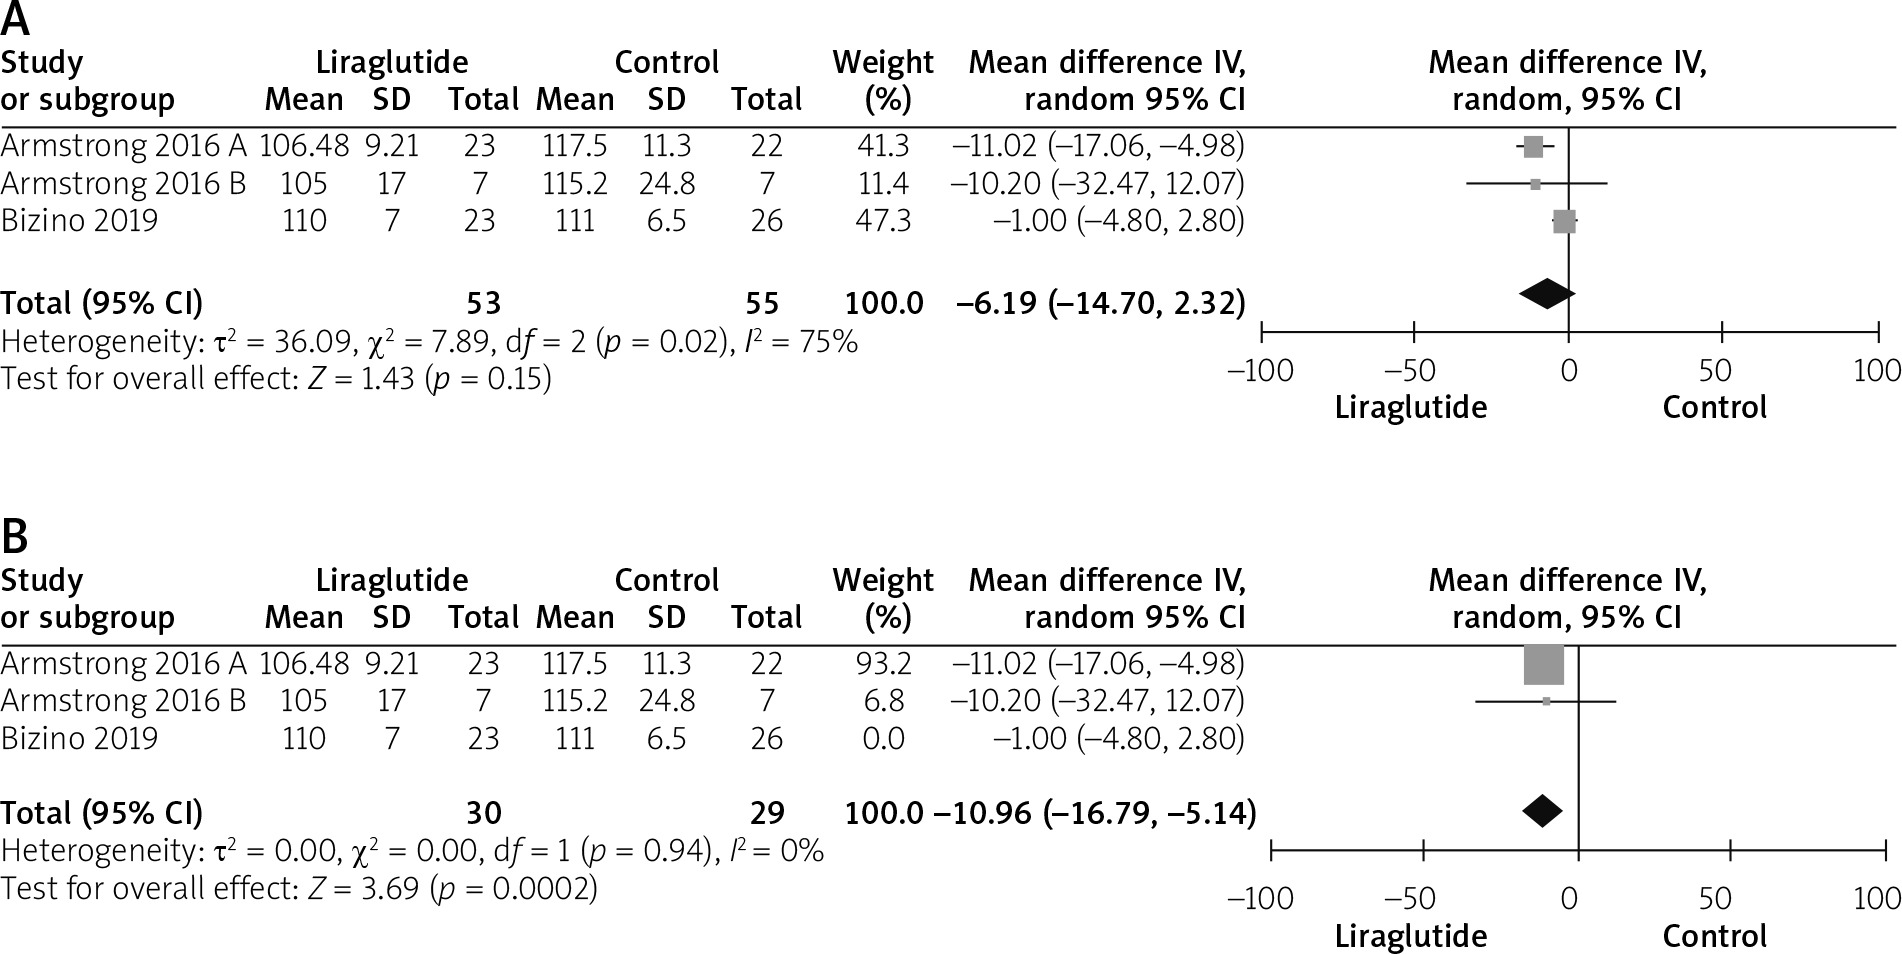
Waist circumference (cm)
Three studies reported the waist circumference measurements [14–16]. The combined mean difference did not reveal a statistically significant difference between both groups (MD = –6.19 (–14.70, 2.32); p = 0.15) as shown in Figure 13. Pooled data were heterogeneous (p = 0.02; I2 =75%), as shown in Figure 13 A. We solved the heterogeneity by exclusion of Bizini 2019 [15] (p = 0.94; I2 = 0%). The pooled analysis after the exclusion favoured the liraglutide group over the control group (MD = –10.96 (–16.79, –5.14) p = 0.02). Figure 13 B illustrates the analysis after the exclusion of the study.
Discussion
Our meta-analysis of the 5 RCTs shows that liraglutide is effective in improving the lipid profile in patients with NASH [12–16]. This is shown by the statistically significant decrease in LDL levels (MD = –0.29 (–0.56, –0.02); p = 0.04) and improvements in HDL levels (MD = 0.10 (0.02, 0.18); p = 0.02) in the blood. Liraglutide also showed a statistically significant reduction in HbA1c levels in patients, thus expressing its known antidiabetic effects. However, compared to placebo, liraglutide was not statistically significant in reducing liver enzymes, ALT, AST, GGT, or ALP. The analysis also showed a decrease in levels of total cholesterol and total triglycerides; however, it was not found to be statistically significant.
Our results are similar to studies published in the literature. Previously published trials have shown that liraglutide is not effective in improving levels of ALT, AST, GGT, and AP [12, 14–16]. Except for Armstrong et al. [16], who reported improvements in GGT and ALT levels. Total cholesterol and total triglyceride levels were not statistically significantly different between all included studies’ intervention and control arms [12–16]. Regarding HbA1c levels, 2 studies reported a non-significant difference [13, 15], while 3 studies showed that liraglutide reduces HbA1c levels significantly [12, 14, 16].
This study is an updated meta-analysis specifically performed to investigate the role of liraglutide in patients with NASH. However, liraglutide has been used in the management of many other systemic conditions and diseases. A meta-analysis by Armstrong et al. concluded that liraglutide 1.8 mg is safe, well-tolerated, and improves liver enzymes in patients with type 2 diabetes and elevated liver enzymes [17]. Another meta-analysis by Zhang et al. found liraglutide to be an effective and safe treatment for weight loss in obese, non-diabetic individuals [18]. Our results demonstrate that liraglutide reduces HbA1c significantly compared to placebo. However, the meta-analysis by Morieri et al. revealed that liraglutide has lower efficacy in lowering HbA1c than other glucagon-like peptide-1 receptor agonists, such as dulaglutide [19].
Liraglutide has also been shown to improve cardiac function in patients with heart failure [20]. Regarding safety endpoints, it decreases the risk of major adverse cardiovascular events and all-cause mortality [21]. Liraglutide is not related to the risk of acute pancreatitis or cancer [22]. Davidson et al. found that mild renal impairment had no effect on the efficacy and safety of liraglutide in their meta-analysis [23].
The main strength of this study is the inclusion of randomized clinical trials only and the exclusion of observational evidence. It is well-known that RCTs exhibit the highest level of evidence, according to the Cochrane Handbook. Another point is that all our analysis results were homogeneous, which demarcates the consistency of data and supports the interpretation of the analysis results. According to Cochrane’s risk of bias tool, we also assessed the risk of bias among the included studies and found it to be low. However, although we included all previously published clinical trials, the small number of included studies [5] remains a significant limitation. Another limitation is the small sample size (180 patients), which reduces our findings’ generalizability. Therefore, more clinical trials are still needed to investigate the efficacy of the drug. Additionally, the included studies did not report many data about liraglutide side effects, which further necessitates clinical trials providing a detailed safety profile.
Conclusions
Liraglutide appears to effectively improve lipid profile (HDL and LDL) in patients with NASH. However, its effect is not remarkable in reducing liver enzymes. While there is currently a paucity of data on liraglutide efficacy, further research may prove it to be a potential therapy for the prevention of NASH progression and/or disease reversal.