
Introduction
Obesity is a complex, multifactor disease in which energy consumption exceeds energy demand, leading to fat tissue growth [1, 2]. Overweight has been called the 21st-century pandemic. An increase in overweight and obesity is observed in the population of children and adolescents [1]. According to data from the World Health Organization (WHO), in 1990, in Poland, approximately 14.9% of people aged 5–19 years suffered from obesity. However, the 2016 WHO report showed that in the same age group, there was an increase of obesity diagnoses to 23.1%. Moreover, it is estimated that worldwide in 1990–2016, the number of people suffering from obesity has more than quadrupled, with 4.2% in 1990 and 18% in 2016. Childhood obesity is strongly associated with numerous short- and long-term negative health complications that may also persist into adulthood [3]. It can be the cause of diseases such as cardiovascular disease, high blood pressure, asthma, hypercholesterolaemia, type 2 diabetes, as well as social and emotional disorders (depression, discrimination) that reduce the quality of life [4].
One of the many problems associated with childhood and adolescent obesity is the selection of the most reliable diagnostic method. Among the most commonly used indicators, we can distinguish body mass index (BMI), fat mass index (FMI), waist to hip ratio (WHR), and waist to height ratio (WtHR).
BMI is the most commonly used and well-accepted indicator, covering the relationship of body weight to body length. In the paediatric population, BMI is valued for allowing a comparison of children of the same sex and age [5, 6]. The widespread use of this ratio has allowed an abundant collection of investigations and percentile ranks for children and adolescents, appropriate for the socio-demographic characteristic of the population. However, BMI is widely considered insufficient to assess obesity in children and adolescents, because it does not provide information about the percentage of body fat; nor does it disclose information about the distribution of fat in different places of the body. In some populations, such as athletes and bodybuilders, increased muscle mass may falsely increase the BMI, and increased BMI is not directly related to their state of health [7].
FMI is an indicator that is gained by bioelectrical impedance analysis (BIA) [5]. Among the advantages of evaluating body composition by bioelectrical impedance is its simplicity, high accuracy, recurrence, and low cost of use. What is more, a significant correlation has been demonstrated between the evaluation of body fat mass by this method and dual-energy X-ray absorptiometry (DXA), which is used in estimating the percentage of body fat (BF%) [8]. FMI is normalized, and hence it allows the assessment of the body composition of people of different height [9]. FMI seems to be an important marker for assessing the link between obesity and cardiovascular risks as well as metabolic syndrome in young adults [10].
WHR is the ratio of the waist circumference (cm) to the hip circumference (cm), widely used in the diagnosis of abdominal obesity. WHR is considered a better indicator of cardiovascular disease risk than BMI [11]. The WHO determined gender-specific cut-off points (for men ≥ 0.90, for women ≥ 0.85), exceeding which means a significantly increased risk of metabolic complications [12]. It is worth noting that WHR varies depending on age, sex, and ethnic group [12].
WtHR is the waist to height ratio, which is calculated by dividing the waist circumference (cm) by the height (m) of the patient. It is an indicator of abdominal obesity, an indicator of cardiovascular disease risk [13, 14], and a strong marker of diabetes type II risk [15]. The cut-off value for WtHR is gender-independent and is 0.5 [13].
Aim of the study
The aim of the study was to compare the methods of assessing obesity in children and adolescents using the following indicators: BMI, WHR, WtHR, and FMI and to determine the consistency of the results obtained with them.
Material and methods
The cross-sectional study involved 195 children aged 11–18 years (mean age 14.04 ±1.67 years), attending primary and secondary schools in Kudowa Zdrój, a small Polish town with a population of around 10,000. The age distribution of the examined group is shown in Table I.
Table I
Age distribution of the examined group
| Age of participants (years) | n |
|---|---|
| 11 | 26 |
| 12 | 27 |
| 13 | 46 |
| 14 | 40 |
| 15 | 38 |
| 16 | 6 |
| 17 | 9 |
| 18 | 3 |
A legal guardian of each juvenile signed an informed consent form. Each child was asked for consent immediately before the examination. The study was conducted as part of “Healthy Child” project and was approved by the Bioethics Committee of Wroclaw Medical University. The characteristics of the study population are shown in Table II.
Table II
Characteristics of the examination group
| Parameter | Value |
|---|---|
| Number of patients | 195 |
| Age (years) | 10–18 |
| Mean age (years) | 14.04 ±1.67 |
| Gender (%) | |
| Male | 110 (56.41%) |
| Female | 85 (43.59%) |
| Maternal education (%) | |
| Secondary school | 41 (21.03%) |
| Primary School | 154 (78.97%) |
Anthropometric measures included height, body weight, body fat percentage, fat mass, waist circumference, and hip circumference. BMI, FMI, WHR, and WtHR were calculated based on the collected data.
Height was measured from the floor to the vertex in metres. The patient stood barefoot with their toes and knees touching and their back straight. The heels, buttocks, end, and occipital region were in contact with the surface of the anthropometer. Body weight was measured in kilograms using an Omron body composition analyser (model BF-511).
BMI was obtained by dividing the weight in kilograms by the square of the height in metres (kg/m2) (Formula 1).
Body fat percentage was measured using an Omron body composition analyser (model BF-511), using the bioimpedance method. The patient stood barefoot on the base of the device, knees and back straight, and looking straight ahead during the examination. By raising the handle of the device, the patient had their arms increased horizontally and their elbows straight. Their arms were extended straight perpendicular to their body, with their palms pressed firmly on the grip electrodes. Fat mass, a parameter needed for calculating FMI, was estimated in kilograms by body fat percentage multiplied by body weight.
FMI was calculated by dividing the fat mass in kilograms by the square of the height in metres (Formula 2).
Waist circumference was taken with the subject standing at the end of a normal exhalation. The point of measurement was the narrowest circumference between the last rib and the iliac crest or, failing this point, at the midline. The result was noted in centimetres. Hip circumference was taken with the subject standing at the end of a normal exhalation. The point of measurement was the maximum circumference at the level of the buttocks, corresponding to the symphysis pubis.
WHR was estimated as the ratio between waist circumference and hip circumference (Formula 3).
WtHR was obtained by dividing waist circumference by height (Formula 4).
Using percentile ranks, appropriate for sex and age, BMI, FMI, WHR, and WTHR were described in Standard Deviation Scores (SDS) to compile results of children of different ages and sex (formula 5).
In this research, obesity was diagnosed when SDS was above +2 for a particular group of age and sex for BMI, FMI, WHR, and WtHR.
Statistical analysis: Statistica software was used (version 13.3®). Systematics and proportionality were identified by Passing-Bablok analysis. The Bland-Altman plots were presented as relative difference plots. The mean difference allow us to compare different methods to BMI SDS. The closer to “0”, the more similar that method is to BMI SDS, which was chosen as the reference method. The significance of the Bland-Altman plot was approved when at least 95% of the measurements were within the 95% compliance range. Assessment of the method compliance was also performed using a mountain plot, which compares medians of methods; what is more, the shape of mountain plot indicates the similarity of 2 methods – the narrower the shape, the more similar the methods. The statistical significance level was established at p < 0.05.
Results
All the diagnostic indicators: BMI SDS, FMI SDS, WHR SDS, and WtHR SDS, displayed different percentages of obesity presence in the group of 195 juveniles. The obtained values were 23.08%, 15.90%, 28.71%, and 20.00%, respectively.
Using BMI SDS as the reference method, statistical investigation was applied. Significant correlations were found between the following: BMI SDS and WtHR SDS; BMI SDS and FMI SDS. Only WHR SDS was not correlated with BMI SDS (Table III). Additionally, no correlation with age was found.
Table III
Determined statistical parameters between obesity assessment methods
The mean difference between BMI SDS and WHR SDS measurements (-0.077) was near statistical significance; 94.82% of the patients (n = 183) were within the compliance range (Fig. 1A).
Figure 1
Comparison of BMI SDS and WHR SDS methods: A – Bland-Altman plot, B – mountain plot, C – Passing-Bablok regression BMI SDS – body mass index standard deviation score WHR SDS – waist to hip ratio standard deviation score
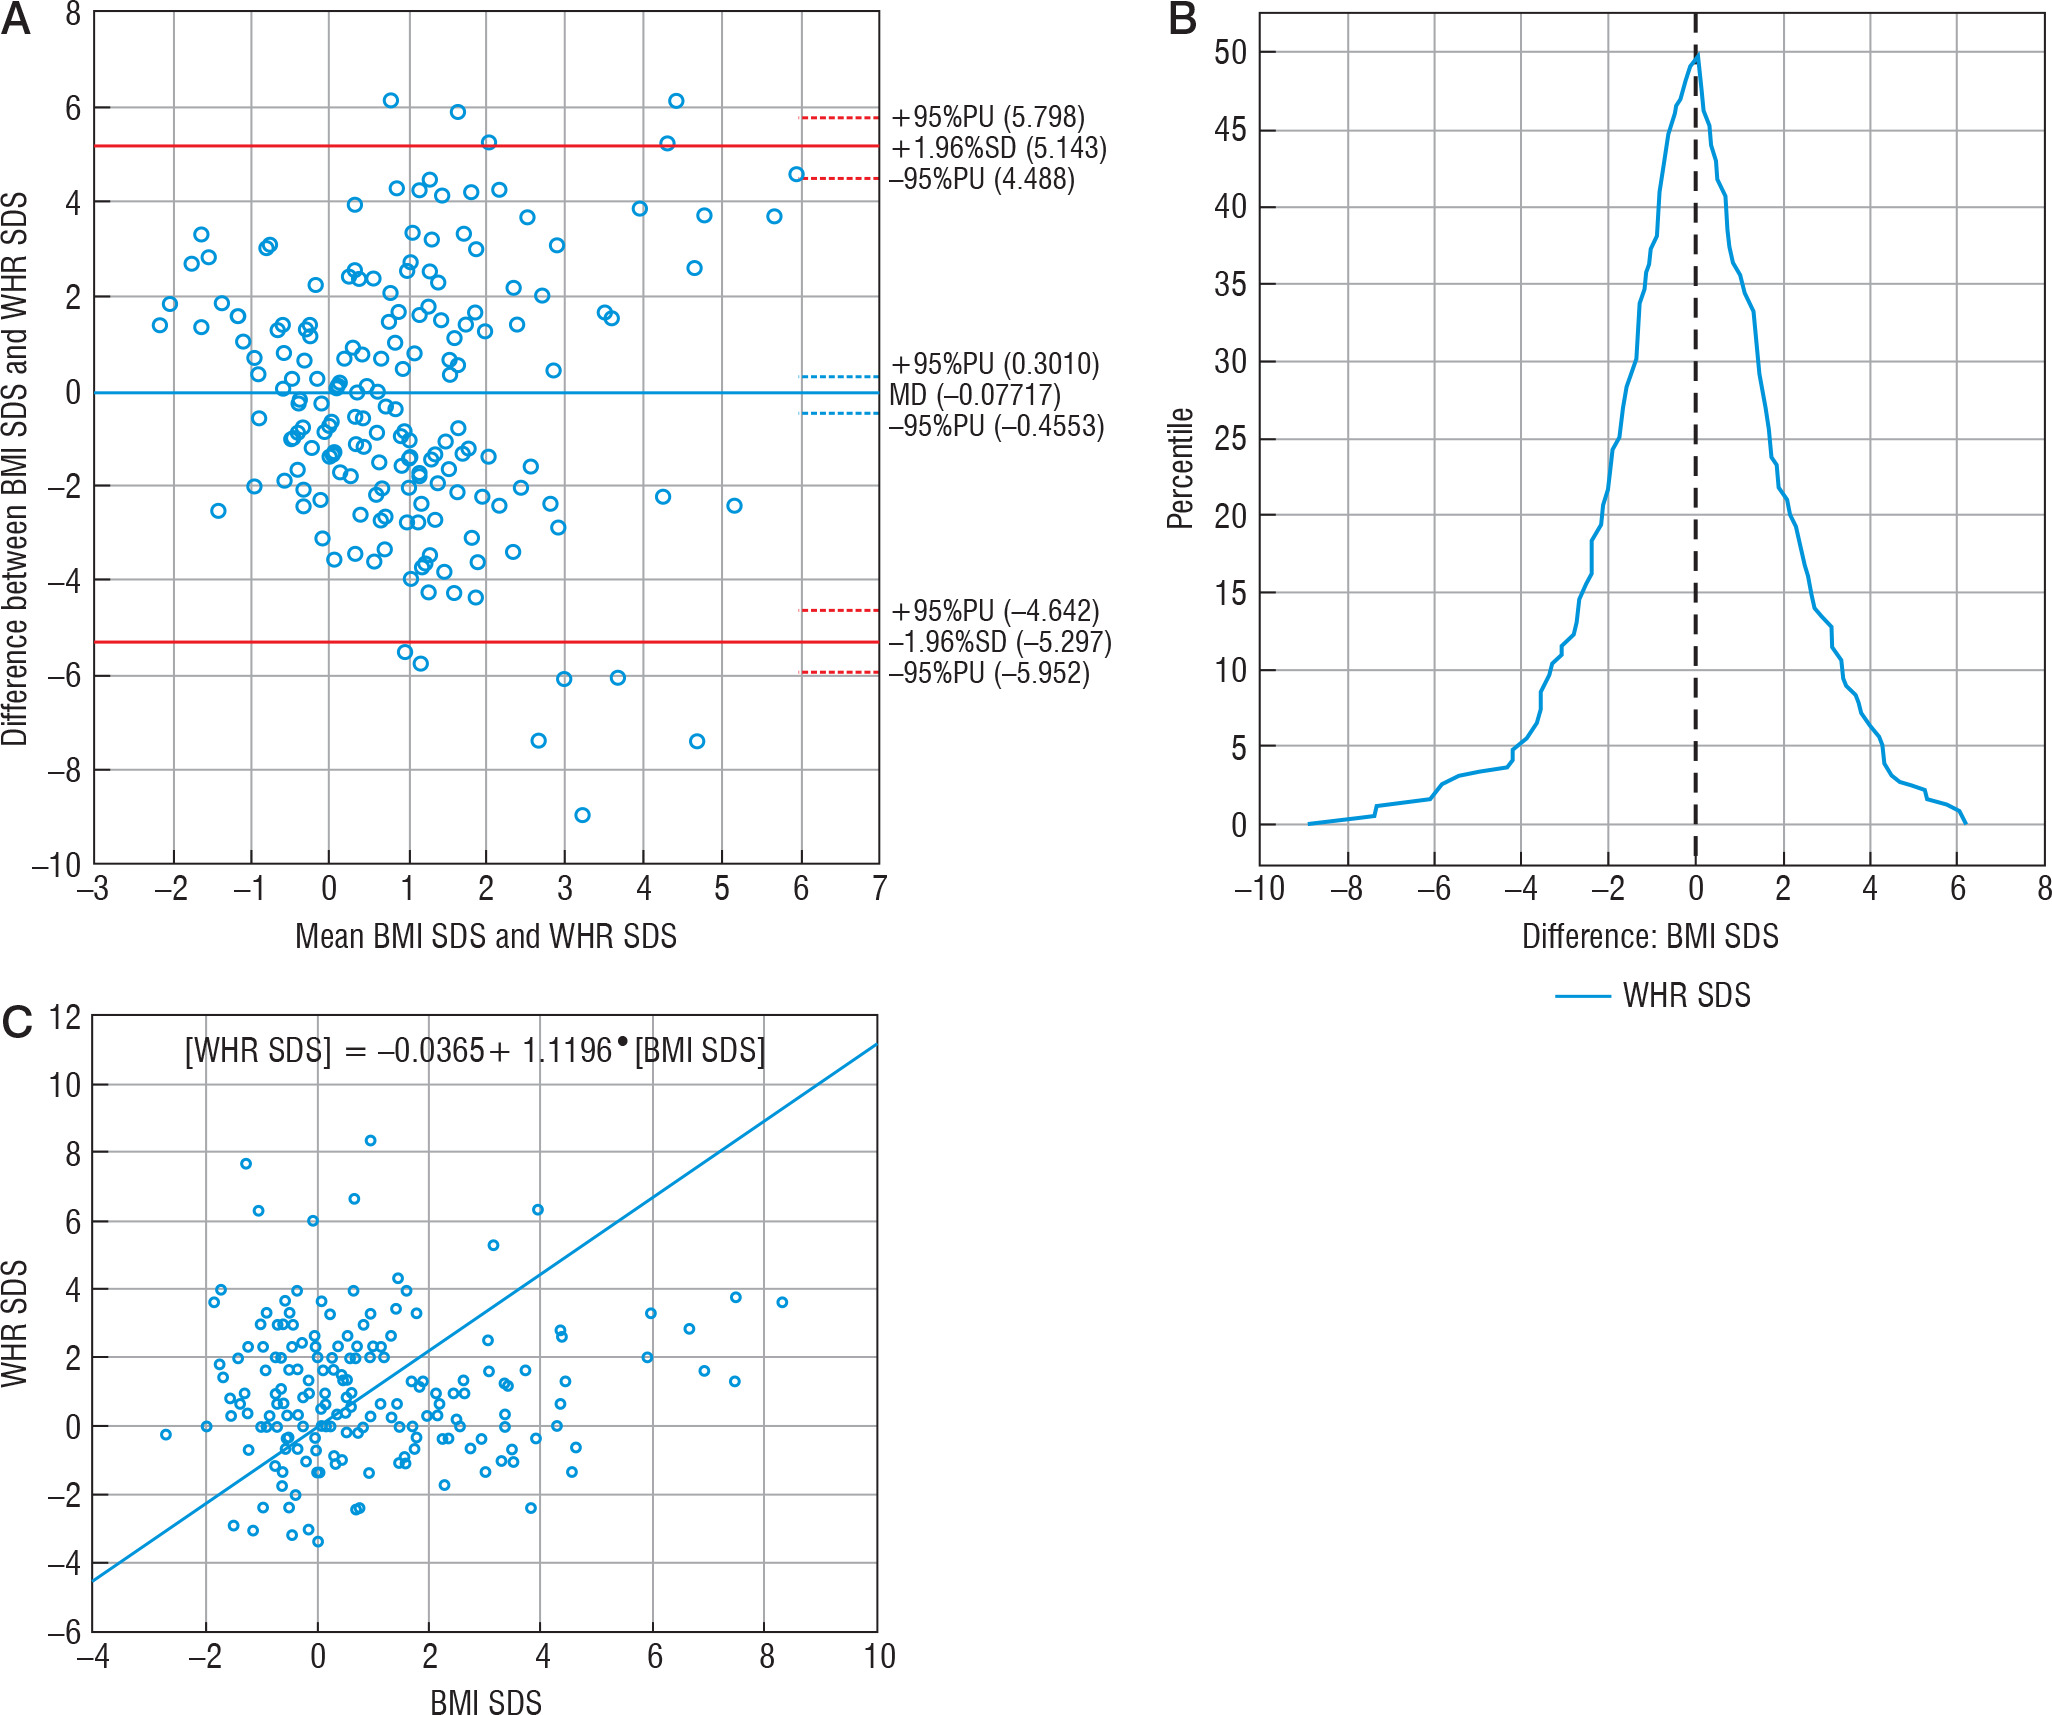
The range of compliance was 10.44. The Passing-Bablok regression showed the linearity of BMI SDS and WHR SDS indicators, with no proportional differences. However, it confirmed systematic differences between BMI SDS and WHR SDS (Fig. 1B), which means a constant error exists between these 2 methods, and they are not comparable. Mountain plot indicated the peak coverage of the plot with zero points (Fig. 1C), which implied that the medians of these methods were equal. Nonetheless, the long tails of the plot (reaching from –9 SDS to 6 SDS) showed that the variety of measurements might affect the diagnosis. The 41.5% (n = 81) of WHR SDS measurements showed different obesity diagnosis than BMI SDS (Table IV). Despite the small mean difference, these methods tend to show opposing diagnoses. WHR SDS showed 56 obesity diagnosis, but 46 of them were found not to be obese by both BMI SDS and FMI SDS. WHR SDS estimated 28.71% of children to be obese, almost twice as much as FMI SDS (15.90%). According to FMI SDS, the sensitivity and specificity of WHR SDS were 25.71% and 70.73%, respectively. There was no correlation between BMI SDS and WHR SDS.
Table IV
Comparison of the consistency of the results of individual obesity assessment methods
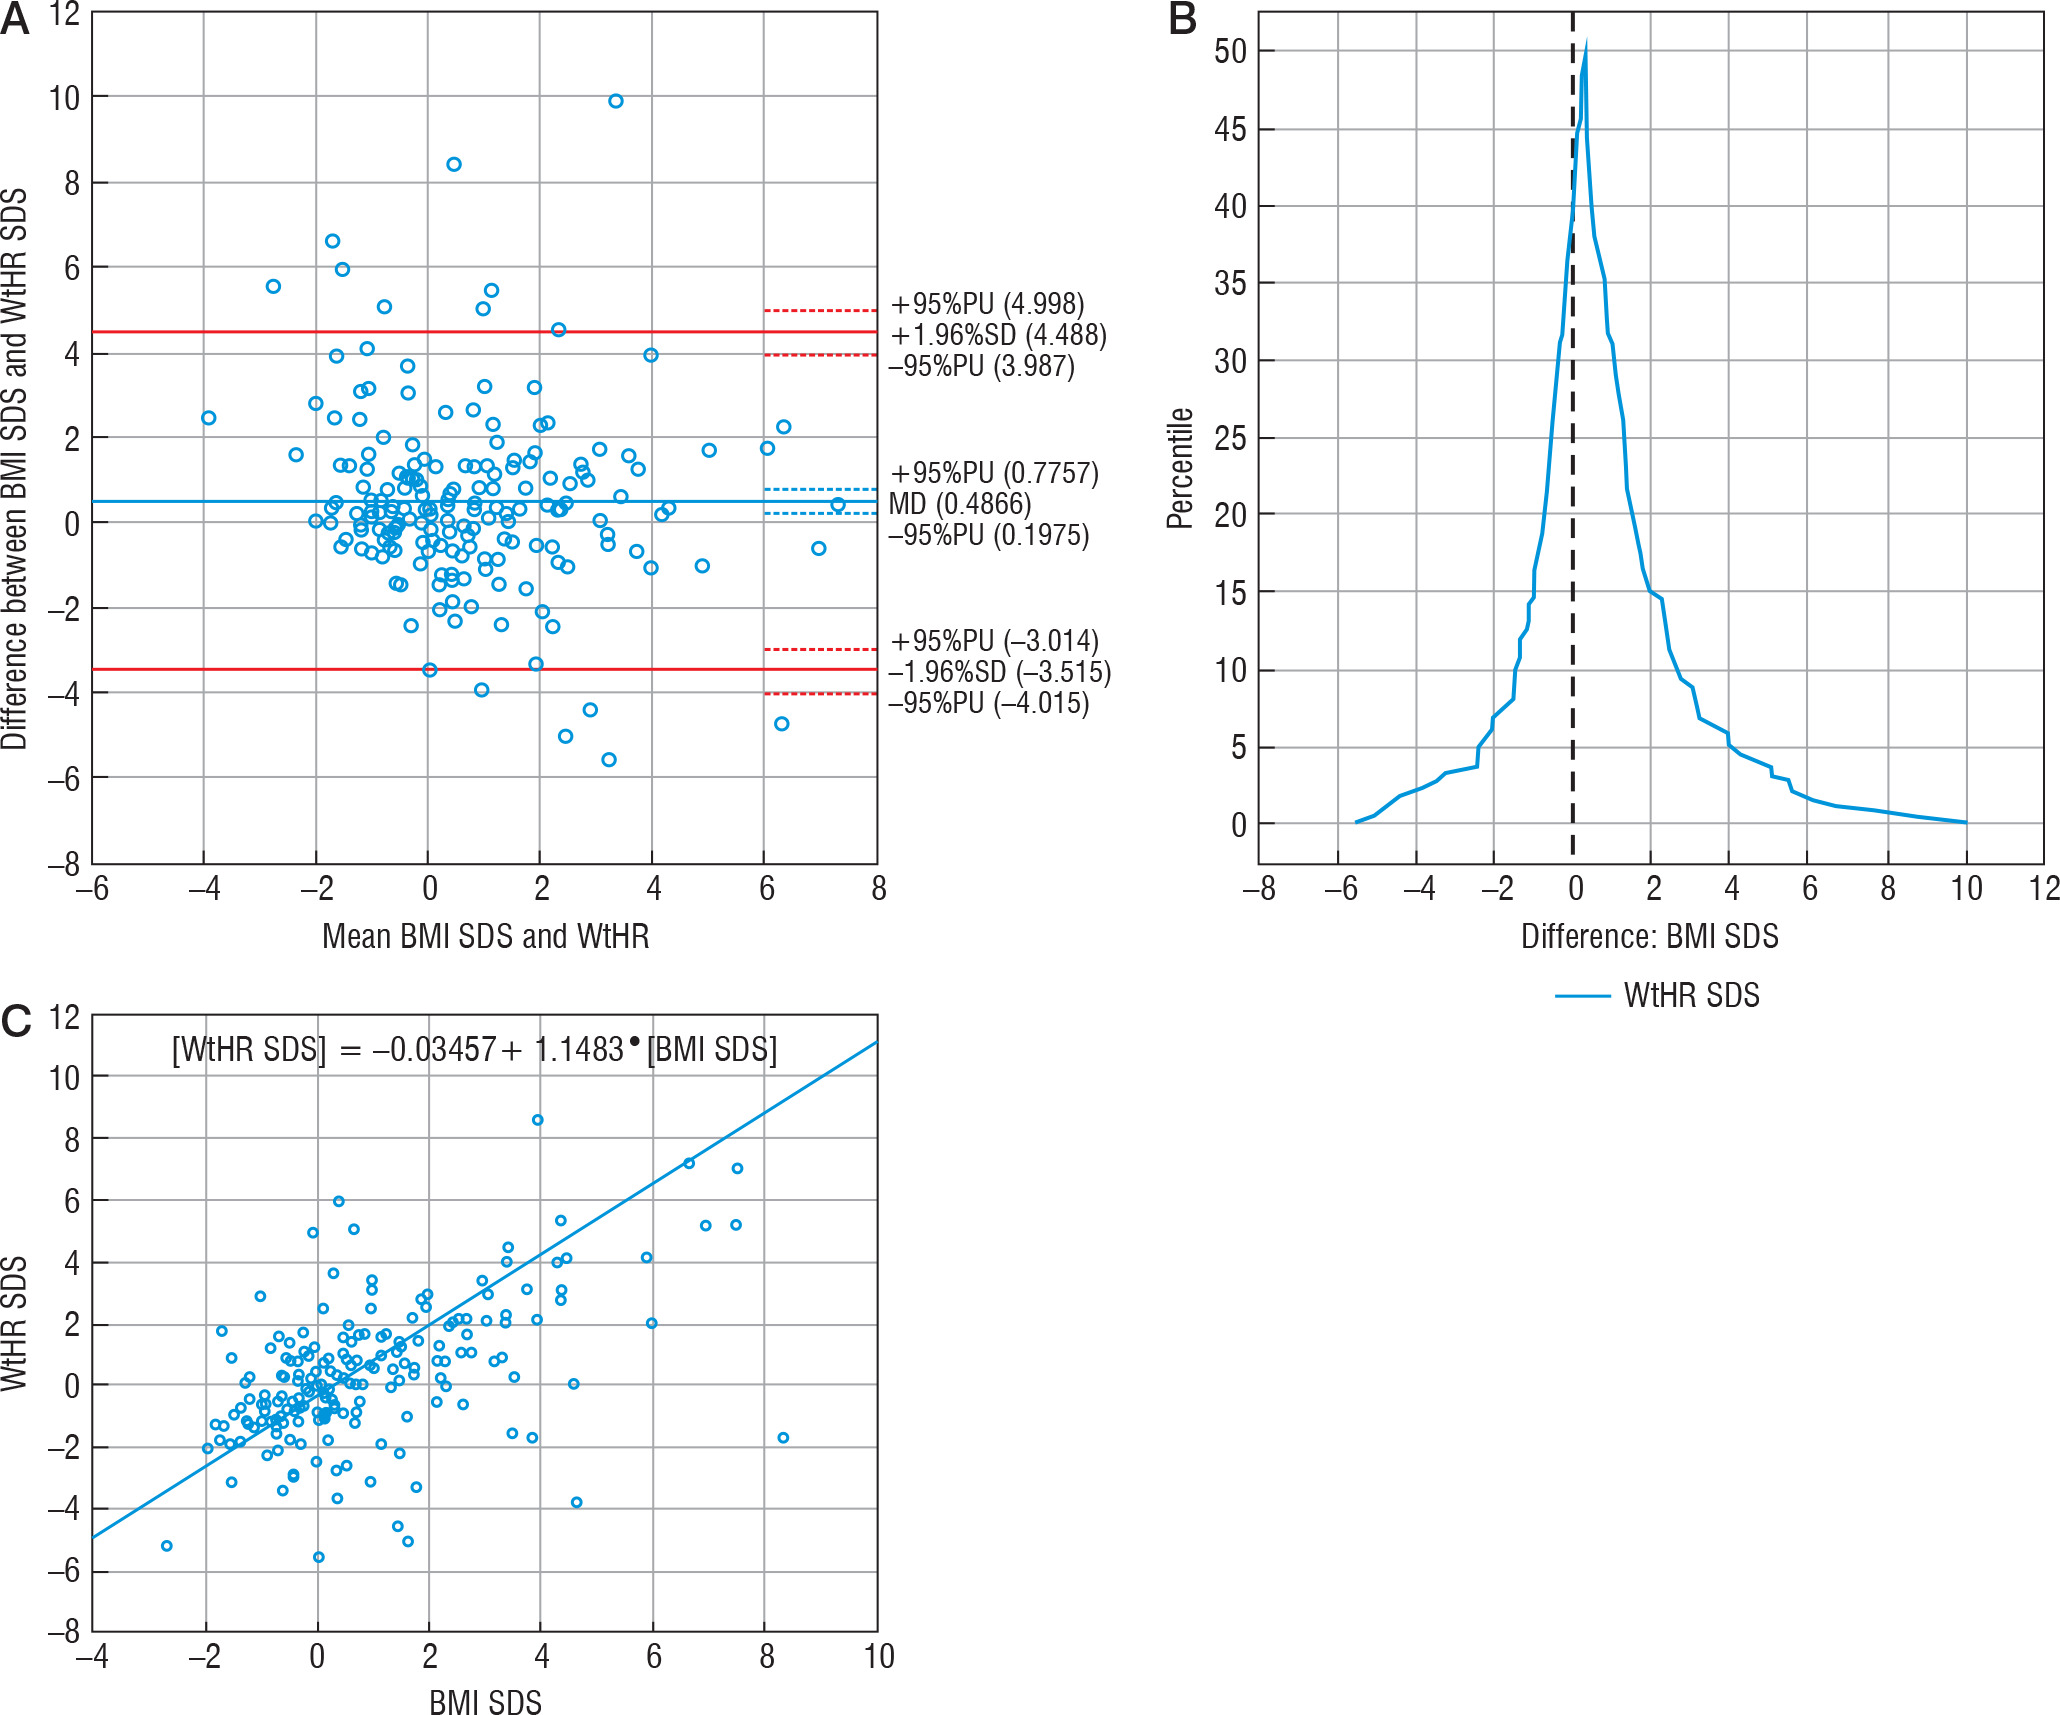
The difference between BMI SDS and WtHR SDS measurements (0.4866) was not statistically significant; 93.78% of patients (n = 181) were within the compliance range (Fig. 2A). Passing-Bablok regression showed the linearity of BMI SDS and WtHR SDS indicators statistically, and the slope B confidence interval included value = 1, which confirmed no proportional difference between these methods, but a value of 0 outside the confidence interval of the intercept A showed the existence of constant measurement error. In this case these 2 methods are not comparable according to Passing-Bablok regression (Fig. 2C). Mountain plot indicated the proximity (< 0.5) to the top of the figure with a zero point, which means that the medians of the compared methods were almost equal, and the narrower shape of the mountain plot (Fig. 2B) revealed that it was more accurate than WHR SDS. The 16.4% (n = 32) WtHR SDS measurement showed different obesity diagnosis than BMI SDS (Table IV). The WtHR SDS confirmed 39 obesities, but only 26 cases were confirmed by BMI SDS. The strong correlation between BMI SDS and WtHR SDS was confirmed (r = 0.52, p < 0.05). According to FMI SDS, WtHR SDS sensitivity and specificity were 61% and 88%, respectively.
Figure 2
Comparison of BMI SDS and WtHR SDS methods: A – Bland-Altman plot, B – mountain plot, C – Passing-Bablok regression BMI SDS – body mass index standard deviation score WtHR SDS – waist to height ratio standard deviation score
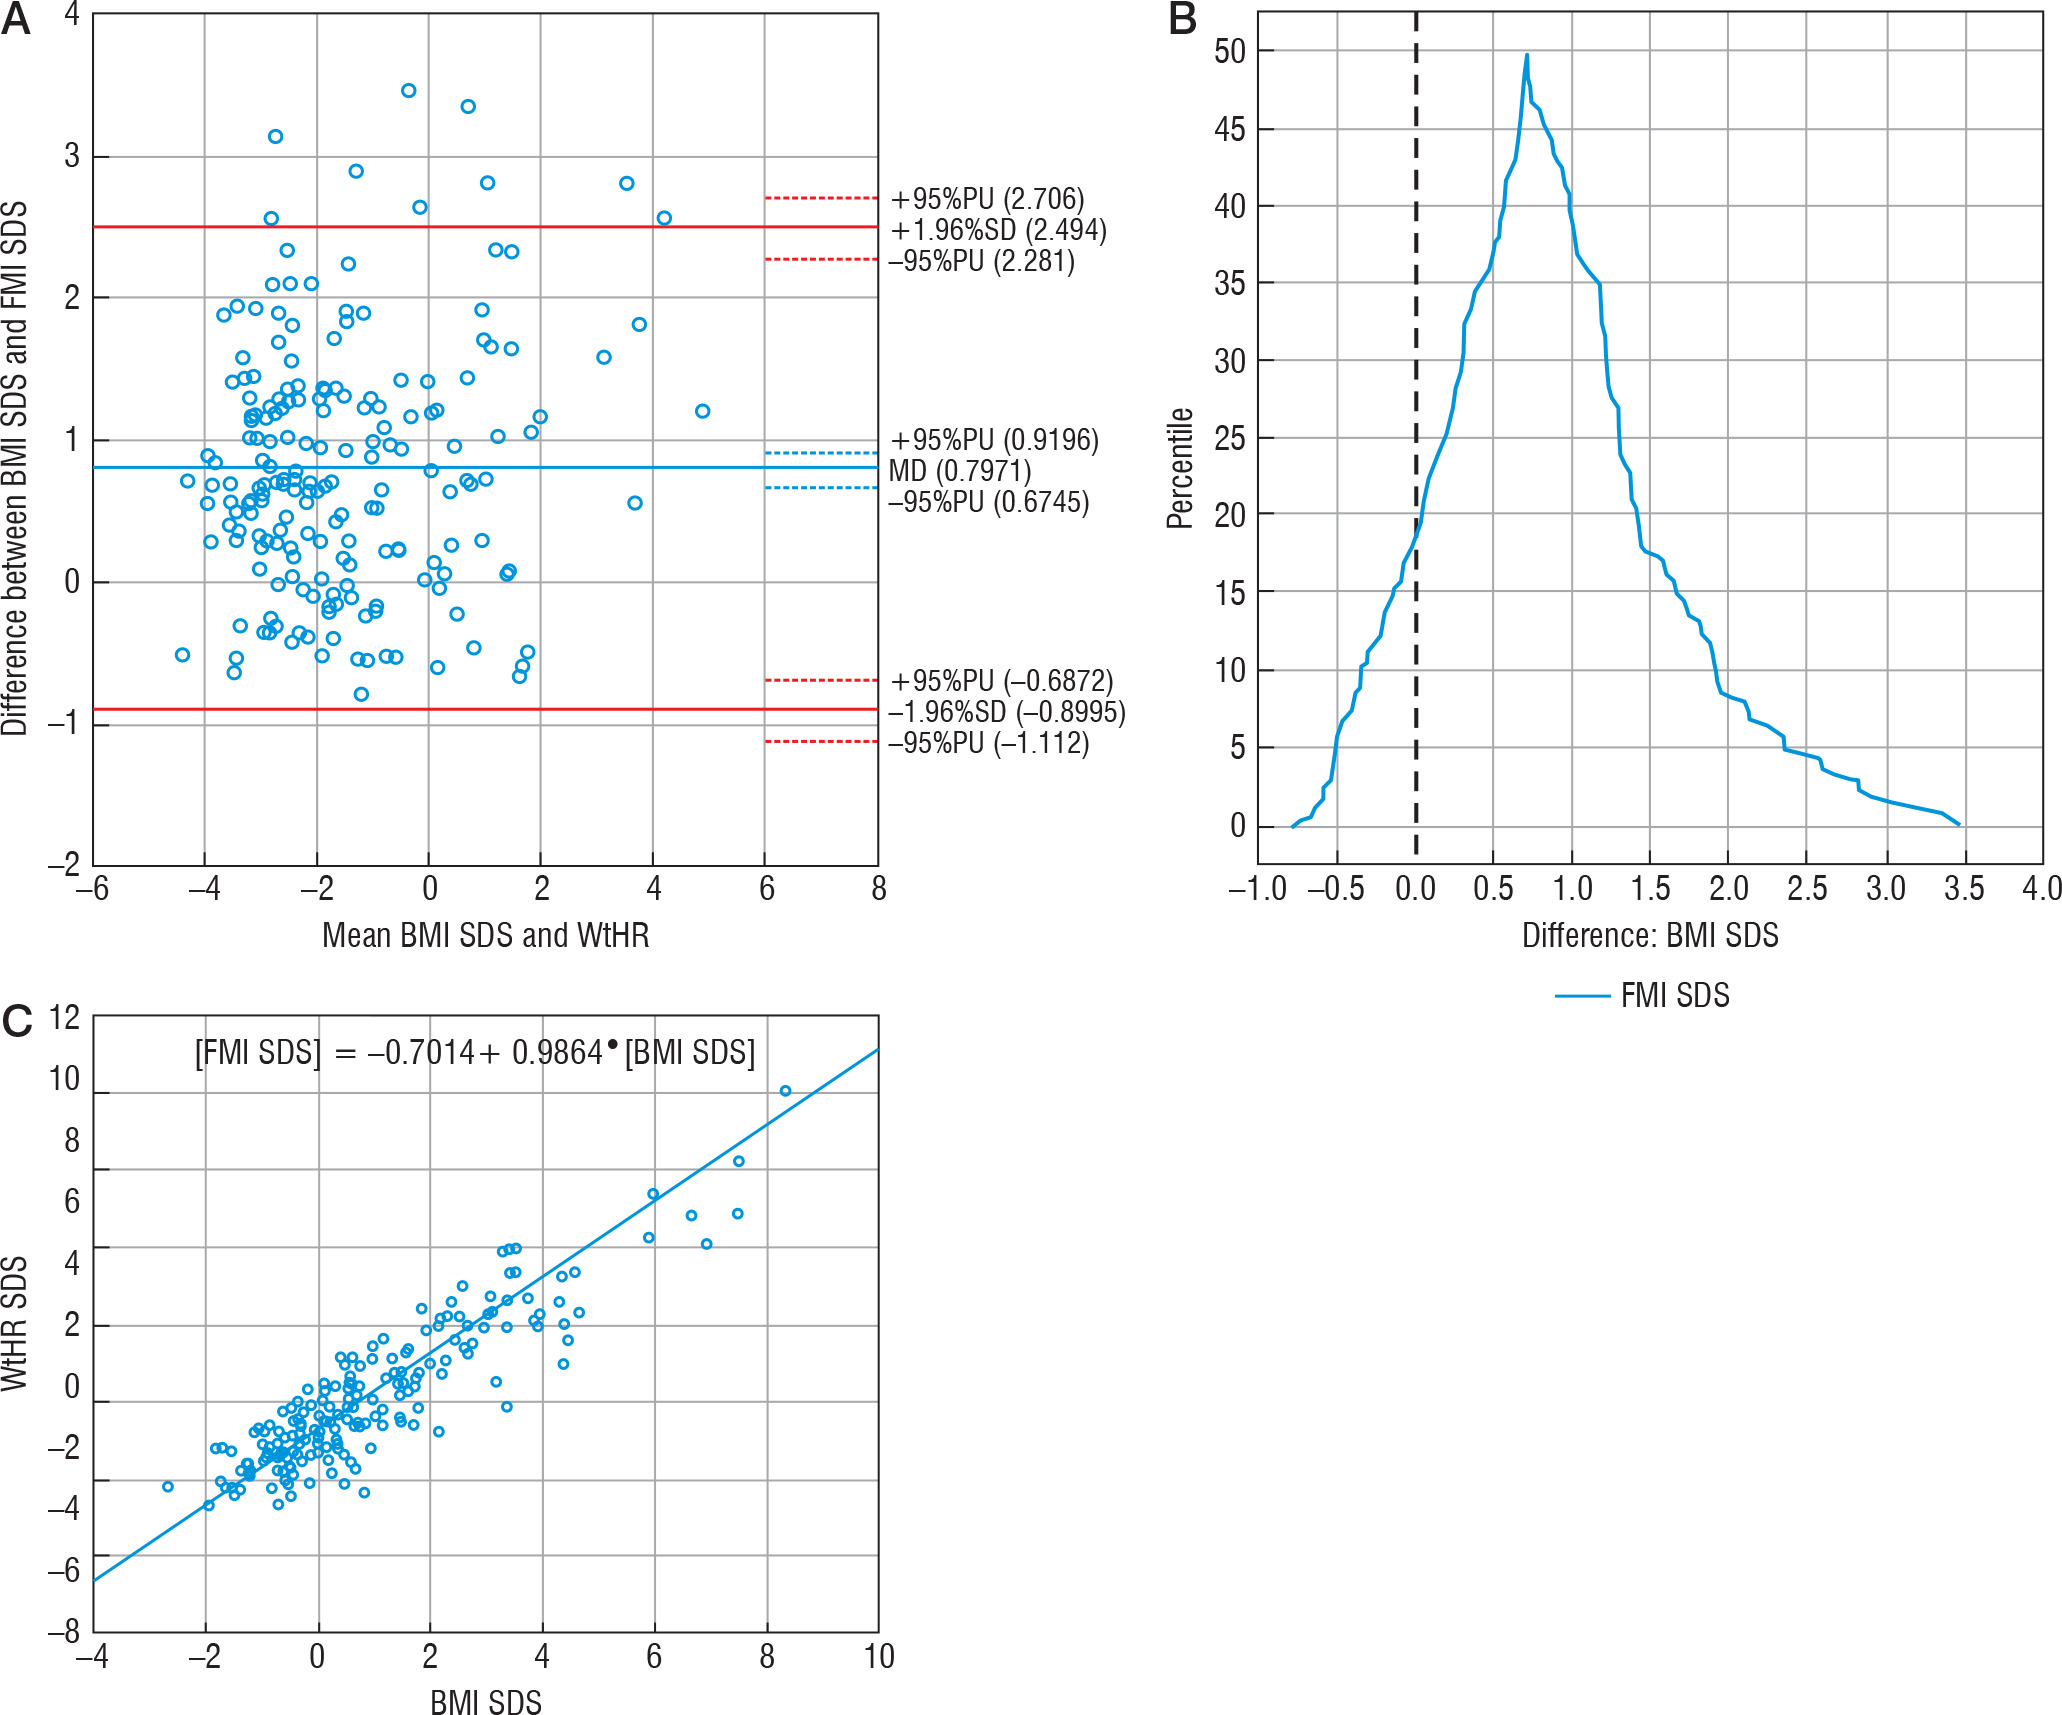
The statistical average difference between the measurements of BMI SDS and FMI SDS (0.7971) was statistically significant; 95.36% of measurements (n = 185) were within the 95% compliance range (Fig. 3A). The range of compliance was 3.3935. Passing-Bablok regression showed the linearity of BMI SDS and FMI SDS indicators, the slope B confidence interval included value = 1, which confirmed no proportional difference between these methods, but value = 0 outside the confidence interval of the intercept A showed the existence of constant measurement error; in this case, FMI SDS tended to show lower values than BMI SDS (Fig. 3C). Mountain plot showed the distance from the top of the graph to the zero points (> 0.5), which meant the medians of these methods were not equal. Nonetheless, this shape of the mountain plot indicated that the measurement difference between these 2 methods is repeatable and predictable (Fig. 3B). 8.2% (n = 16) of FMI SDS measurements showed different obesity diagnosis than BMI SDS (Table IV); 15 of them denied obesity diagnosed by BMI SDS. FMI SDS indicated that 15.90% of examined children were obese, while BMI SDS diagnosed 23.08% of children as obese. According to FMI SDS, BMI SDS sensitivity and specificity were 98% and 91%, respectively. A significantly strong correlation between BMI SDS and FMI SDS was calculated (r = 0.89, p < 0.05). FMI SDS, despite there being around 0.8 SDS constant difference compared to BMI SDS, agreed with body mass index in terms of diagnosis; a low variety of measurements explains this. Additionally, it was found that only FMI SDS showed a statistically significant mean value difference between females and males (♀ 0.53 vs. ♂ 0.28, p < 0.01).
Discussion
Comparing diagnostic methods is a complex study, which requires the use of proper statistical tools. Trying to prove the equality of methods using correlation tests does not reveal constant or proportional differences between measurements. Moreover, the correlation between methods does not prove an agreement between them [16, 17]. The advantage of this study is the use of more advanced statistical methods, which allows us to show the full view of the similarities and differences between the results obtained by different methods of diagnosing obesity. Passing-Bablok regression solves the problem of searching for measurement errors between 2 methods because it detects both constant and proportional differences [16]. Mountain plot, due to its shape, makes it is easy to compare 2 methods according to their median and variety of measurements [18]. Bland-Altman plot enables us to check if the bias is predictable and to measure its value when 95% of measurements in the Bland-Altman plot fall within the 95% compliance range [19]. Our results have shown that WHR is not a good indicator of childhood obesity and does not correlate with BMI or FMI. Although other researchers confirmed the correlation of WHR with %BF, it was weaker than for BMI or waist circumference [16, 17]. Adoption of a BMI cut-off point for the 97th percentile (BMI SDS = 2) shows satisfactory test specificity, but increasing the cut-off value would increase the sensitivity while maintaining adequate specificity [22]. BMI SDS sensitivity and specificity are, respectively, 98% and 91% according to FMI SDS. Lower specificity may be due to the large muscle mass of the population outside urban agglomerations [23]. The calculated specificity may be satisfactory but, due to the fear of the social consequences of diagnosing obesity in the child and adolescent population [24, 25], one should consider raising the BMI SDS limit to 2.2, which would translate into an increase in specificity to 92.5% and a decrease in sensitivity to 93.5%. Moreover, the authors emphasize that BMI should be considered as an easy to use and readily available screening test, but diagnosis of obesity should be made with the use of devices measuring the content of adipose tissue in the body.
The prevalence of obesity reaching at least 15% (according to FMI SDS) among juveniles in an educational institution should lead to the introduction of activities that affect students’ eating habits and improve their diet. Suggestions for these activities include enhancement in eating habits [26 ,27], increasing the legal guardians’ awareness of the role of television in obesity [28, 29], and applying a moderate energy restriction diet (1500-1600 kcal/day), the results of which are better than high energy restriction regarding long-term follow-up [30]. Not only should energy intake be taken into consideration, but also the quality of the diet [31, 32]. Some authors showed that it is better to start a weight-loss program at an earlier age [30, 33]. It is worth considering the continuation of programs at subsequent levels of education because follow-up treatments lead to better long-term BMI SDS reduction [34]. It is worth noting that insufficient fitness levels among Polish children can reach 36% of the group. Hence, children’s guardians should encourage students to practice sport [35]. There are factors other than diet and physical activity that help in obesity treatment. These include stress management, personal well-being, and good resilience [36]. Interventions should include a school or external psychologist who implements a cognitive-behavioural group treatment, which improves not only BMI SDS but also quality of life [37]. The formation of the intervention group should not be dependent on BMI because both overweight children and those with normal weight can be affected by metabolic disorders associated with glucose and fructose oversupply [32,38]. Essentially, all the mentioned interventions could be carried out in schools.
FMI is a better predictor of metabolic syndrome than BMI [8]. A timely diagnosis of metabolic syndrome allows the implementation of early intervention and reduces the risk of chronic conditions later in life [16, 39]. Nonetheless, FMI usage requires additional specialized equipment: scales capable of measuring bioimpedance or callipers. FMI measurements will expose physicians and nursing offices to a longer examination of the patient, which during screening tests on a large group is associated with a significant extension of work and study costs. On the other hand, the easy-to-calculate BMI is an alternative with sufficient specificity and sensitivity.
In the examined group only children with consent of their legal guardian and the children themselves were examined, not all obese children in school were assessed. We cannot exclude lower attendance among children who did not want to be considered because of their obesity, the stress associated with pubescence, dissatisfaction with their appearance for other reasons, or children who are already under the constant care of a physician. The authors assume that the real prevalence of obesity is higher.
Summary
Comparing various juvenile obesity evaluation methods, we must emphasize that the choice of method can decide on the diagnosis (as shown in Table IV). WHR SDS is not a good indicator for assessing childhood obesity, despite almost no mean difference between WHR SDS and BMI SDS. The sensitivity of WtHR is too low for it to be used as a paediatric obesity indicator in clinical practice. On the other hand, the strong correlation between BMI SDS and FMI SDS with the known mean difference shows that they can be used interchangeably, with the proviso that BMI SDS specificity may lead to the wrong diagnosis, especially when the resulting value is borderline with obesity. As such, patients with boundary values of body fat indicators should be examined more precisely, using more than one index. Lower FMI SDS values than BMI SDS lead to the conclusion that BMI, which does not distinguish muscle mass from fat mass, over-indicates obesity. This should be considered when examining children with high BMI SDS. They are athletic, because upper muscle mass with subcutaneous adipose tissue may give the false impression of pathological fat excess.
Conclusions
BMI, as the most acceptable obesity indicator, can be used as a screening method for assessing obesity. However, patients with boundary BMI values should be examined more closely, using more than one index; FMI is recommended. Body composition analysers using the bioimpedance method should be considered as necessary medical equipment in primary care practice.


