

 ENGLISH


Introduction
Turner syndrome (TS) is a chromosomal disorder that affects phenotypic females who have one intact X chromosome and complete or partial absence of the second sex chromosome in association with one or more clinical manifestations. Turner syndrome affects 25–50 per 100,000 females and can involve multiple organs through all stages of life. The clinical presentation includes the folllowing: short stature, characteristic dysmorphic features, and an increased risk of metabolic disorders – both lipid and carbohydrate [1–3]. Type 2 diabetes mellitus, impaired glucose tolerance, and insulin resistance are more common in women with TS and tend to develop at a younger age [3]. Women with TS demonstrate reduced glucose-stimulated insulin release, which is apparent even in young women with normal glucose homeostasis. This suggests that β-cell dysfunction or insufficiency is a primary feature of Turner metabolic syndrome. The pathogenesis behind progressive β-cell failure is not clear [4, 5]. The accumulation of visceral fat in TS predicts a higher risk of development of impaired glucose homeostasis [5]. Other studies show that increased insulin resistance in women with TS is independent of measures of body composition and may represent an intrinsic defect related to their chromosomal abnormality [6]. Even young, normal-weight TS women show significantly impaired glucose homeostasis [7]. The life expectancy in TS is reduced by at least 10 years. Cardiometabolic markers potentially present in girls and women with TS, except for impaired insulin secretion, are weight deficit at birth and muscle fibre composition [8].
Currently, TS patients are treated with recombinant human growth hormone (rGH) as standard therapy as soon as growth impairment is stated [3]. Short-term GH administration has been associated with favourable changes in body composition but also with relative impairment of glucose tolerance and insulin sensitivity [9]. After a longer period of time, following rGH treatment, abdominal adiposity is significantly lower and glucose tolerance significantly better in GH-treated girls with TS. These findings suggest that GH’s salutary effects on body composition outweigh the acute effects of insulin antagonism in girls with TS [10].
The aim of the current study was to assess possible metabolic alterations following rGH therapy.
Material and methods
The study comprised 53 TS patients who were genetically confirmed at the Department of Biology and Genetics of the Medical University of Gdansk. Patients with thyroid pathology and diabetes mellitus were excluded. The study was approved by the local Bioethics Committee. Patients were divided into 2 groups: group 1 included patients who finished rGH therapy (n = 37), mean age 20.87 ±3.69 years, age at start of rGH therapy was 11.73 years, treatment duration was 4.84 years, interval between rGH discontinuation and study was 4.46 years; group 2 was composed of patients who did not receive growth-promoting therapy, i.e. rGH, oxandrolone and other metabolic steroids, and whose growth was completed at the time of diagnosis (n = 16), mean age 23.16 ±5.8 years. The mean age did not differ significantly between groups. There were 40.5% of patients with X chromosome monosomy in group 1 and 31.2% in group 2; mosaic TS: 43.2% in group 1 and 62.5% in group 2. The rarest variant of the karyotype was chromosome X aberration – group 1: 16.2% and group 2: 6.25%. The spontaneous puberty in group 1 was 18.9% and in group 2 – 43.7%. Patients with pharmacological induction of maturation – group 1: 81.1% and group 2: 56.3%. The mean year of puberty (spontaneous or induced) was 14.2 in group 1 and 14 years in group 2. In both groups, patients without spontaneous puberty become hormonal replacement therapy, no drugs apart from rGH and sex hormones were given.
Patients were interviewed and examined anthropomorphically by measuring: height (in cm) using a Harpenden stadiometer, weight (in kg) with a 0.1 kg accuracy, and waist and hip circumferences (in cm). Waist-to-hip ratio (WHR) and body mass index (BMI) were calculated. Body composition was assessed using bioelectrical impedance (using Bodystat 1500). Carbohydrate and lipid metabolism was assessed based on laboratory tests. Glucose and insulin concentrations were assessed at the following times: 0 (fasting), 30, 60, 90, 120, and 150 minutes of oral glucose tolerance test (OGTT). Glucose serum concentration was determined using an enzymatic spectrophotometric method. Insulin serum concentration was determined using a chemiluminescence marker and anti-insulin antibody-coated microparticles. HbA1c was determined using high-performance liquid chromatography method. Total cholesterol, high-density lipoprotein cholesterol (HDL-C), and triglycerides (TG) were determined using an enzymatic method. Low-density lipoprotein cholesterol (LDL-C) concentration was calculated using the Friedewald formula. Adipokine and hs-CRP concentrations were assessed using immunoenzymatic assays (ELISA): adiponectin (Total Adiponectin R&D Systems), omentin (Biovendor), obestatin (Wuhan EIAab science), visfatine (Wuhan EIAab Science), leptin (DRG), apelin (RayBio), RBP (Wuhan EIAab Science), resistin (R&D Systems), vaspin (Biovendor), and hsCRP (DRG). All tests were interpreted with a STAT FAX 2200 analyser.
The following indices were calculated based on fasting and OGTT glycaemia and insulinaemia: HOMA-IR, (homeostasis model assessment of insulin resistance), HOMA-β (homeostasis model assessment of β-cell function), QUICKI (quantitative insulin sensitivity check index), and Matsuda index. Indices of pancreatic β-cell function were calculated: oral disposition index (Dio), which measures sensitivity to oral glucose intake, and insulin secretion-sensitivity index-2 (ISSI-2) [11, 12].
In the first stage of the analysis standard descriptive statistics of the assessed variables were calculated. The area under the curve of blood glucose and insulin levels were measured using cubic splines. Group comparisons were evaluated using t Student and U Mann-Whitney tests and analysis of variance tests with post-hoc tests. Correlations between variables were tested using Spearman’s method. Relationships between categorical variables were evaluated using the χ2 test. The minimum level of significance was 0.05.
Results
In the rGH-treated group (group 1) the mean BMI was 23.6 ±3.1 kg/m2, waist circumference 78.5 ±11.2 cm, and WHR 0.82 ±0.07. In group 2 the mean BMI was 24.6 ±5.07 kg/m2, waist circumference 79.9 ±15.8 cm, and mean WHR 0.87 ±0.12. There were no statistically significant differences between the 2 groups in respect to these parameters. There were, respectively, 35.16 and 43.8% overweight and obese patients in groups 1 and 2. The difference was not statistically significant (p = 0.482). There was a statistically significant lower percentage of fat tissue in group 1 compared to group 2. The mean percentage of fat tissue was 27.46% and 31.75%, respectively, for groups 1 and 2.
Insulin resistance and sensitivity indices were also not statistically different between groups 1 and 2. Similarly, no statistically significant differences were found in the function of pancreatic islets’ β cells. Insulin secretion indices in relation to instantaneous insulin sensitivity (DIo, ISSI-2) also did not differ significantly (Table I).
Table I
Insulin sensitivity and pancreatic islets β cell function
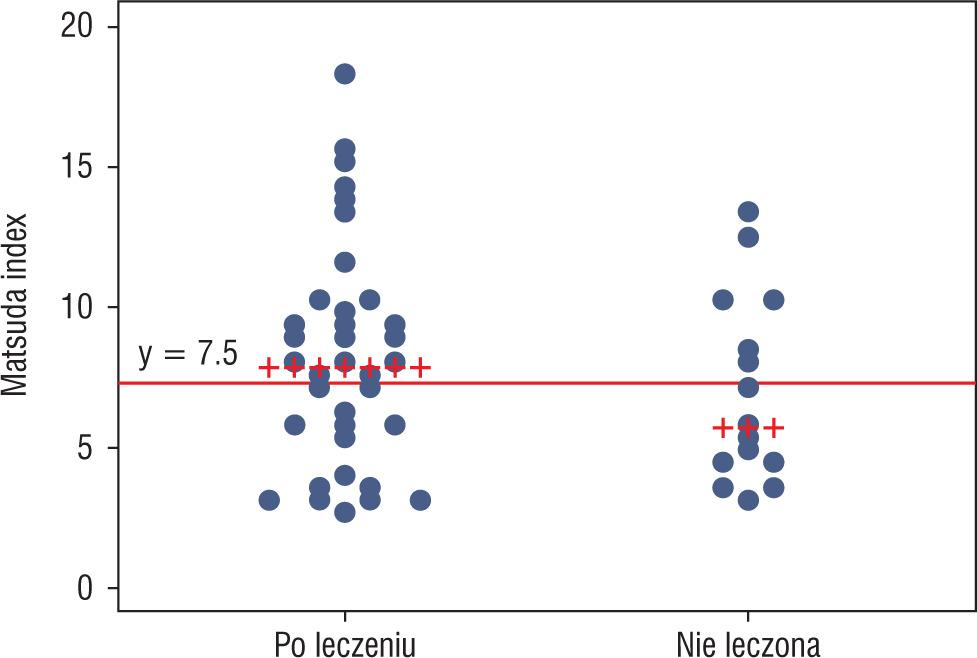
To detect patients with insulin resistance, a definition based on the Matsuda index was used, i.e. an index value of 7.3 or less. Using this criterion, more patients who met criteria of insulin resistance were found in group 2 than in group 1, i.e. 56.25% vs. 37.84%, respectively; however, this difference was not statistically significant (p = 0.2). The proportion of patients who met the criteria of insulin resistance in both groups is shown in Figure 1.
Figure 1
Matsuda index values with a cut-off marking the criterion of insulin resistance (Matsuda index ≤ 7.3). Patients with Matsuda index value ≤ 7.3 were insulin resistant (values below the marked line)
No statistically significant differences were found in TC, LDL-C, HDL-C, and TG concentrations between groups (Table II). The concentrations of selected adipokines and hsCRP did not differ between groups 1 and 2 (Table III).
Table II
Lipid concentration
| Parameter | Group 1 | Group 2 | p | ||
|---|---|---|---|---|---|
| Mean | SD | Mean | SD | ||
| TC [mg%] | 182.8 | 32.3 | 183.1 | 31.1 | NS |
| LDL-C [mg%] | 111.6 | 32.9 | 112.3 | 22.7 | NS |
| HDL-C [mg%] | 57.2 | 9.4 | 54.7 | 15.7 | NS |
| TG [mg%] | 84.1 | 36.8 | 81.1 | 25.7 | NS |
Table III
Adipokine and hsCRP concentrations.
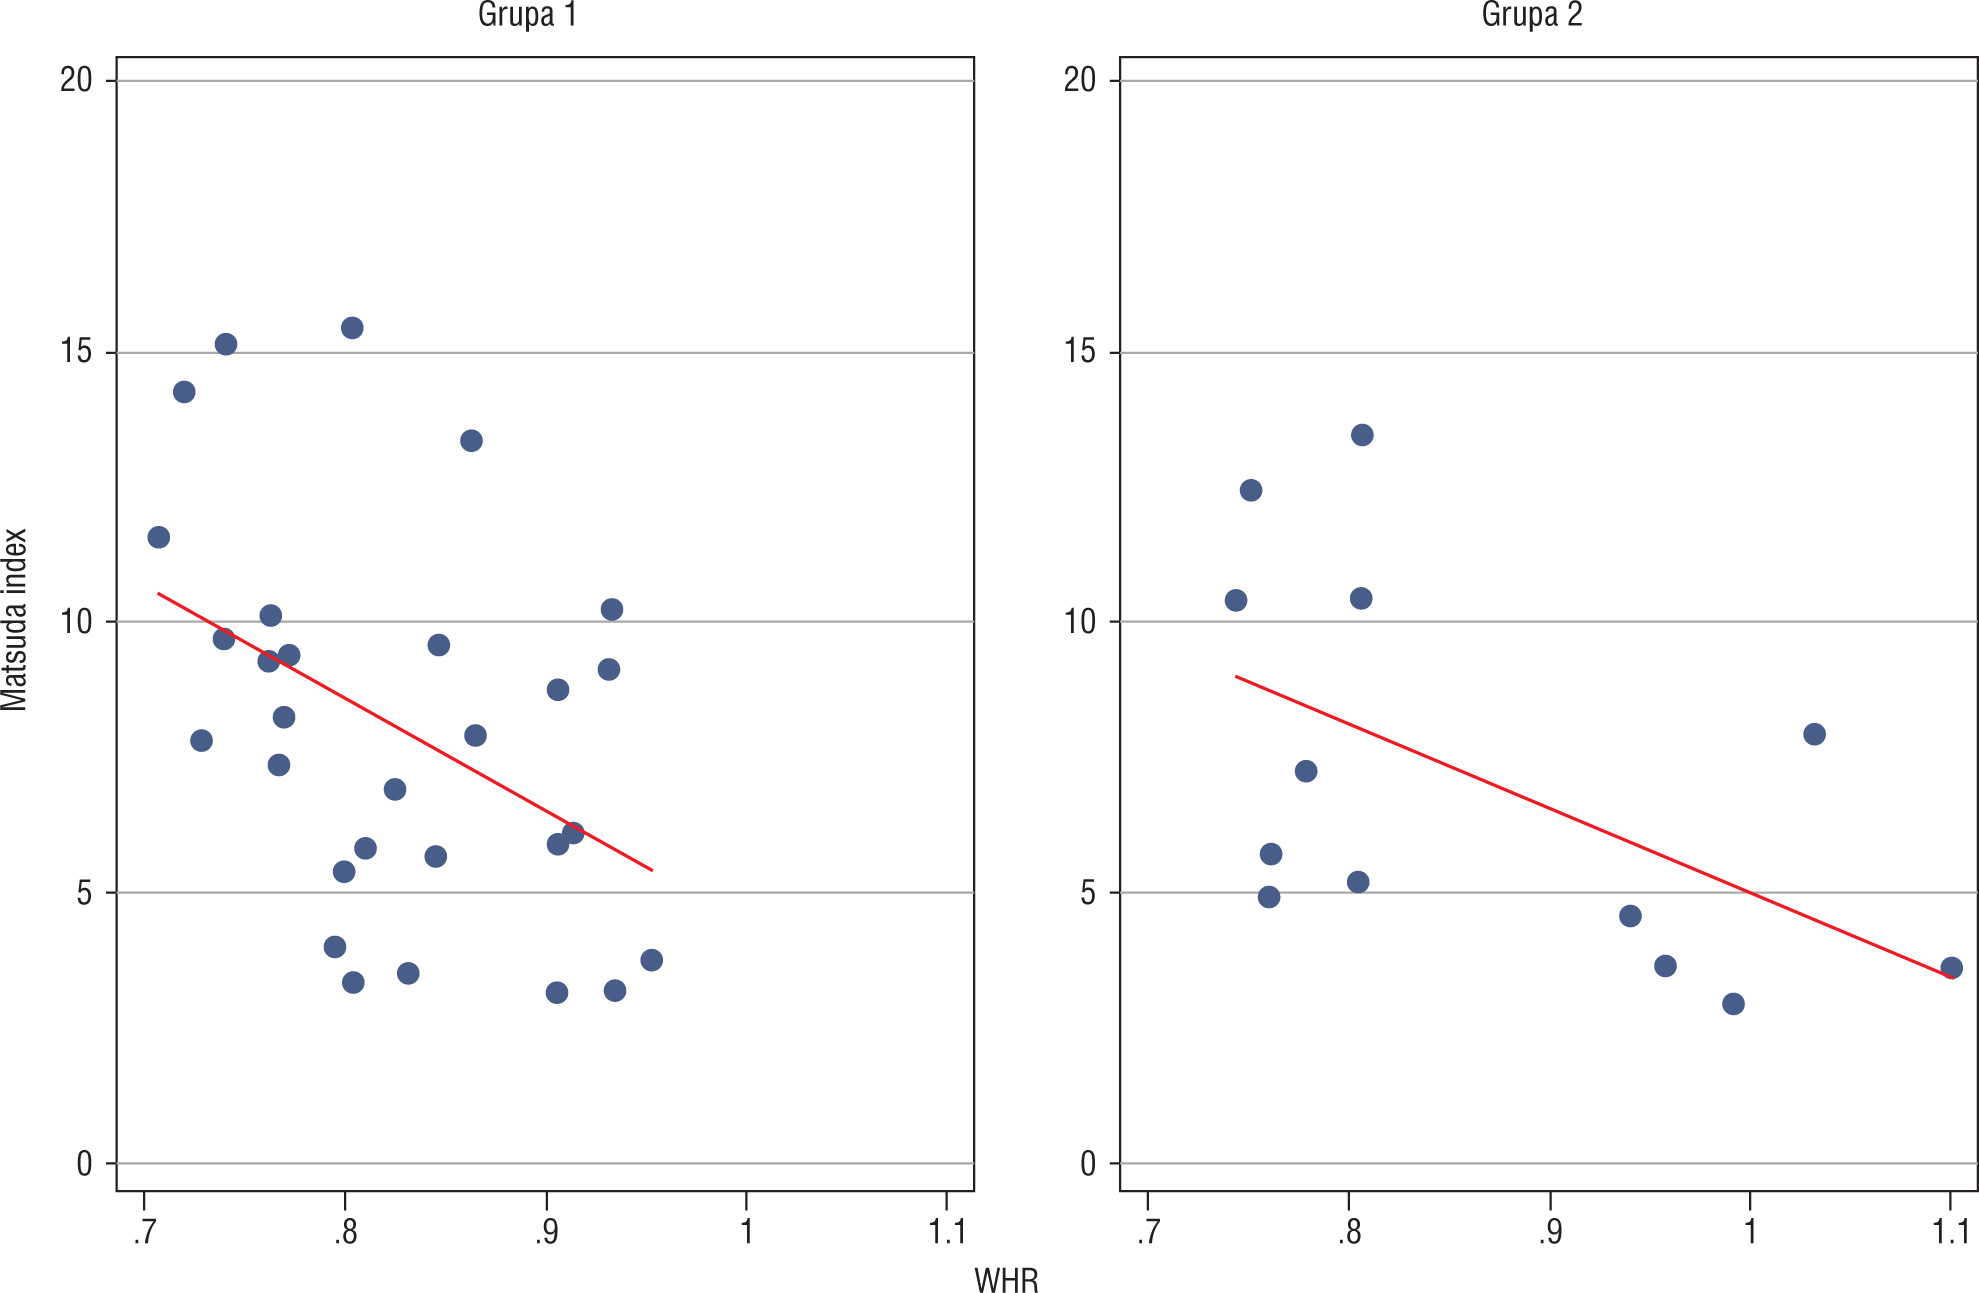
Analysis of relationships between selected anthropomorphic and metabolic parameters in group 1 revealed a negative correlation between WHR and Matsuda index (p = 0.0177; Figure 2).
Discussion
A subtle difference in insulin resistance between groups 1 and 2 was observed in this study, which was established on the basis of the Matsuda index. In our report no differences were found between other pancreatic islet β cells function indicators. An increase in insulin resistance during rGH therapy in TS patients has been confirmed in numerous studies. In comparison to HOMA-IR and QUICKI, the Matsuda index has the highest sensitivity in detecting insulin resistance both in persons with normal and with impaired glucose tolerance; this index strongly correlates with insulin sensitivity assessment using the euglycemic and hyperglycaemic clamp method. The difference in insulin resistance in this study, which was established on the basis of the Matsuda index, may suggest that patients who had been treated with rGH in the past were in slightly better metabolic condition. In several reports where the long-term effects of rGH on insulin sensitivity were evaluated, also after finishing the therapy, its decrease was recorded [12–18]. However, there are also contrasting reports in which no difference was observed depending on whether rGH therapy was present or not [19–22].
In our study we found no significant differences in BMI and WHR depending on whether rGH therapy was applied or not. The same was observed by others [23–25]. In our own study the mean fat content was lower in group 1 than in group 2; the difference was statistically significant. These results are in line with data reported by other researchers, who noted a significant decrease in fat tissue and an increase in non-fat body mass in TS patients during rGH therapy [9, 26]. In a study by Ari et al. [27] a significantly lower body fat amount in rGH-treated patients was confirmed; this effect persisted after finishing the therapy. In another cross-sectional study by American authors [10] a beneficial effect on body composition of rGH-treated girls was recorded 2 years after the therapy was finished in comparison to untreated patients. Based on available data [10, 27] and our own results, it can be concluded that the beneficial effect of rGH on the amount of adipose tissue and an increase in lean body weight in TS patients persists for at least several years after finishing the therapy.
Our results showed no differences in concentrations of selected adipokines between groups 1 and 2. It is known that adiponectin levels negatively correlate with the degree of obesity. Decreased adiponectin concentrations are also observed in patients with insulin resistance and diabetes [28]. In TS the abnormalities of glucose homeostasis do not follow the classical pattern associated with the MS and may result from a unique metabolic defect. The regulation of adipokine concentrations may also be different in patients with TS [29]. Darendeliler et al. evaluated changes in leptin, ghrelin, and adiponectin concentrations as well as insulin sensitivity in TS patients treated with rGH for 12 months [30]. In this study adipokines were measured during rGH therapy. It is, therefore, not possible to compare their results with our data. One study described higher levels of adiponectin, while another study noted elevated CRP and Interleukin 6 levels in TS [29, 31]. In the available literature we were not able to find reports on the effect of rGH therapy on recently characterized adipokines: omentin, visfatin, and obestatin. Further work is required to understand the status of adipokines in TS patients. Maybe new markers of the metabolic syndrome – BDNF (brain-derived neurotrophic factor), MMP-1, MMP-2 (matrix metalloproteinase) – will be found as potential indicators of higher risk of cardiometabolic complications in girls with TS [32, 33].